. 2021 Mar;70(3):773-786.
doi: 10.1007/s00262-020-02733-2. Epub 2020 Sep 28.

Systematic analysis of immune-related genes based on a combination of multiple databases to build a diagnostic and a prognostic risk model for hepatocellular carcinoma

Affiliations

Systematic analysis of immune-related genes based on a combination of multiple databases to build a diagnostic and a prognostic risk model for hepatocellular carcinoma

Di-Guang Wen et al. Cancer Immunol Immunother. 2021 Mar.

Abstract

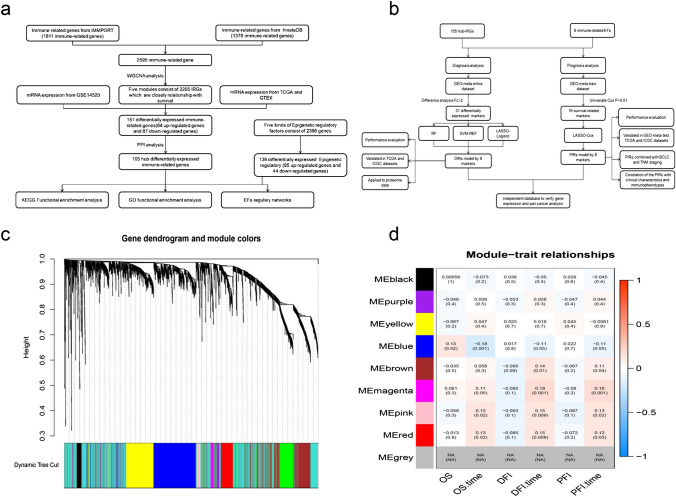
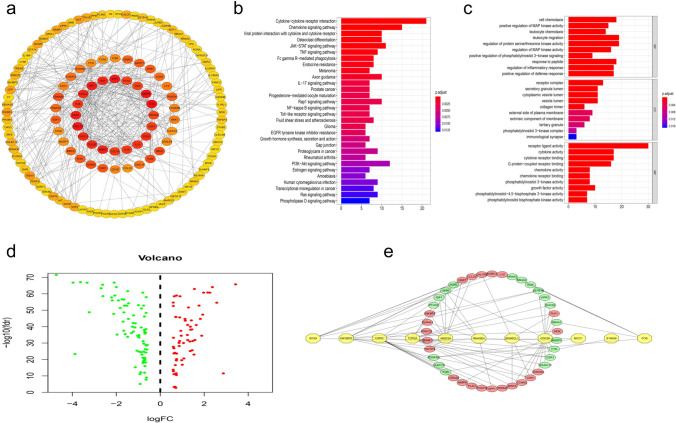
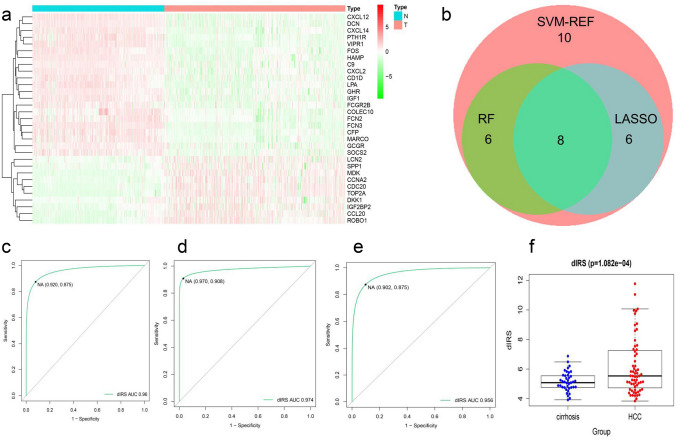
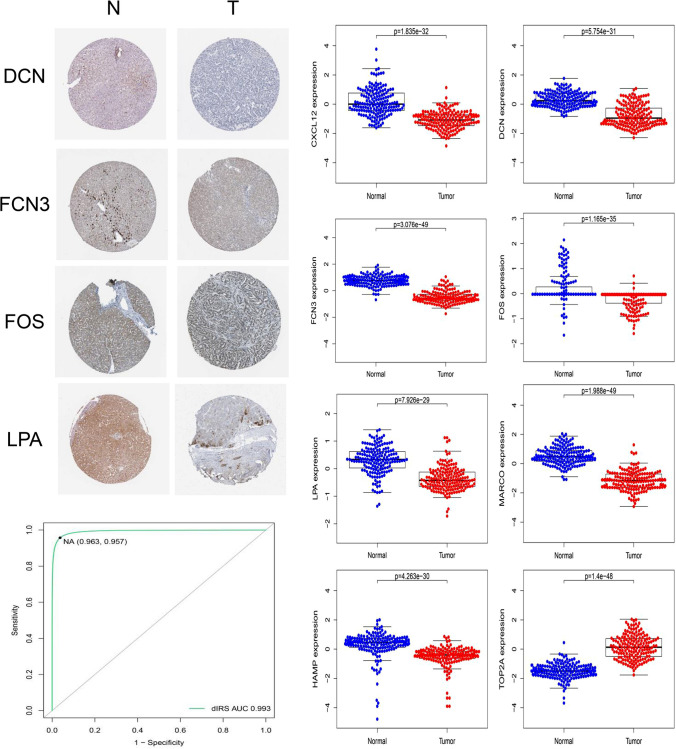
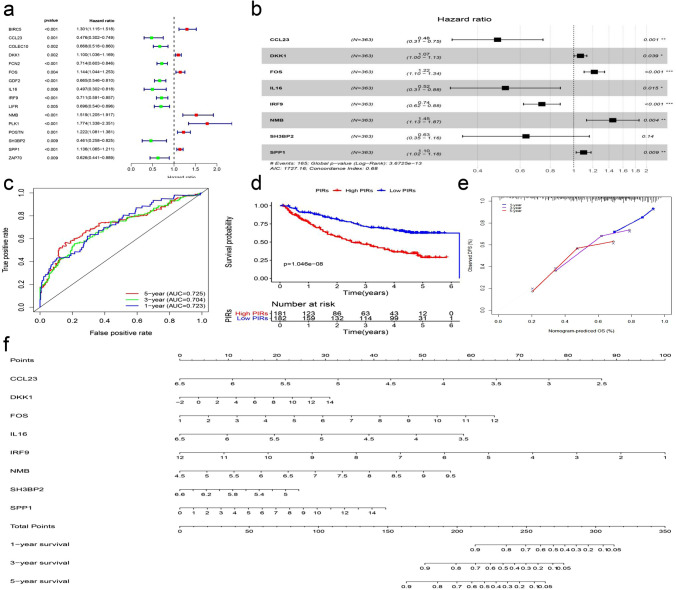
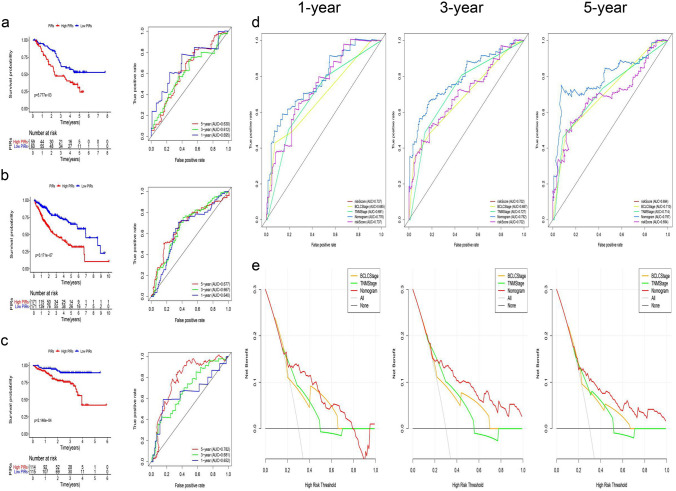
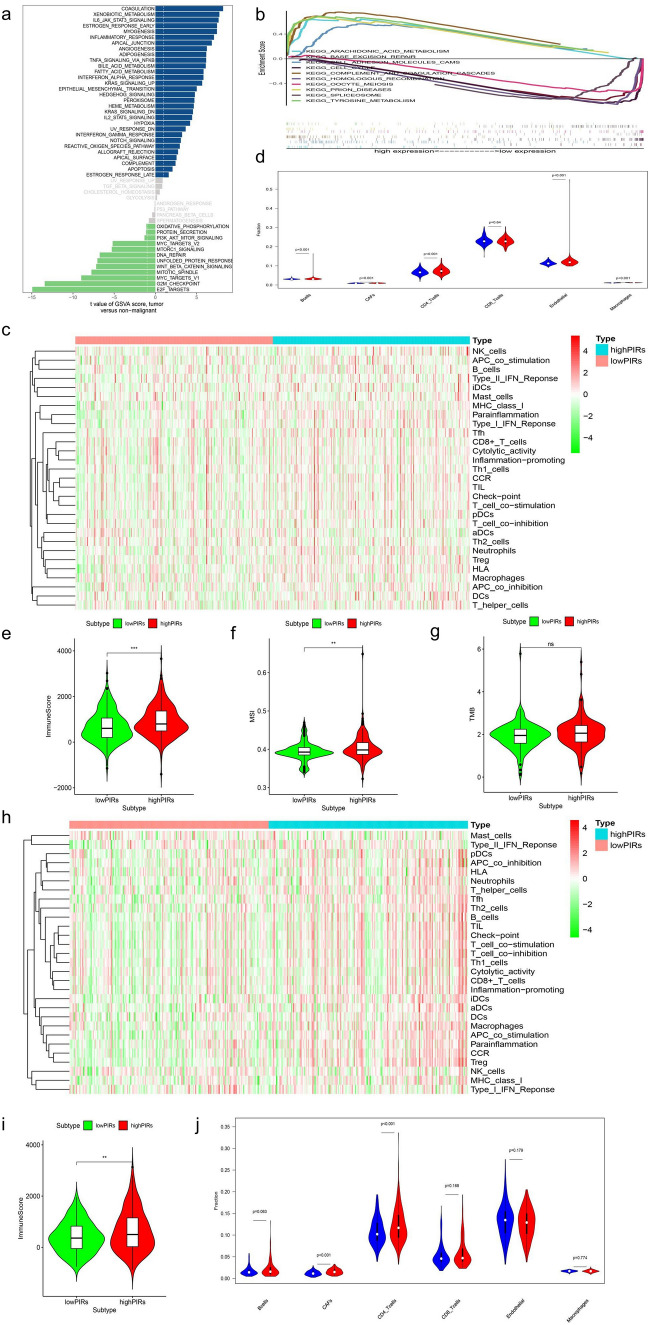
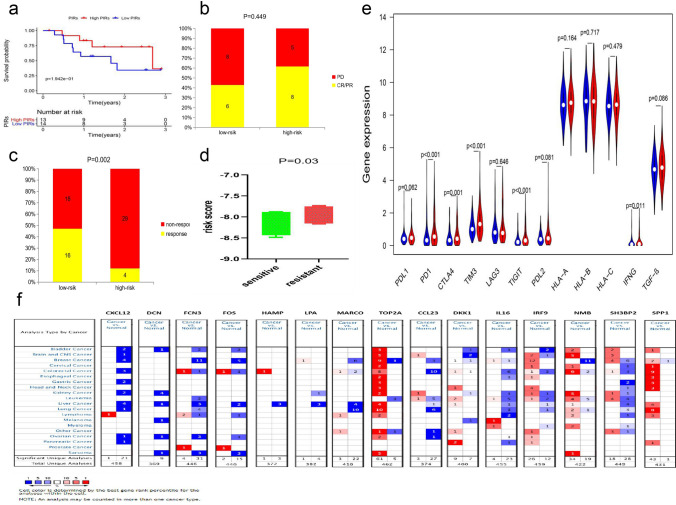
The immune microenvironment plays a vital role in the progression of hepatocellular carcinoma (HCC). Thousands of immune-related genes (IRGs) have been identified, but their effects on HCC are not fully understood. In this study, we identified the differentially expressed IRGs and analyzed their functions in HCC in a systematic way. Furthermore, we constructed a diagnostic and a prognostic model using multiple statistical methods, and both models had good distinguishing performance, which we verified in several independent datasets. This diagnostic model was also adaptable to proteomic data. The combination of a prognostic risk model and classic clinical staging can effectively distinguish patients in high- and low-risk groups. Furthermore, we systematically explore the differences in the immune microenvironment between the high-risk group and the low-risk group to help clinical decision-making. In summary, we systematically analyzed immune-related genes in HCC, explored their functions, constructed a diagnostic and a prognostic model and investigated potential therapeutic schedules in high-risk patients. The model performance was verified in multiple databases. Our findings can provide directions for future research.

Keywords: Bioinformatics; Diagnostic model; Hepatocellular carcinoma; Immune microenvironment; Immune therapy; Prognostic risk model.


Conflict of interest statement

No benefits in any form have been received or will be received from a commercial party related directly or indirectly to the subject of this article.

Figures

Fig. 1
Fig. 1
a, b The analysis flowchart in this study. Abbreviations: Epigenetic regulatory factors, RF: random forest, SVM: support vector machine. c, d The WGCNA analysis of immune-related genes consisting of nine modules
Fig. 2
Fig. 2
a Protein–protein interaction network of immune-related genes which node > 3. b Top 30 enrichment functions analyzed of 105 hub-IRGs by KEGG. c The GO enrichment analysis of 105 hub-IRGs, which top ten functions of each term. d The differential expression of 105 hub-IRGs which participate in establishing EFs-regulatory networks. e The EFs-regulatory networks which correlation coefficient > 0.35 between hub-IRGs and EFs both in TCGA-LIHC dataset and GSE14520 dataset
Fig. 3
Fig. 3
a The expression of 31 diagnostic markers in the GEO-meta dataset. b Venn diagram of the intersection of RF, SVM and LASSO to find diagnostic markers. c The ROC curve of dIRS for distinguishing patients with HCC in the GEO-meta dataset. d The ROC curve of dIRS for distinguishing patients with HCC in TCGA-LIHC dataset. e The ROC curve of dIRS for identifying patients with HCC in the ICGC-JP dataset. f The dIRS of between HCC and cirrhosis in the GSE14323 dataset
Fig. 4
Fig. 4
a Immunohistochemistry in HPA database of eight dIRS-related genes in HPA database which the database did not detect the protein expression of CXCL12, HAMP, MARCO, and TOP2A. b The protein expression of eight dIRS-related genes in the CPTAC database. c The ROC curve of dIRS for distinguishing liver cancer tissues and normal liver tissues in the CPTAC-LIHC dataset based on the above diagnostic model
Fig. 5
Fig. 5
a 16 prognostic marker using univariate Cox regression model which P value < 0.01. b Eight prognostic marker using LASSO regression analysis and both-way multivariate Cox regression model. c The area under the ROC curve (AUC) of PIRs for 1-, 3- and 5-year OS in GEO-meta train dataset. d Survival analysis of PIRs in GEO-meta train dataset. e Calibration curve of PIRs in GEO-meta train dataset. f The nomograms for predicting 1-, 3-, and 5-year survival rate in GEO-meta train dataset
Fig. 6
Fig. 6
a The ROC curve and survival analysis of PIRs for predicting HCC patient survival in the GEO-meta test dataset. b The ROC curve and survival analysis of PIRs for predicting HCC patient survival in the TCGA-LIHC dataset. c The ROC curve and survival analysis of PIRs for predicting HCC patient survival in the ICGC-JP dataset. d The ROC curve of combining PIRs, BCLC and TNM stage predicts HCC patient survival in the GEO-meta train dataset. e Decision curve of combining PIRs, BCLC and TNM stage for showing the benefits to HCC patients in the GEO-meta train dataset
Fig. 7
Fig. 7
a Enrichment functions of GSVA between high-PIRs group and low-PIRs group. b Enrichment functions of GSEA between high-PIRs group and low-PIRs group. c Difference of 29 immune-related signals between high-PIRs group and low-PIRs group using ssGSEA analysis in GEO-meta entire dataset. d Difference of six immune cells between high-PIRs group and low-PIRs group in GEO-meta entire dataset. e Difference of immune scores between high-PIRs group and low-PIRs group in GEO-meta entire dataset. f The difference of MSI between high-PIRs and low-PIRs group. g Difference of TMB between high-PIRs and low-PIRs group. h The difference of 29 immune-related signals between high-PIRs group and low-PIRs group using ssGSEA analysis in TCGA-LIHC dataset. i The difference of immune scores between high-PIRs group and low-PIRs group in TCGA-LIHC dataset. j Difference of six immune cells between high-PIRs group and low-PIRs group in TCGA-LIHC dataset
Fig. 8
Fig. 8
a Survival analysis of patients with melanoma accepted PD1 therapy between high-PIRs group and low-PIRs group in GSE78820 dataset. b The difference of response for patients with melanoma received PD1 therapy between high-PIRs group and low-PIRs group in GSE78820 dataset. c The difference of response for patients with HCC accepted sorafenib therapy between high-PIRs group and low-PIRs group in GSE109211. d Difference of PIRs between sorafenib-sensitive HCC cell and sorafenib-resistent HCC cell in GSE73571 dataset. P value of one-tail T test is 0.03 and P value of two-tail T test is 0.06. e The differential expression of immunotherapy markers between high-PIRs and low-PIRs. f Differential expression of dIRS-related and PIRs-related genes based on the Oncomine database

References

    1. Yang JD, Hainaut P, Gores GJ, Amadou A, Plymoth A, Roberts LR. A global view of hepatocellular carcinoma: trends, risk, prevention and management. Nat Rev Gastroenterol Hepatol. 2019;16(10):589–604. doi: 10.1038/s41575-019-0186-y. - DOI - PMC - PubMed
    1. Turato C, Balasso A, Carloni V, Tiribelli C, Mastrotto F, Mazzocca A, Pontisso P. New molecular targets for functionalized nanosized drug delivery systems in personalized therapy for hepatocellular carcinoma. J Control Release. 2017;268:184–197. doi: 10.1016/j.jconrel.2017.10.027. - DOI - PubMed
    1. Fu Y, Liu S, Zeng S, Shen H. From bench to bed: the tumor immune microenvironment and current immunotherapeutic strategies for hepatocellular carcinoma. J Exp Clin Cancer Res. 2019;38(1):396. doi: 10.1186/s13046-019-1396-4. - DOI - PMC - PubMed
    1. Cheng AL, Hsu C, Chan SL, Choo SP, Kudo M. Challenges of combination therapy with immune checkpoint inhibitors for hepatocellular carcinoma. J Hepatol. 2020;72(2):307–319. doi: 10.1016/j.jhep.2019.09.025. - DOI - PubMed
    1. GTEx Consortium Human genomics. The Genotype-Tissue Expression (GTEx) pilot analysis: multitissue gene regulation in humans. Science. 2015;348(6235):648–660. doi: 10.1126/science.1262110. - DOI - PMC - PubMed

MeSH terms

Substances