. 2020 Oct 23;5(10):3043-3048.
doi: 10.1021/acssensors.0c01742. Epub 2020 Oct 1.

Colorimetric Test for Fast Detection of SARS-CoV-2 in Nasal and Throat Swabs

Affiliations

Colorimetric Test for Fast Detection of SARS-CoV-2 in Nasal and Throat Swabs

Bartolomeo Della Ventura et al. ACS Sens. .

Abstract

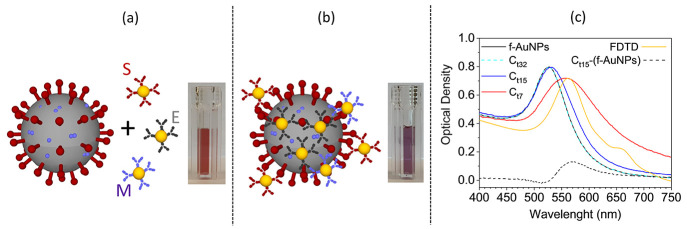
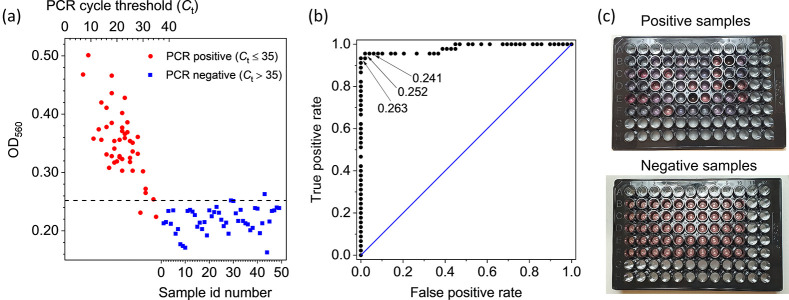
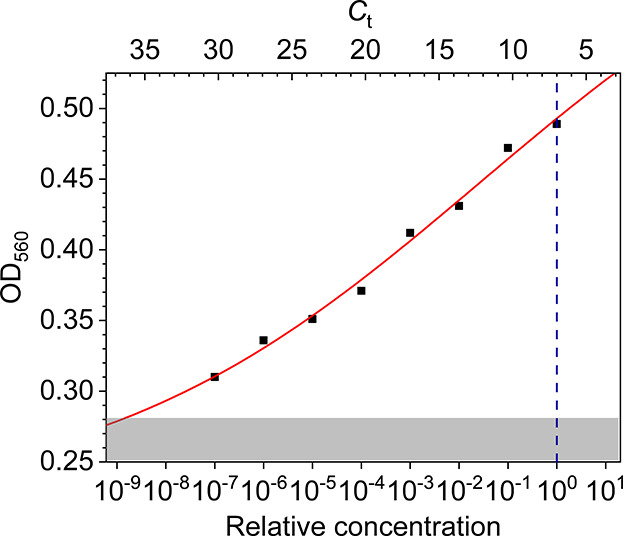
Mass testing is fundamental to face the pandemic caused by the coronavirus SARS-CoV-2 discovered at the end of 2019. To this aim, it is necessary to establish reliable, fast, and cheap tools to detect viral particles in biological material so to identify the people capable of spreading the infection. We demonstrate that a colorimetric biosensor based on gold nanoparticle (AuNP) interaction induced by SARS-CoV-2 lends itself as an outstanding tool for detecting viral particles in nasal and throat swabs. The extinction spectrum of a colloidal solution of multiple viral-target gold nanoparticles-AuNPs functionalized with antibodies targeting three surface proteins of SARS-CoV-2 (spike, envelope, and membrane)-is red-shifted in few minutes when mixed with a solution containing the viral particle. The optical density of the mixed solution measured at 560 nm was compared to the threshold cycle (Ct) of a real-time PCR (gold standard for detecting the presence of viruses) finding that the colorimetric method is able to detect very low viral load with a detection limit approaching that of the real-time PCR. Since the method is sensitive to the infecting viral particle rather than to its RNA, the achievements reported here open a new perspective not only in the context of the current and possible future pandemics, but also in microbiology, as the biosensor proves itself to be a powerful though simple tool for measuring the viral particle concentration.

Keywords: SARS-CoV-2; antibody; colorimetric biosensors; gold nanoparticles; photochemical immobilization technique; point-of-care device.


Conflict of interest statement

The authors declare no competing financial interest.

Figures

Figure 1
Figure 1
(a) Sketch of the SARS-CoV-2 and functionalized AuNPs. SARS-CoV-2 proteins (spike, membrane, and envelope) and their corresponding antibody (S, E, and M) are highlighted in dark red, light violet, and gray, respectively. The inset shows the pink colloidal solution containing the anti-SARS-CoV-2 functionalized AuNPs (f-AuNPs). (b) The f-AuNPs surround the virion forming a nanoparticle layer on its surface. Their interaction leads to a shift of the resonance peak in the extinction spectrum and, hence, to a color change visible in the inset. (c) Extinction spectra reporting the OD of f-AuNP colloidal solution mixed with samples from patients with different viral load. At very low virion concentration (curve Ct32) the extinction spectrum is not distinguishable from the spectrum of f-AuNPs (black continuous line). At intermediate virion concentration (curve Ct15) the extinction spectrum is slightly red-shifted and its difference from the “control” (f-AuNPs) produces the curve Ct15-(f-AuNPs) that evidences the contribution entailed by the virion. At high virion concentration (curve Ct7), the extinction spectrum peaks at 560 nm as for Ct15-(f-AuNPs). The agreement between the curve C7 and the simulated spectrum (gold continuous line, scaled to the experimental one) from a dielectric sphere (100 nm diameter) surrounded by smaller AuNPs (20 nm diameter) confirms the interpretation of the extinction spectra as due to nanoparticle aggregation.
Figure 2
Figure 2
(a) Results of the colorimetric test on real thawed samples from 45 positive (red circle points) and 49 negative patients (blue square points) previously tested by real-time PCR. For all of them, the extinction coefficient was measured at 560 nm. The positive samples (Ct ≤ 35) are identified in the plot by their real-time PCR cycle threshold (top scale), whereas the negative samples (Ct > 35) are simply numbered (bottom scale). The horizontal line at 0.252 extinction coefficient would lead to a test with 96% sensitivity and 98% specificity. (b) ROC curve retrieved from the data of the panel (a). The area under the curve is 0.98. Also shown are three threshold values for the extinction coefficient that would provide the following sensitivity and specificity: 96% and 94% (0.241), 96% and 98% (0.252), and 94% and 100% (0.263), respectively. (c) Picture of the 96 multiwell plate containing 250 μL of positive (top panel) and negative (bottom panel) samples. The plate reading was carried out by a commercial multiwell reader that took less than 1 min.
Figure 3
Figure 3
Optical density of the solution measured at 560 nm as a function of SARS-CoV-2 concentration (bottom axis). The virion concentration was obtained by serial dilution starting from a threshold cycle value Ct = 7 (vertical dashed blue line). Each decrease by a decade in virion concentration (bottom axis) corresponds to an increase of the nominal Ct of approximately 3.32 (top axis). The red continuous line is the best fit of the experimental data by the Hill equation. The uncertainty in the reading is taken as the resolution of the instrument, and the error bar is within the data point. The shaded area corresponds to values smaller than OD560 = 0.28, which is 3 standard deviations from the mean value of the negative controls.

References

    1. Guglielmi G. The Explosion of New Coronavirus Tests That Could Help to End the Pandemic. Nature 2020, 583 (7817), 506–509. 10.1038/d41586-020-02140-8. - DOI - PubMed
    1. Bustin S. A.; Mueller R. Real-Time Reverse Transcription PCR (QRT-PCR) and Its Potential Use in Clinical Diagnosis. Clin. Sci. 2005, 109 (4), 365–379. 10.1042/CS20050086. - DOI - PubMed
    1. Olofsson S.; Brittain-Long R.; Andersson L. M.; Westin J.; Lindh M. PCR for Detection of Respiratory Viruses: Seasonal Variations of Virus Infections. Expert Rev. Anti-Infect. Ther. 2011, 9 (8), 615–626. 10.1586/eri.11.75. - DOI - PMC - PubMed
    1. Appak Ö.; Duman M.; Belet N.; Sayiner A. A. Viral Respiratory Infections Diagnosed by Multiplex Polymerase Chain Reaction in Pediatric Patients. J. Med. Virol. 2019, 91 (5), 731–737. 10.1002/jmv.25379. - DOI - PMC - PubMed
    1. Li Z.; Yi Y.; Luo X.; Xiong N.; Liu Y.; Li S.; Sun R.; Wang Y.; Hu B.; Chen W.; et al. Development and Clinical Application of A Rapid IgM-IgG Combined Antibody Test for SARS-CoV-2 Infection Diagnosis. J. Med. Virol. 2020, 92, 1518.10.1002/jmv.25727. - DOI - PMC - PubMed

MeSH terms