. 2020 Sep 29:9:e58108.
doi: 10.7554/eLife.58108.

Sperm-specific COX6B2 enhances oxidative phosphorylation, proliferation, and survival in human lung adenocarcinoma

Affiliations

Sperm-specific COX6B2 enhances oxidative phosphorylation, proliferation, and survival in human lung adenocarcinoma

Chun-Chun Cheng et al. Elife. .

Abstract

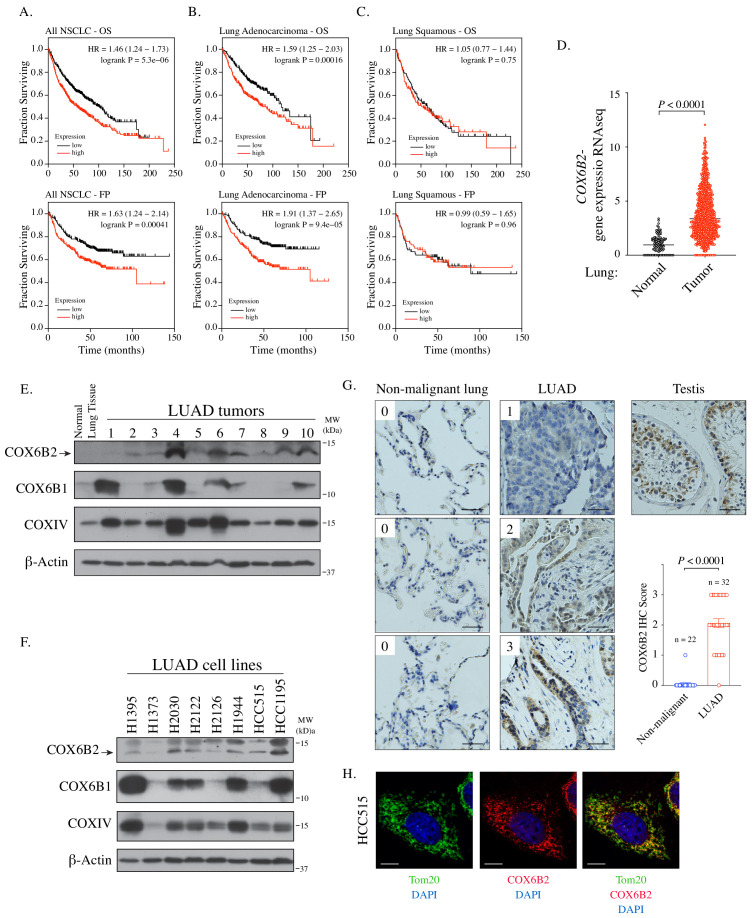
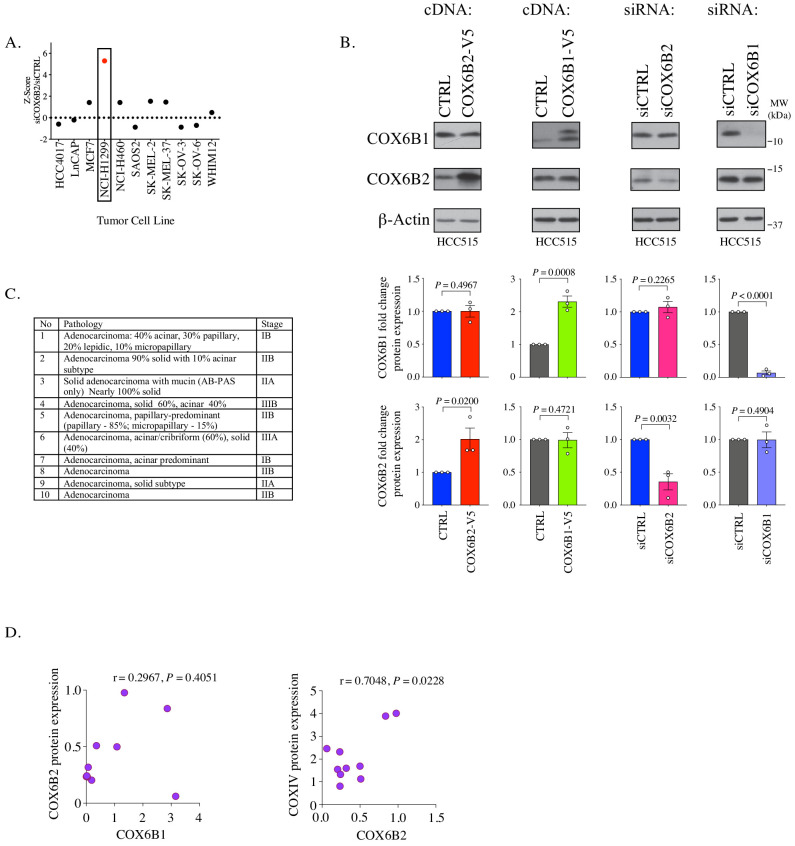
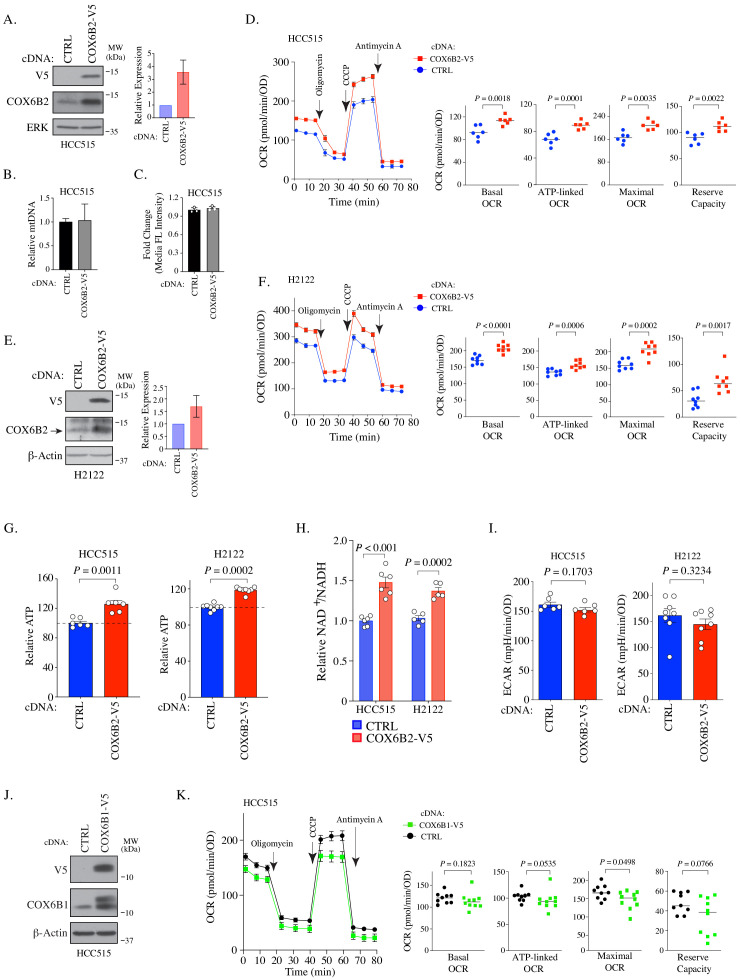
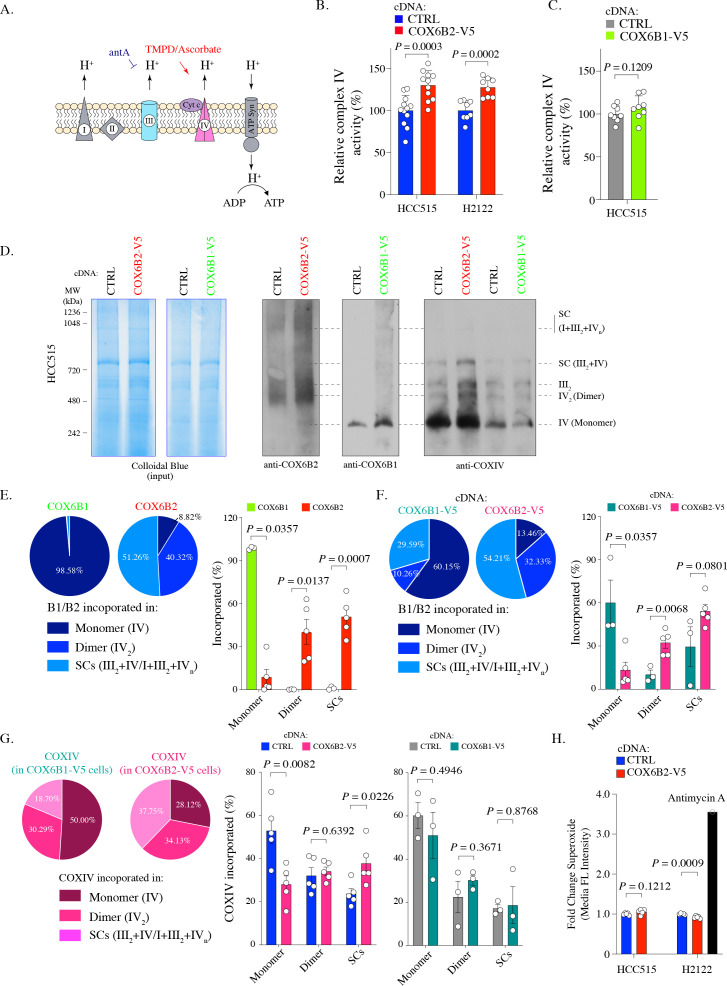
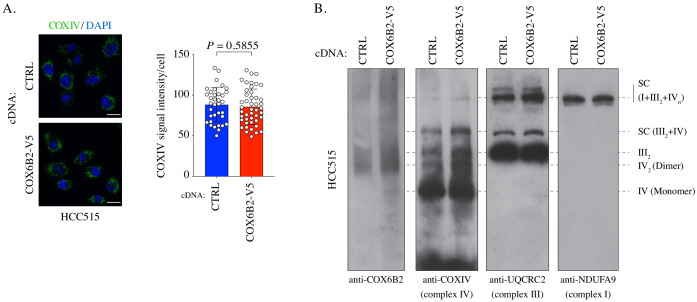
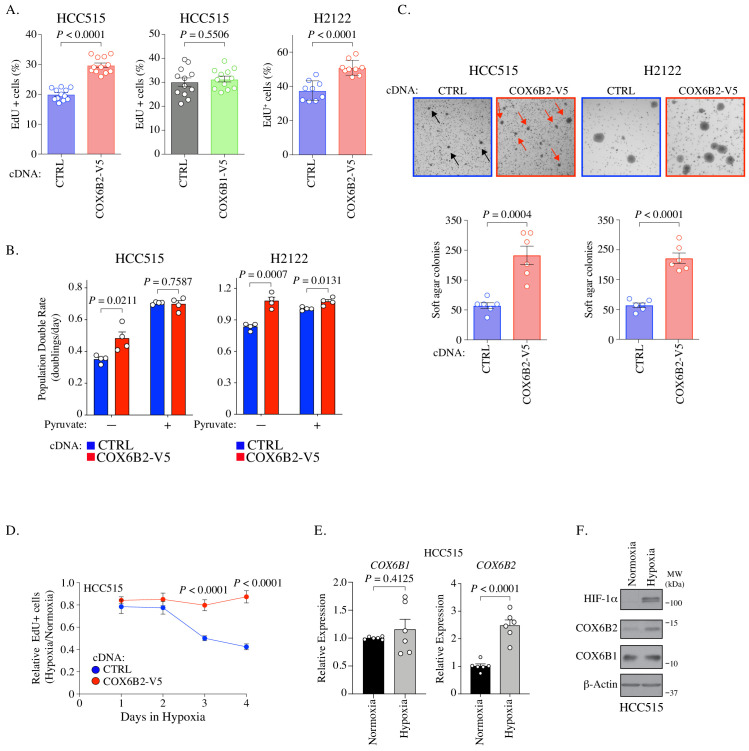
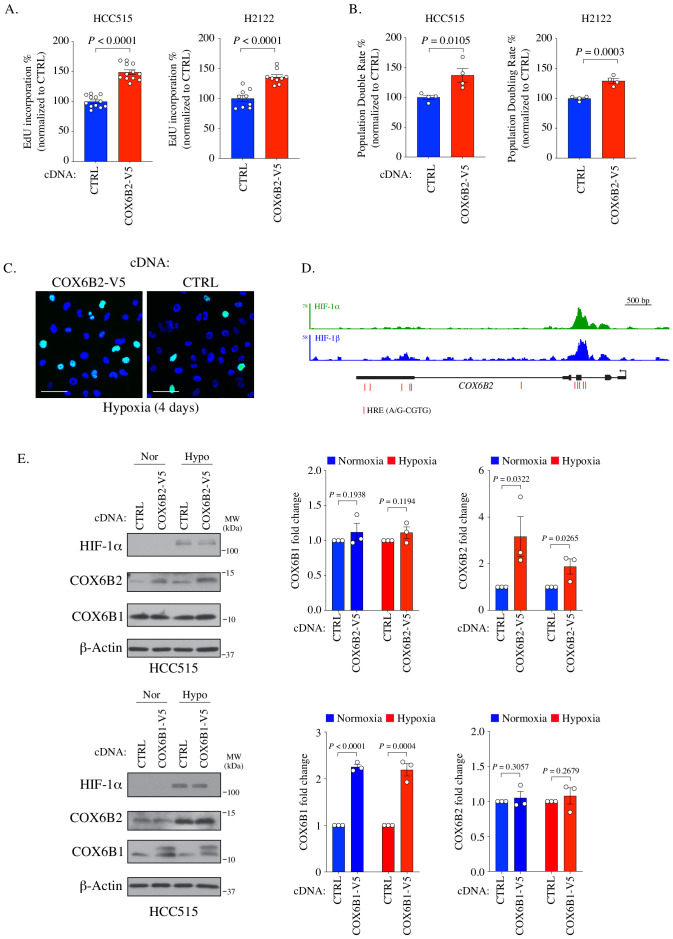
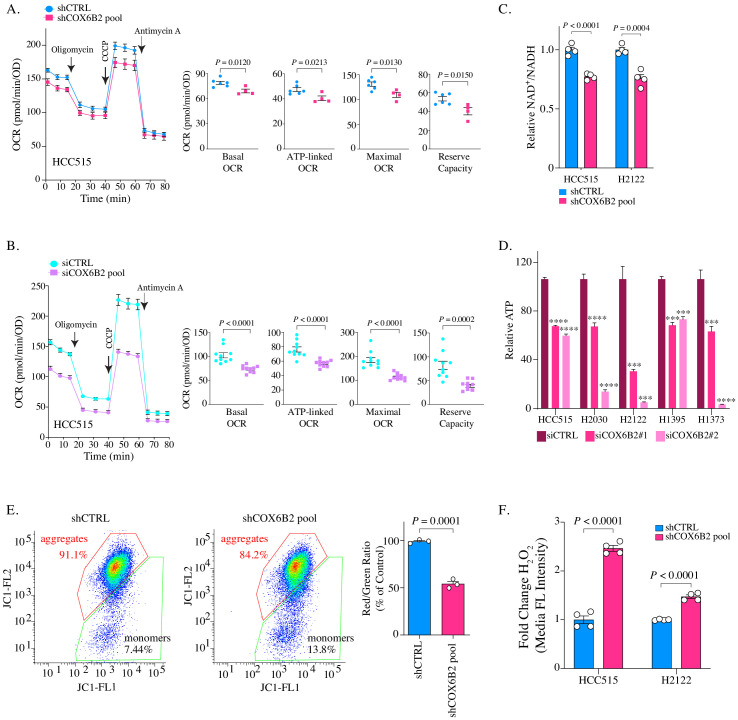
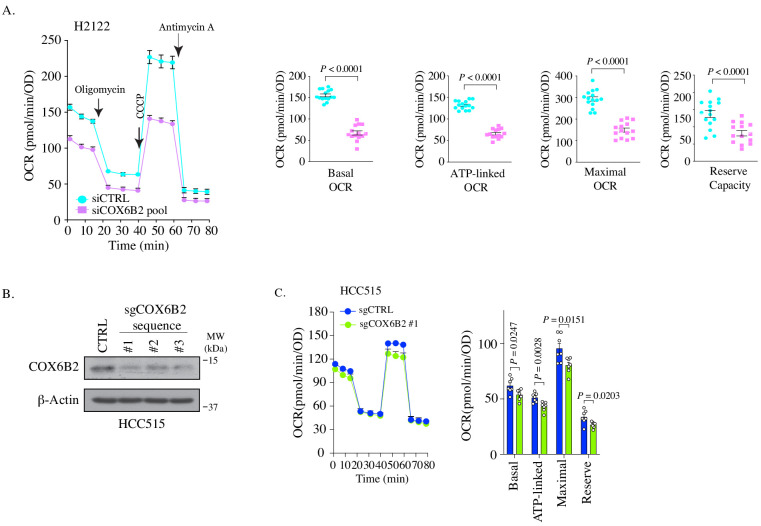
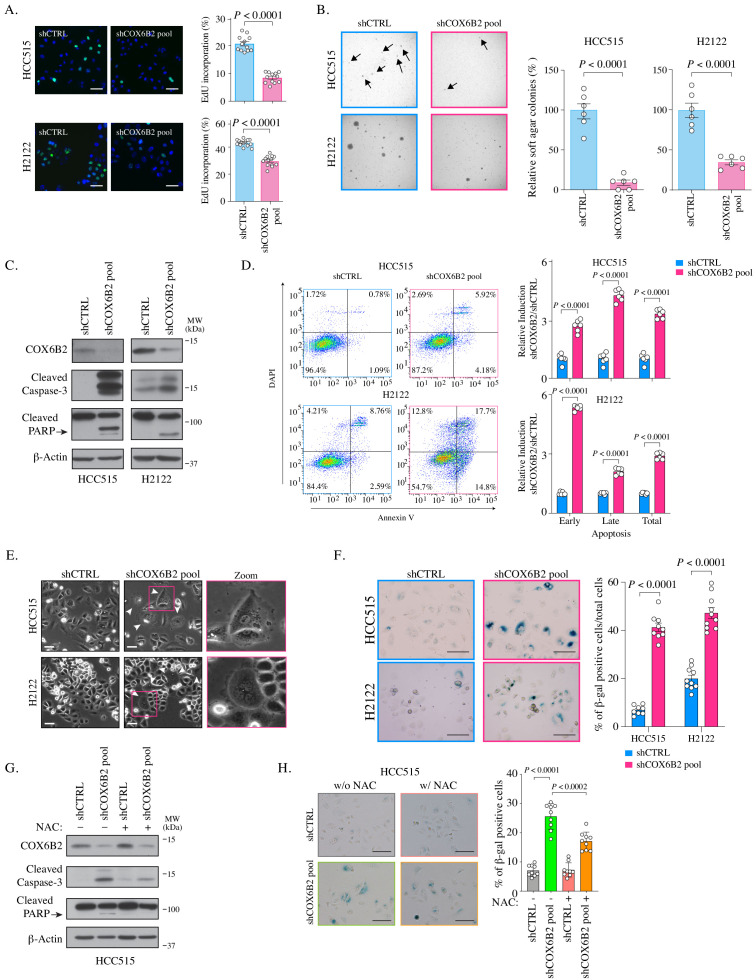
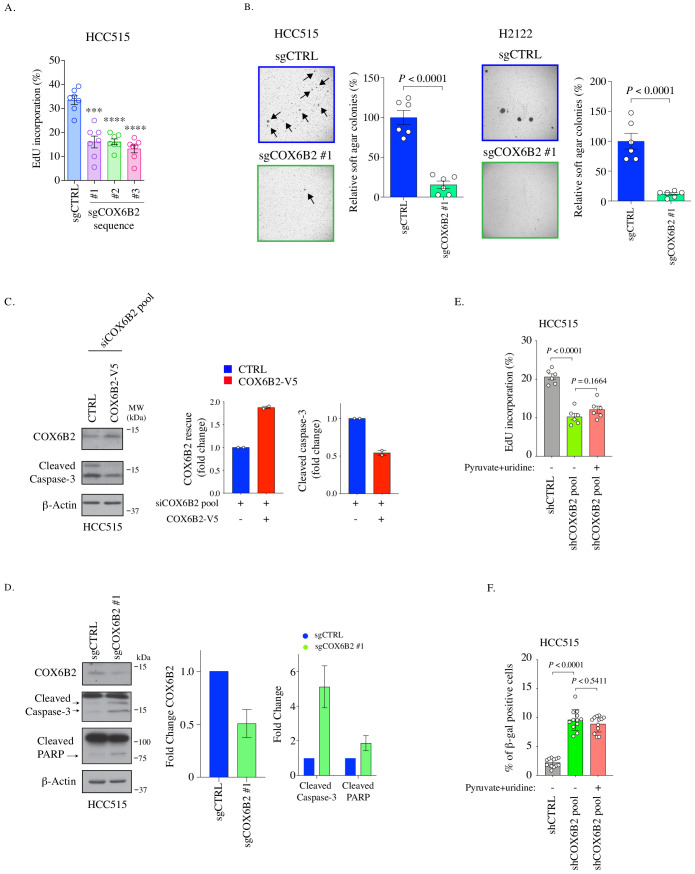
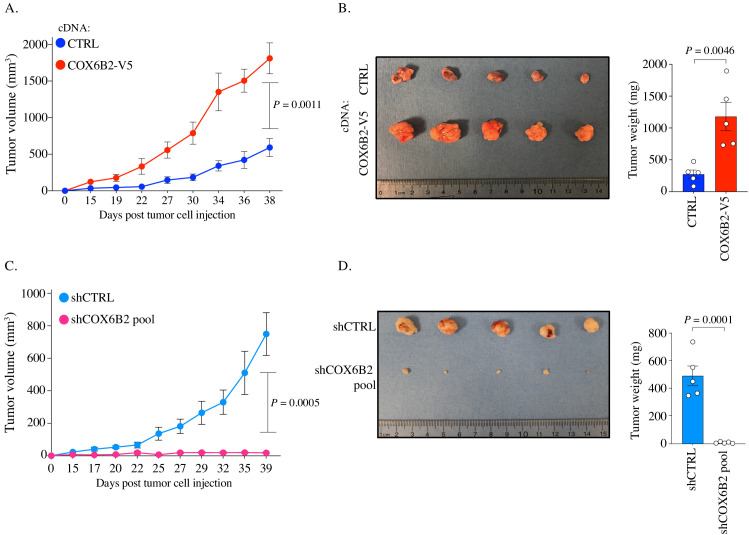
Cancer testis antigens (CTAs) are proteins whose expression is normally restricted to the testis but anomalously activated in human cancer. In sperm, a number of CTAs support energy generation, however, whether they contribute to tumor metabolism is not understood. We describe human COX6B2, a component of cytochrome c oxidase (complex IV). COX6B2 is expressed in human lung adenocarcinoma (LUAD) and expression correlates with reduced survival time. COX6B2, but not its somatic isoform COX6B1, enhances activity of complex IV, increasing oxidative phosphorylation (OXPHOS) and NAD+ generation. Consequently, COX6B2-expressing cancer cells display a proliferative advantage, particularly in low oxygen. Conversely, depletion of COX6B2 attenuates OXPHOS and collapses mitochondrial membrane potential leading to cell death or senescence. COX6B2 is both necessary and sufficient for growth of human tumor xenografts in mice. Our findings reveal a previously unappreciated, tumor-specific metabolic pathway hijacked from one of the most ATP-intensive processes in the animal kingdom: sperm motility.

Keywords: COX6B2; cancer biology; cancer testes antigen; cytochrome c oxidase; human; lung cancer; oxidative phosphorylation.


Conflict of interest statement

CC, ZG, KM, PM, AW No competing interests declared, JW Joshua Wooten is affiliated with Nuventra. The author has no financial interests to declare.

Figures

Figure 1.
Figure 1.. COX6B2 mRNA expression correlates with poor outcome in LUAD.
(A–C) Kaplan-Meier curves for OS and FP in NSCLC (A) LUAD (B) and LUSC patients (C). (D) COX6B2 mRNA expression (RNA-seq RSEM, log2(norm count +1)) from TCGA Lung Cancer dataset. Bars represent median (normal: n = 110; tumor: n = 1017). P values calculated by Mann-Whitney test. (E–F) Whole tissue homogenates of LUAD tumors (E) and LUAD cell line lysates (F) were immunoblotted with indicated antibodies. Molecular weight (MW) markers are indicated. (G) IHC staining of non-malignant testis (a positive control), non-malignant lung (adjacent normal) and LUAD tissues. Scores ranged from 0 to 3. Scale bar, 50 μm. Bars represent mean ± SEM. p-Values calculated by Mann-Whitney test. (H) Representative confocal images of endogenous COX6B2 in HCC515 cells. Tom20 is used as a mitochondrial marker. Images were shown as Z-stack maximum projection from 0.3-μm-thick image. Scale bar, 10 μm.
Figure 1—figure supplement 1.
Figure 1—figure supplement 1.. COX6B2 expression in LUAD.
(A) Z-score of caspase3/7 activity screening in indicated cell lines based on data generated in Maxfield et al., 2015. (B) Top: Whole cell lysates from HCC515 depleted or COX6B2-V5 or COX6B1-V5 overexpressing cells were immunoblotted with indicated antibodies. MW markers are indicated. Bottom: Graphs COX6B1 and COX6B2 protein expression from immunoblots above. Bars represent mean ± SEM (n = 3). p-Values calculated by Student’s t-test. (C) Clinical data associated with tumors used in Figure 1E. (D) Pearson’s correlation analysis of COX6B1, COX6B2 and COXIV protein expression in LUAD tumors as measured by immunoblots in Figure 1E. Values are relative to loading control (β-Actin).
Figure 2.
Figure 2.. COX6B2 expression enhances mitochondrial respiratory activity.
(A) Left: Whole cell lysates from HCC515 cells + / - COX6B2-V5 were immunoblotted with indicated antibodies. MW markers are indicated. Right: Quantitation of COX6B2 protein expression from blots on left. Bars represent mean ± SD (n = 4). (B) Mitochondrial DNA content. Bars represent mean + range (n = 2). (C) Quantification of total mitochondria using FACS analysis of Mitotracker green stained cells. Bars represent mean ± SD (n = 3). (D) Left: Oxygen consumption rate (OCR) as a function of time in indicated cell lines following exposure to electron transport chain complex inhibitors. Bars represent mean ± SEM (n = 6). Right: Mean and distribution of individual values for basal, ATP-linked, maximal and reserve OCRs. p-Values calculated by Student’s t-test. (E) Left: Whole cell lysates from H2122 cells + / - COX6B2-V5 were immunoblotted with indicated antibodies. MW markers are indicated. Right: Quantitation of COX6B2 protein expression. Bars represent mean ± SD (n = 3). (F) As in (D) (n = 8). (G) ATP content of indicated cell lines. Bars represent mean + SEM (n ≥ 6). HCC515 p value calculated by Student’s t-test and H2122 p value calculated by Mann-Whitney test. (H) NAD+/NADH measurement in indicated cell lines. Bars represent mean ± SEM (n ≥ 5). p-Value calculated by Student’s t-test. (I) Basal extracellular acidification rate (ECAR) are presented as mean ± SEM (n ≥ 6) from CTRL and COX6B2-V5 cells of HCC515 and H2122 cells. p-Value calculated by Student’s t-test. (J) Immunoblots of indicated whole cell lysates with specified antibodies. MW markers are indicated. (K) As in (D) using indicated cell lines. Bars represent mean ± SEM (n ≥ 9). Basal and ATP-link OCR p value calculated by Student’s t-test. Maximal OCR and reserve capacity p value calculated by Mann-Whitney test.
Figure 3.
Figure 3.. COX6B2 enhances complex IV activity of OXPHOS without increasing ROS production.
(A) Schematic of complex IV activity measurements in isolated mitochondria. Details are described in Material and methods. antA, Antimycin A; Cyt c, Cytochrome c; ATP Syn, ATP synthase. (B) Complex IV activity in indicated cell lines using TMPD/ascorbate as a substrate. Bars represent mean + SEM (n ≥ 8). p-Value calculated by Student’s t-test. (C) As in (B) in HCC515 cell lines expressing CTRL and COX6B1-V5 cDNA. Bars represent mean + SEM (n = 8). p-Value calculated by Student’s t-test. (D) Indicated lysates from HCC515 cells were run on a BN-PAGE gel and stained with Colloidal Blue (left two panels) or immunoblotted with anti-COX6B2, anti-COX6B1 and anti-COXIV (right panels). Representative image of n ≥ 3. MW markers are indicated to identify different complexes (Mourier et al., 2014). (E) Left: Distribution of COX6B1 and COX6B2 incorporated in complex IV monomers, dimers or supercomplexes as detected by BN-PAGE in (D). Right: Bars represent mean ± SEM (n ≥ 3) based on quantification of bands in (D). In monomeric complex IV, p value calculated by Mann-Whitney test whereas others calculated by Student’s t-test. (F) Left: Distribution of COX6B1/COX6B2 incorporated in monomeric complex IV, dimeric complex IV and supercomplexes based on BN-PAGE in COX6B2-V5 or COX6B1-V5 overexpressing cell lines (D). Right: Bars represent mean ± SEM (n ≥ 3) based on quantification of bands in (D). In monomeric complex IV, p value calculated by Mann-Whitney test whereas others calculated by Student’s t-test. (G) Left: Distribution of COXIV incorporated in monomeric complex IV, dimeric complex IV and supercomplexes by blots from (D). Right: Bars represent mean ± SEM (n ≥ 3) of COXIV based on quantification of band in (D). p-Value calculated by Student’s t-test. (H) Relative superoxide in indicated cell lines. Bars represent mean + SEM (n = 5). p-Value calculated by Student’s t-test.
Figure 3—figure supplement 1.
Figure 3—figure supplement 1.. Measurement of complexes and supercomplexes.
(A) Left: Representative immunofluorescence images of COXIV in HCC515 cells + / - COX6B2-V5. Scale bar, 20 μm. Right: Quantification of staining intensity in indicated cell lines. Bars represent mean ± SEM (n ≥ 35). p-Value calculated by Student’s t-test. (B) BN-PAGE gel immunoblotted with anti-COX6B2, anti-COXIV (indicating complex IV), anti-UQCRC2 (indicating complex III), and anti-NDUFA9 (indicating complex I) in HCC515 cells + / - COX6B2-V5. Representative image of n ≥ 3.
Figure 4.
Figure 4.. COX6B2 promotes cell division.
(A) Percentage of cells positive for EdU incorporation in indicated samples. Values represent the mean ± SEM (n ≥ 9). p-Value calculated by Student’s t-test. (B) Population doubling rate in indicated samples incubated ±1 mM pyruvate for 5 days. Bars represent mean + SEM (n = 4). p-Value calculated by Student’s t-test. (C) Top: Representative images of soft agar assays for indicated cell lines. Arrows indicate formed colonies. Bottom: Graphs represent mean colony numbers in indicated cell lines. Bars represent mean ± SEM (n = 6). p-Value calculated by Student’s t-test. (D) EdU-positive HCC515 cells at indicated times in hypoxia. Values are relative to cells incubated in normoxia. Bars represent mean ± SEM (n = 8). p-Value calculated by Student’s t-test. (E) Average mRNA expression of COX6B1 and COX6B2 measured following 12 hr of hypoxia culture in HCC515 cells. Bars represent mean ± SEM (n = 6). P calculated by Student’s t-test. (F) Whole cell lysates from indicated cell lines were immunoblotted with indicated antibodies. Hypoxia exposure was for 12 hr. Representative immunoblots from n = 3. MW markers are indicated.
Figure 4—figure supplement 1.
Figure 4—figure supplement 1.. COX6B2 promotes cell division.
(A) Relative EdU incorporation (%) in indicated samples. Values represent the mean ± SEM (n ≥ 9). p-Value calculated by Student’s t-test. (B) Relative population doubling rate (%) in indicated samples (no pyruvate). Bars represent means ± SEM (n = 4). p-Value calculated by Student’s t-test. (C) Representative images of EdU staining in indicated cells under hypoxia for 4 days. (EdU, green; Hoechst, blue). Scale bar, 100 μm. (D) ChIP-seq data showing HIF-1 peaks in COX6B2 in T47D cells (breast cancer). Red lines indicate HREs (Zhang et al., 2015). (E) Left: Whole cell lysates from indicated cell lines were immunoblotted with indicated antibodies. Hypoxia exposure was for 12 hr. Representative immunoblots from n = 3. MW markers are indicated. Nor, normoxia; Hypo, hypoxia. Right: Quantitation of protein expression. Bars represent mean ± SEM (n = 3). P value calculated by Student’s t-test.
Figure 5.
Figure 5.. Depletion of COX6B2 impairs mitochondrial function.
(A–B) Left: Oxygen consumption rate (OCR) as a function of time in COX6B2 depleted HCC515 cells using an shRNA pool (A) or an siRNA pool (B) following exposure to electron transport chain complex inhibitors. Bars represent mean ± SEM (n ≥ 4). Right: Bars represent mean ± SEM 20 min following the addition of each drug (on left). p-Values calculated by Student’s t-test. (C) Relative NAD+/NADH measurement in indicated cell lines. Bars represent mean + SEM (n = 4). p-Value calculated by Student’s t-test. (D) Relative ATP content in indicated cell lines transfected with indicated individual siRNAs for 96 hr. Bars represent mean + SEM (n = 6), ****p<0.0001; ***p<0.005 calculated by Student’s t-test. (E) Left panels: Flow cytometry measurement following JC-1 labelling of indicated HCC515 cells. Right graph: Bars represent mean of the aggregate to monomer ratio (red/green) in indicated cell lines + SEM (n = 3). p-Value calculated by Student’s t-test. (F) Indicated cell lines were labelled with CM-H2DCFDA to measure H2O2 as described in Material and methods. Bars represent mean fold change in median fluorescent intensities ± SEM (n = 4). p-Value calculated by Student’s t-test.
Figure 5—figure supplement 1.
Figure 5—figure supplement 1.. Depletion of COX6B2 impairs OXPHOS.
(A) Left: Oxygen consumption rate (OCR) as a function of time in siCOX6B2 depleted H2122 cells following exposure to electron transport chain complex inhibitors. Bars represent mean ± SEM (n ≥ 14). Right: Bars represent mean ± SEM 20 min following the addition of each drug (on left). p-Values calculated by Student’s t-test. (B) Representative images of western blots from whole cell lysates of indicated cells. (C) OCR was measured as a function of time for each parameter in indicated cells. Bars represent mean ± SEM (n = 7). p-Value calculated by Student’s t-test.
Figure 6.
Figure 6.. COX6B2 is essential for tumor cell viability and survival.
(A) Left: Representative images of EdU staining in indicated cell lines. (EdU, green; Hoechst, blue). Scale bar, 100 μm. Right: Quantitation of EdU-positive cells. Bars represent the mean ± SEM (n ≥ 12). p-Value calculated by Student’s t-test. (B) Left: Representative images of colonies in soft agar. Arrows indicate formed colonies. Right: Bars represent relative mean colony numbers ± SEM (n = 6). p-Value calculated by Student’s t-test. (C) Representative immunoblots of whole cell lysates of indicated cells blotted with indicated antibodies. MW markers are indicated. (D) Left: Representative scatter plots of Annexin V staining in indicated cell lines. Bars represent mean fold change + SEM (n = 6). p Calculated by Student’s t-test. (E) Representative phase contrast images of indicated cell lines. Arrowheads indicate the flattened senescence morphology with vacuole accumulation and multinucleation. Scale bar, 100 μm. (F) Representative images of senescence-associated- β-galactosidase staining in indicated cells. Scale bar, 100 μm. Bars represent mean ± SEM (n ≥ 8). p Calculated by Student’s t-test. (G) Whole cell lysates from indicated cell lines were cultured with or without NAC (5 mM) for 7 days were immunoblotted with indicated antibodies. MW markers are indicated. (H) Representative images of senescence-associated- β-galactosidase staining in indicated cell lines cultured with or without NAC (5 mM) for all 11 days. Scale bar, 100 μm. Bars represent mean ± SEM (n = 9). p Calculated by Student’s t-test.
Figure 6—figure supplement 1.
Figure 6—figure supplement 1.. Phenotypes following COX6B2 depletion.
(A) The percentage of EdU-positive cells of COX6B2 depleted by three different sgRNA in HCC515 cells. Bars represent mean ± SEM (n = 7). p-Value calculated by Student’s t-test. ***p<0.001, ****p<0.0001. (B) Representative images of colonies in soft agar. Arrows indicate formed colonies. Graphs represent relative colony numbers in indicated cells. Bars represent mean ± SEM (n = 6). p-Value calculated by Student’s t-test. (C) Left: whole cell lysates from HCC515 + / - COX6B2-V5 were immunoblotted with indicated antibodies. MW markers are indicated. Right: quantitation of immunoblots on left. Bars represent mean ± range (n = 2). (D) Representative images and quantitation of western blots from whole cell lysates of indicated cells and immunoblotted with indicated antibodies. Bars represent mean ± SD (n = 3). (E) The percentage of EdU-positive cells of indicated cells cultured with or without pyruvate (1 mM) and uridine (100 μg/ml) for eight days. Bars represent mean ± SEM (n = 6). p-Value calculated by Student’s t-test. (F) Quantification of senescence-associated- β-galactosidase positive cells in indicated cells cultured with or without pyruvate (1 mM) and uridine (100 μg/ml) for 11 days. Bars represent mean ± SEM (n = 12). p Calculated by Student’s t-test.
Figure 7.
Figure 7.. COX6B2 supports tumor growth in vivo.
(A and C) Xenograft experiments in indicated cell lines. Tumor volumes were measured using calipers on indicated days. Each data point represents mean ± SEM (n = 5). p-Value calculated by Student’s t-test. (B and D) Left: Images of individual tumors (ruler indicates cm). Right: Mass of excised tumors from indicated cell lines. Bars represent mean ± SEM (n = 5). p-Value calculated by Student’s t-test.

References

    1. Abdulhag UN, Soiferman D, Schueler-Furman O, Miller C, Shaag A, Elpeleg O, Edvardson S, Saada A. Mitochondrial complex IV deficiency, caused by mutated COX6B1, is associated with encephalomyopathy, hydrocephalus and cardiomyopathy. European Journal of Human Genetics. 2015;23:159–164. doi: 10.1038/ejhg.2014.85. - DOI - PMC - PubMed
    1. Acín-Pérez R, Fernández-Silva P, Peleato ML, Pérez-Martos A, Enriquez JA. Respiratory active mitochondrial supercomplexes. Molecular Cell. 2008;32:529–539. doi: 10.1016/j.molcel.2008.10.021. - DOI - PubMed
    1. Agarwal A, Virk G, Ong C, du Plessis SS. Effect of Oxidative Stress on Male Reproduction. The World Journal of Men's Health. 2014;32:1–17. doi: 10.5534/wjmh.2014.32.1.1. - DOI - PMC - PubMed
    1. Balsa E, Soustek MS, Thomas A, Cogliati S, García-Poyatos C, Martín-García E, Jedrychowski M, Gygi SP, Enriquez JA, Puigserver P. ER and nutrient stress promote assembly of respiratory chain supercomplexes through the PERK-eIF2α Axis. Molecular Cell. 2019;74:877–890. doi: 10.1016/j.molcel.2019.03.031. - DOI - PMC - PubMed
    1. Birsoy K, Wang T, Chen WW, Freinkman E, Abu-Remaileh M, Sabatini DM. An essential role of the mitochondrial electron transport chain in cell proliferation is to enable aspartate synthesis. Cell. 2015;162:540–551. doi: 10.1016/j.cell.2015.07.016. - DOI - PMC - PubMed

Publication types

Substances