. 2021 Jan 4;131(1):e136824.
doi: 10.1172/JCI136824.

Brain immune cells undergo cGAS/STING-dependent apoptosis during herpes simplex virus type 1 infection to limit type I IFN production

Affiliations

Brain immune cells undergo cGAS/STING-dependent apoptosis during herpes simplex virus type 1 infection to limit type I IFN production

Line S Reinert et al. J Clin Invest. .

Abstract

Protection of the brain from viral infections involves the type I IFN (IFN-I) system, defects in which render humans susceptible to herpes simplex encephalitis (HSE). However, excessive cerebral IFN-I levels lead to pathologies, suggesting the need for tight regulation of responses. Based on data from mouse models, human HSE cases, and primary cell culture systems, we showed that microglia and other immune cells undergo apoptosis in the HSV-1-infected brain through a mechanism dependent on the cyclic GMP-AMP synthase/stimulator of interferon genes (cGAS/STING) pathway, but independent of IFN-I. HSV-1 infection of microglia induced cGAS-dependent apoptosis at high viral doses, whereas lower viral doses led to IFN-I responses. Importantly, inhibition of caspase activity prevented microglial cell death and augmented IFN-I responses. Accordingly, HSV-1-infected organotypic brain slices or mice treated with a caspase inhibitor exhibited lower viral load and an improved infection outcome. Collectively, we identify an activation-induced apoptosis program in brain immune cells that downmodulates local immune responses.

Keywords: Apoptosis pathways; Immunology; Infectious disease; Innate immunity; Neurological disorders.


Conflict of interest statement

Conflict of interest: The authors have declared that no conflict of interest exists.

Figures

Figure 1
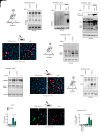
Figure 1. HSV-1 induces cGAS-dependent cell death in the brain microenvironment.
Brainstems were isolated at 5 days after HSV-1 infection via the corneal route (2 × 10⁶ PFU/cornea). (A) IFN/ISG profiles from samples isolated by laser-capture microdissection (LCM). Relative transcript levels of the indicated genes in areas of the brainstem from mock- or HSV-1–infected C57Bl/6 mice. The red box indicates degree of infection in the infected brainstem areas subjected to LCM based on IHC staining of the sequential sections. Values are normalized to β-actin and each row represents 1 LCM preparation (n = 4–8 mice per group). Blue and red color indicate low and high expression, respectively. (B) IHC images of brainstems from HSV-1–infected mice stained for TUNEL (green) and HSV-1 VP5 (red). Scale bar: 10 μm. Areas marked by squares are magnified in the images to the right of the large images. Animals per group: n = 6–7.
Figure 2
Figure 2. The cGAS-dependent cell death in the HSV-1–infected brain is primarily apoptosis.
(AC, E, F, and H) Immunoblots for the indicated PCD markers in the brainstem from HSV-1–infected mice at day 5 after infection; vinculin was used as a loading control. (A and B) Both full-length gasdermin D (GSDMD) (fl) and the cleaved (CGSDMD) (cl*) product in the brainstem were detected with a polyclonal antibody (A), while the monoclonal antibody used (B) detects predominately the CGSDMD (cl*) product. The positive control used was bone marrow–derived macrophages (BMDM) treated in vitro with LPS (1 μg/mL) for 4 hours followed by an additional treatment with nigericin for 1 hour (10 μM). (C) Immunoblotting for caspase-1 showing the full-length caspase-1 (C1-fl) and the cleaved caspase-1 (P20)*. BMDM cells were treated as in B. (D, G, and J) Organotypic brain slices from WT and cGas–/– mice were cultured and infected with 1 × 10⁴ PFU of HSV-1 for 20 hours, fixed and stained for HSV-1 (DP5) (red), GSDMD (monoclonal) antibody, P-MLKL, or cleaved caspase-3 (CC3), as indicated (all shown in green). Scale bar: 10 μm. (E and F) Immunoblots for the necroptosis markers P-MLKL and P-RIPK3 together with vinculin, total MLKL, and total RIPK3. (H and I) Immunoblotting for and quantification of CC3 bands normalized to vinculin bands presented as mean ± SEM per group (n = 8–10), P values were calculated by Wilcoxon rank-sum test. ***0.0001 < P < 0.001. (K) Levels of CC3 in all cells present in the brainstem were analyzed by flow cytometry and presented as mean ± SEM. n = 1–6 per group, P values were calculated by 1-way ANOVA with Tukey’s multiple-comparison test. ***0.0001 < P < 0.001; ****P < 0.0001. All results presented in this figure are representative for at least 3 independent experiments.
Figure 3
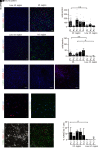
Figure 3. HSV-1–induced apoptosis in the brain is independent of IFNAR but dependent on IRF3.
(A and B) WT and cGas–/– mice were infected with HSV-1 (2 × 10⁶ PFU/cornea) and the brainstems dissected at either (A) day 4 or (B) day 5 after infection. Tissue sections were stained for HSV-1 (VP-5, red) and cleaved caspase-3 (CC3) (green). Representative images are shown in A and B and quantification of CC3pos cells and HSV-1–infected cells per section presented as mean ± SEM (C and D), n = 5–32 images per group, and 5–8 animals per group. (EG) CC3 and virus levels in the brainstem of WT and Ifnar–/– mice detected as in A, C, and D at day 4 after infection, n = 20–44 images per group, and 4–5 animals per group. (IK) CC3 and virus levels in the brainstem of WT and Irf3–/– and Irf3S1/S1 mice detected as in BD at day 5 after infection. n = 19–32 images per group, and 4–8 animals per group. (H and L) Brainstem homogenates from HSV-1–infected mice were analyzed for CC3 activity and data presented as mean ± SEM, n = 3–15 per group. P values were calculated using 2-way ANOVA with Bonferroni’s post hoc test (C and D), 1-way ANOVA with Kruskal-Wallis multiple-comparison test (H and L), and Wilcoxon rank-sum test (F and G). For D, F, and J, only sections with clear HSV-1pos cells were counted. All results presented in this figure are representative of at least 3 independent experiments; original magnification, ×20. P > 0.05 (NS); *0.01 < P < 0.05; **0.001 < P < 0.01; ***0.0001 < P < 0.001; ****P < 0.0001.
Figure 4
Figure 4. Microglia and other immune cells undergo apoptosis in vivo.
(A) Tissue sections from the brainstem of WT and cGas–/– mice infected with HSV-1 (2 × 10⁶ PFU/cornea) for (BE) 5 or (F) 4 days were stained with DAPI (blue), antibodies against cleaved caspase-3 (CC3, green) and the following cell type–specific markers (all in red): (B) NeuN (neurons), (C) GFAP (astrocyte), (D and F) Iba1 (microglia), or (E) CD45 (microglia and other immune cells). Cells are magnified in the images to the right of the large images. All results presented in this figure are representative of at least 3 independent experiments; original magnification, ×20, (n = 12–16 sections from 6–8 mice per group).
Figure 5
Figure 5. Apoptosis is a major form of PCD in the HSE brain.
(A and D) Representative virus-infected brain sections of 5 HSE cases (Pt. 1–5) were stained for HSV-1 (ICP8, red), combined with either (A and B) TUNEL or (C and D) CC3 staining (both green). Quantification of TUNELpos and/or CC3pos status per section are shown as mean ± SEM (n = 1–34 sections stained per patient). (E and F) Representative brain sections from (E) HSE cohort and (F) a noninfectious brain trauma patient were stained for GSDMD (red) and P-MLKL (green). Sections from the patient with brain trauma served as positive control for CGSDMD and P-MLKL staining. (G and H) Representative brain sections were stained for Iba1 (microglia; white), TUNEL (green), and HSV-1 (red). The percentages of TUNELpos microglia and Ibapos cells of the total microglia population in the sections analyzed were quantified and data are shown as mean ± SEM (n = 1–5 sections stained per patient). P values were calculated by using 2-way ANOVA with Bonferroni’s post hoc test (B and D) and Wilcoxon rank-sum test (H). *0.01 < P < 0.05; **0.001 < P < 0.01. Scale bars: 50 μm (A, C, G),100 μm (E), and 20 μm (F).
Figure 6
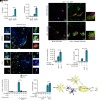
Figure 6. HSV-1 infection induces cGas/STING-dependent apoptosis in microglia.
(A and C) Analysis of apoptosis in primary murine microglia after treatment with mock or HSV-1 (15 MOI) for 6 or 8 hours by flow cytometry using annexin V antibody and PI staining. Apoptosis inducer raptinal (10 μM, 45 minutes) was used as positive control. (B) Lysates from microglia treated as in A were analyzed for caspase-3/7 activity 8 hours after infection. (DF) Microglia were infected as in A for 6 hours and the expression of HSV-1 gB, Ifnβ, and Puma was analyzed by real-time qPCR. Values were normalized to β-actin and presented as mean ± SEM. (G) iPSC-derived microglia were infected with HSV-1 (MOI 5 and 15) or treated with cGAMP and analyzed for caspase-3/7 activity 12 hours later. (H and I) WT primary murine microglia were infected with 5 or 15 MOI for 12 hours and caspase-3/7 activity or Ifn-β mRNA levels were analyzed as in B and E, respectively. (J and K) The microglia cell line BV2 was treated with either HSV-1 (15 MOI) for 8 hours or raptinal (10 μM) for 15 minutes. The cytosolic and mitochondrial fractions were isolated and samples were subjected to immunoblotting with antibody against cytochrome c, COX IV (mitochondria marker), or vinculin. Densitometry was used to quantify the cytochrome c release relative to vinculin and shown in K. (L) Cellular model of IFN versus apoptosis response in HSV-1–infected microglia. All figures represent at least 3 independent experiments, n = 4–6 per group (AI) and n = 1 (K); P values were calculated by 1-way ANOVA with Tukey’s multiple-comparison test (A and G) and 2-tailed Student’s t test (BF, H, and I). P > 0.05 (NS, not significant); *0.01 < P < 0.05; **0.001 < P < 0.01; ***0.0001 < P < 0.001; ****P < 0.0001.
Figure 7
Figure 7. Microglial uptake of virus and virus-infected cells induce apoptosis to control the IFN response.
(A and B) Primary murine microglia were infected with HSV-1 (15 MOI) for 12 hours in the presence of the caspase inhibitor zVAD (1.5 μg/mL) or vehicle. Expression of Ifnb and Cxcl10 was analyzed by real-time qPCR and normalized to β-actin. (C) Primary murine neurons and astrocytes were mixed and infected with HSV-1-GFP (10 MOI) for 24 hours. After adding microglia for an additional 24 hours, cells were fixed and stained with DAPI (blue) and antibodies against GFP (green) and Iba-1 (red). Scale bar: 10 μm. Some vesicle-like structures (white arrowheads) are magnified (right). (D) Brainstems of HSV-1–infected WT and cGas–/– mice (2 × 10⁶ PFU/cornea) were dissected at day 5 after infection and stained with antibodies against Iba-1 (microglia) (green), HSV-1 (polyclonal, red), and DAPI (blue). Original magnification, ×20. (E) Mixed neuron and astrocyte cultures were subjected to mock or HSV-1 (10 MOI) infection for 24 hours. Virus in cells was UV inactivated and added to the microglia cultures for 12 hours. Nonphagocytosed cells were washed before caspase-3/7 activity assay of microglia was measured. (F) Microglia were HSV-1–infected (15 MOI) or cultured with UV-inactivated cells as in E. After 6 hours, Ifnb expression was determined by real-time qPCR. (G and H) Caspase 3/7 activity and Ifnb mRNA levels in microglia were measured after coculture with UV-inactivated neurons and astrocytes as in E for 12 hours in the presence of vehicle or zVAD (1.5 μg/mL). (I) Model of apoptosis and IFN-I response in microglia after HSV-1 infection or phagocytosis of virus-infected cells. All figures represent at least 3 independent experiments; data are presented as mean ± SEM; n = 4–6 per group; P values were calculated by Wilcoxon rank-sum test (A and B) or 2-tailed Student’s t test (EH). ***0.0001 < P < 0.001; ****P < 0.0001.
Figure 8
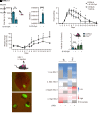
Figure 8. cGAS-dependent apoptosis limits host antiviral activity in the HSV-1–infected brain.
(A and B) Organotypic brain slices from WT mice were cultured and infected with HSV-1 (1 × 10⁴ PFU) for 5 days in the presence or absence of caspase inhibitor Q-VD-Oph (100 μM). The viral titer and Ifnb mRNA levels in brain slices were measured and presented as mean ± SEM. (C and D) Mice were HSV-1 infected (4 × 10⁷ PFU/cornea) and treated on days 5, 6, and 9 after infection with Q-VD-Oph (20 mg/kg). Head swelling and weight change were monitored. The weight was normalized to day 5, when the treatment with Q-VD-Oph was initiated. (E) Viral titers (day 5 after infection) in the brainstems of mice infected with HSV-1 (2 × 10⁶ PFU/cornea) and then treated with vehicle or Q-VD-Oph (20 mg/kg) at days 3 and 4 after infection. (AE) Data are presented as mean ± SEM and represent at least 3 independent experiments, n = 6–17 per group. P values were calculated by Wilcoxon rank-sum test (A, B, and E), 2-way repeated-measures ANOVA with Sidak’s multiple-comparison test (C and D). *0.01 < P < 0.05; **0.001 < P < 0.01; ****P < 0.0001. (F and G) WT mice were infected intracranially with HSV-1–expressing GFP (1 × 10⁷ PFU) and treated with the caspase inhibitor (zVAD) or vehicle as control (n = 4–6 mice/group) and figures represent 2 independent experiments. At 48 hours after infection, GFP-expressing brain biopsies (indicative for HSV-1 infection) were dissected. (F) Representative GFP expression in brain tissue and biopsies of HSV-1/GFP-infected mice. (G) Ifn-b and HSV-1 (gB) gene expression from the biopsies were quantified by real-time PCR. Values were normalized to β-actin and subsequently to similar biopsies from mock infected. Each row represents 1 biopsy and the biopsies are divided arbitrarily into 4 groups depending on the degree of infection defined by relative gB expression levels (2–ΔΔCT): group 1: less than 3,000; group 2: 3,000–8,900; group 3: 8,900–29,000 and group 4: more than 29,000.
Figure 9
Figure 9. cGAS drives IFN-I–induced antiviral activity but also negatively regulates immune cells through apoptosis.
Model illustrating how HSV-1 infections are sensed by microglia, either by microglia being infected or upon phagocytosis of virus-infected cells. When the local viral burden is low, microglia predominantly express IFN-I, which has antiviral activity. However, when the viral burden is relatively high, cGAS/STING signaling switches to promote apoptosis by inducing Puma mRNA expression, cytochrome c release from the mitochondria, and cleavage of caspase-3. This reduces the IFN-I response and potentially limits immunopathology.

References

    1. Tyler KL. Acute viral encephalitis. N Engl J Med. 2018;379(6):557–566. doi: 10.1056/NEJMra1708714. - DOI - PubMed
    1. Roos KL. Encephalitis. Handb Clin Neurol. 2014;121:1377–1381. doi: 10.1016/B978-0-7020-4088-7.00094-8. - DOI - PubMed
    1. Paludan SR, Bowie AG, Horan KA, Fitzgerald KA. Recognition of herpesviruses by the innate immune system. Nat Rev Immunol. 2011;11(2):143–154. doi: 10.1038/nri2937. - DOI - PMC - PubMed
    1. Ouwendijk WJ, Laing KJ, Verjans GM, Koelle DM. T-cell immunity to human alphaherpesviruses. Curr Opin Virol. 2013;3(4):452–460. doi: 10.1016/j.coviro.2013.04.004. - DOI - PMC - PubMed
    1. Whitley RJ. Herpes simplex viruses. In: Knipe DM, Howley PM eds. Fields Virology. Lippincott, Williams & Wilkins; 2001:2461–2509.

Publication types

MeSH terms