An official website of the United States government
The .gov means it’s official.
Federal government websites often end in .gov or .mil. Before
sharing sensitive information, make sure you’re on a federal
government site.
The site is secure.
The https:// ensures that you are connecting to the
official website and that any information you provide is encrypted
and transmitted securely.
Patient-derived organoid models are proving to be a powerful platform for both basic and translational studies. Here we conduct a methodical analysis of pancreatic ductal adenocarcinoma (PDAC) tumor organoid drug response in paired patient-derived xenograft (PDX) and PDX-derived organoid (PXO) models grown under WNT-free culture conditions. We report a specific relationship between area under the curve value of organoid drug dose response and in vivo tumor growth, irrespective of the drug treatment. In addition, we analyzed the glycome of PDX and PXO models and demonstrate that PXOs recapitulate the in vivo glycan landscape. In addition, we identify a core set of 57 N-glycans detected in all 10 models that represent 50%-94% of the relative abundance of all N-glycans detected in each of the models. Last, we developed a secreted biomarker discovery pipeline using media supernatant of organoid cultures and identified potentially new extracellular vesicle (EV) protein markers. We validated our findings using plasma samples from patients with PDAC, benign gastrointestinal diseases, and chronic pancreatitis and discovered that 4 EV proteins are potential circulating biomarkers for PDAC. Thus, we demonstrate the utility of organoid cultures to not only model in vivo drug responses but also serve as a powerful platform for discovering clinically actionable serologic biomarkers.
Conflict of interest: LH and SKM have a patent application pending for the pancreas tumor organoid media used in this study (US20170267977A1). BB received research funding from NanoView Biosciences. MH has stock and ownership interests in Champions Oncology, PharmaCyte Biotech, Bioncotech, Nelum, and Agenus; his honoraria include Takeda, Agenus, InxMed, PharmaCyte Biotech, Bioncotech, Tolero, Novartis, Oncomatrix, and KAHR Medical; he has a consulting or advisory role for Takeda, Agenus, InxMed, PharmaCyte Biotech, Bioncotech, Tolero, Novartis, Oncomatrix, and KAHR Medical; his patents, royalties, and other intellectual property include Myriad Genetics.
Figures
Figure 1. Genomic and histological features of…
Figure 1. Genomic and histological features of tumor organoids and matched PDX tumors.
( A …
Figure 1. Genomic and histological features of tumor organoids and matched PDX tumors.
(A) Genomic alterations in PDX tumors deduced by exome sequencing were used to calculate mutation burden (top bar graphs), and mutations corresponding to common pathways are shown. Color scheme used: green, missense mutation; purple, frameshift; yellow, stop gained; brown, splice region mutated; dark blue, homozygous deletion; light blue, hemizygous deletion; red, amplification. (B) Major oncogenic mutations in PDX tumors and matched PXOs. Color scheme for genomic alterations is coded as outlined in A. (C) H&E images of PXO and matched PDX tumors from 3 representative tumors. Scale bars: 50 μm. (D) Expression of pancreatic ductal cell marker cytokeratin 19 in PXO and matched PDX tumors. Scale bars: 50 μm.
Figure 2. Differences in biology of organoids…
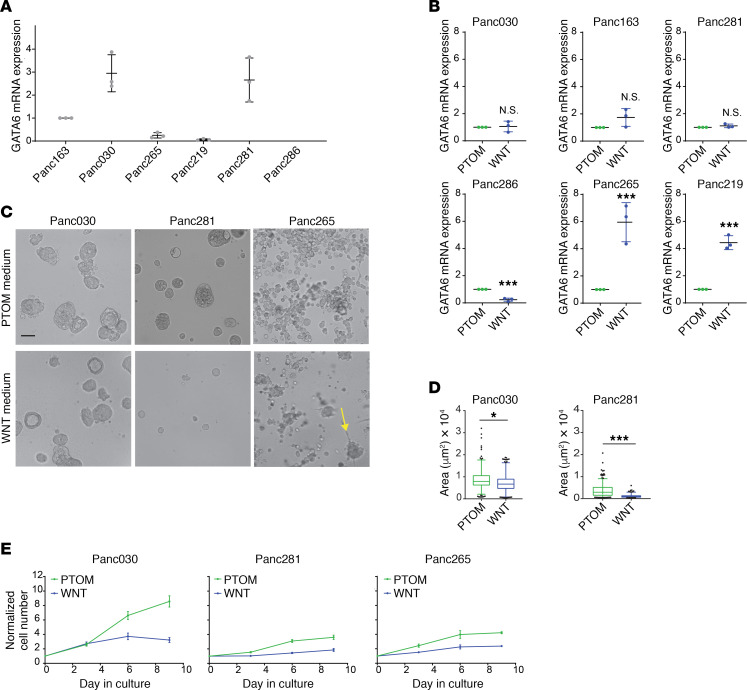
Figure 2. Differences in biology of organoids cultured in WNT-free and WNT-containing culture media.
( …
Figure 2. Differences in biology of organoids cultured in WNT-free and WNT-containing culture media.
(A) Expression of GATA6 mRNA in PXOs grown in PTOM. Scatter plots: bars represent maximal and minimal values; central lines represent mean values; dots represent results from independent experiments; N = 3. (B) Changes of GATA6 mRNA expression in PXO grown in WNT-containing culture media, N = 3. (C) Phase contrast images of PXO (day 9 in culture) grown in WNT-free (PTOM) and WNT-containing (WNT) media. Scale bars: 100 μm. (D) Areas of PXO from Panc030 and Panc281 lines. Over 100 PXOs from 3 independent cultures were used for analysis. (E) Changes in cell number of PXO grown in different culture media. N = 3. Two-tailed t test was used to calculate statistical significance. P value indicators: N.S., P ≥ 0.05; *0.01 ≤ P < 0.05; ***P < 0.001.
Figure 3. Concordance between PXO and PDX…
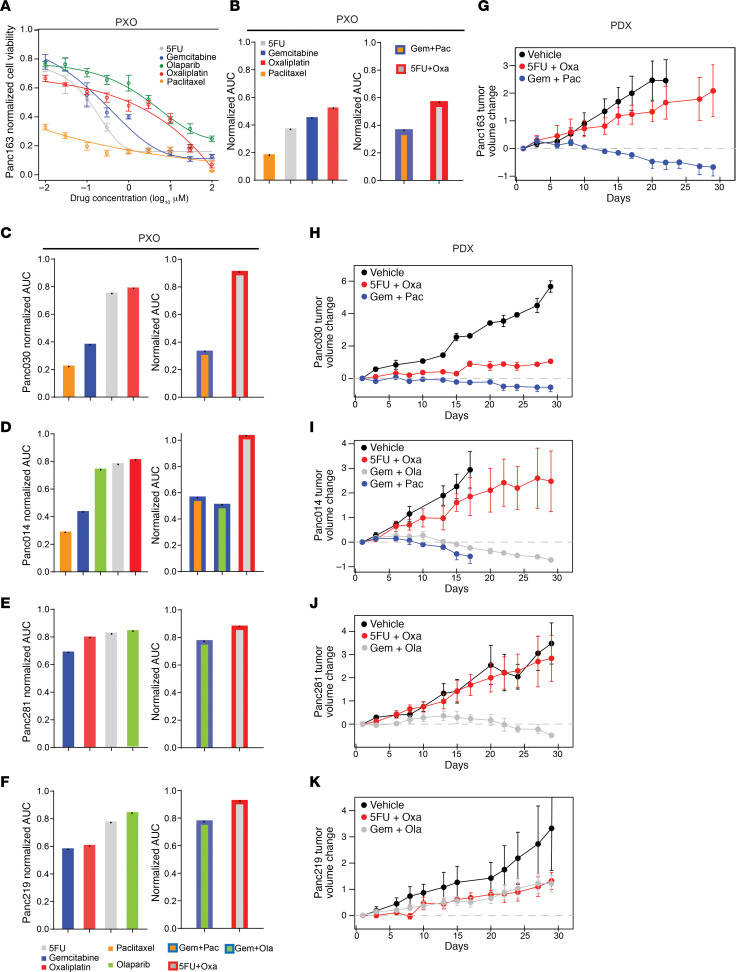
Figure 3. Concordance between PXO and PDX responses to therapeutic drugs.
( A ) Changes…
Figure 3. Concordance between PXO and PDX responses to therapeutic drugs.
(A) Changes in Panc163 PXO survival in response to single-agent treatments (N = 6). (B) Normalized AUC values for Panc163 PXO survival in response to single-agent (N = 6) or combinational treatments (N = 3). Each bar represents 1 AUC value (indicated by 1 black dot in each bar) calculated from the fitted curve per treatment. Normalized AUC values for PXO in response to single-agent (N = 6) or combinational treatments (N = 3) for (C) Panc030, (D) Panc014, (E) Panc281, and (F) Panc219. Change in tumor volume in PDX models (N ≥ 3): (G) Panc163, (H) Panc030, (I) Panc014, (J) Panc281, and (K) Panc219.
Figure 4. PXO AUC values can predict…
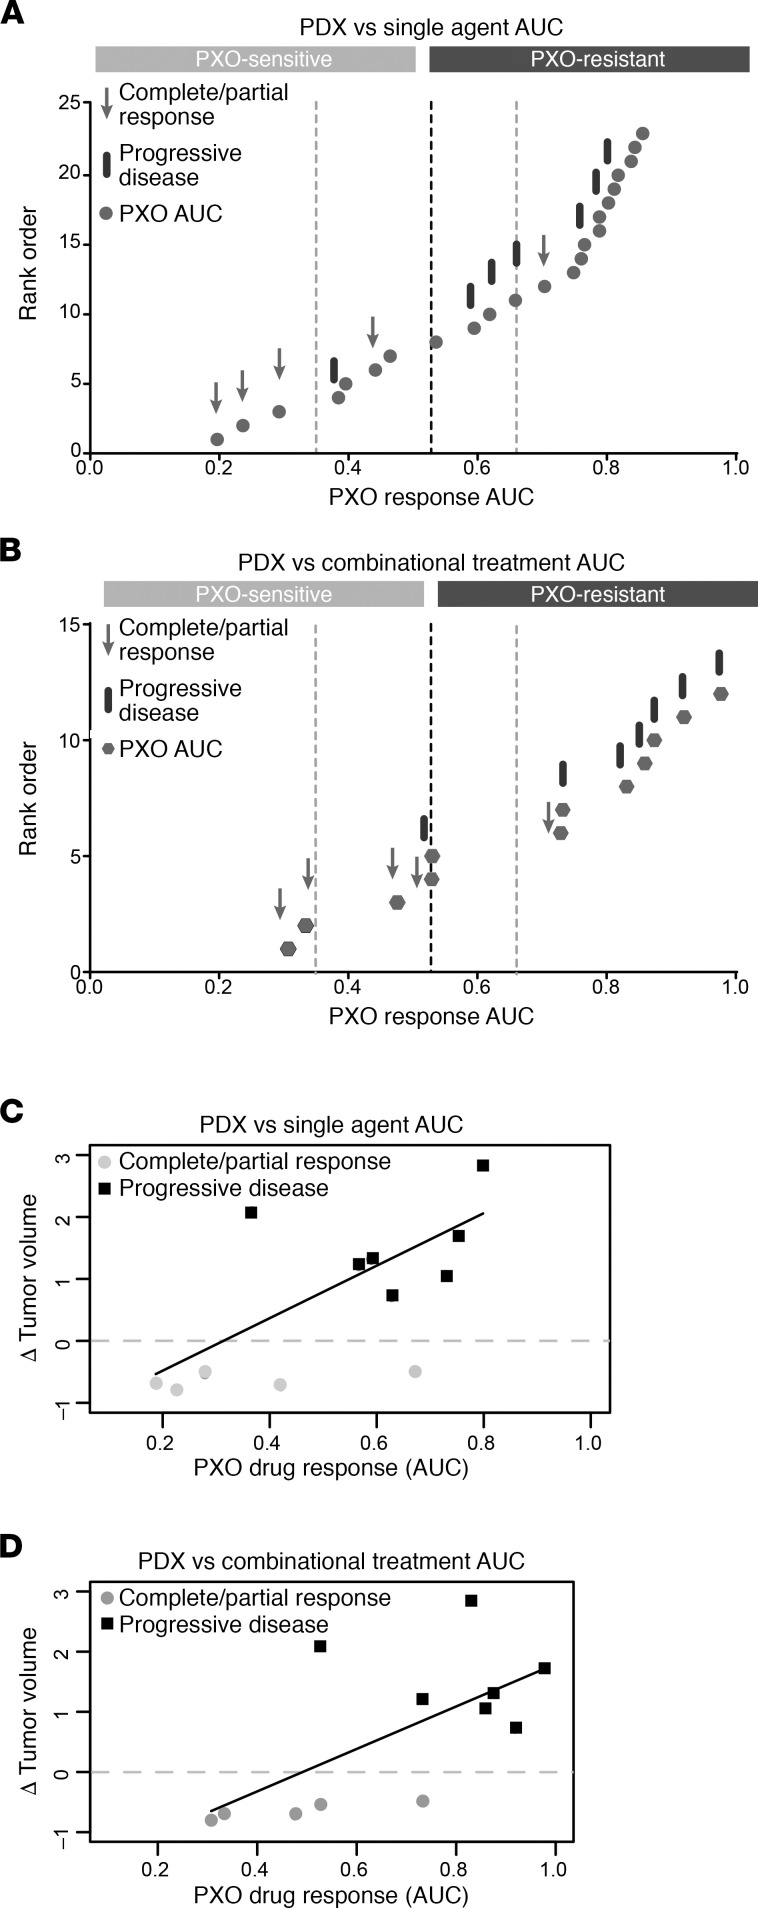
Figure 4. PXO AUC values can predict in vivo drug response.
( A ) Jenks…
Figure 4. PXO AUC values can predict in vivo drug response.
(A) Jenks Natural Break analysis of AUC values for PXO drug responses to single agents plotted as rank order versus normalized AUC; dashed lines represent thresholds for separation of groups calculated by Jenks analysis. For each drug combination tested in PDX models, the component agent with lowest AUC was compared with PDX responses: arrows refer to the PDX models with PR or CR (responder), and bars correspond to PD (nonresponder). (B) Jenks Natural Break analysis on PXO responses to combinational treatments as represented by normalized AUC values. Dashed lines represent thresholds for separation of groups calculated by Jenks analysis. Arrows refer to matched PDX models that showed response to the drug combination, and bars refer to matched PDX models that did not show response to the drug combination. (C and D) Linear regression fit to determine correlation between PXO AUCs and PDX tumor volume changes. Gray dots, PDX responders; black squares, PDX nonresponders.
Figure 5. N-glycan profiles of PXO and…
Figure 5. N-glycan profiles of PXO and matched PDX tumors.
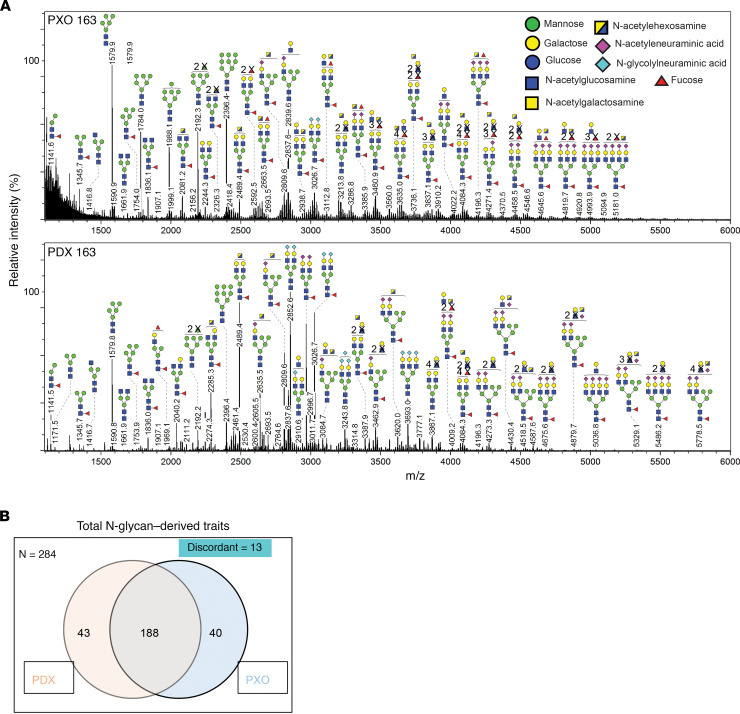
( A ) Representative mass…
Figure 5. N-glycan profiles of PXO and matched PDX tumors.
(A) Representative mass spectrometric N-glycan profile in PXO and matched PDX tumor from Panc163. Cartoons depict glycan composition for respective m/z peaks. (B) Venn diagram of N-glycans shared between all PDX and PXO models analyzed.
Figure 6. Comparison of N-glycan subtypes and…
Figure 6. Comparison of N-glycan subtypes and abundance in PXO and PDX.
( A )…
Figure 6. Comparison of N-glycan subtypes and abundance in PXO and PDX.
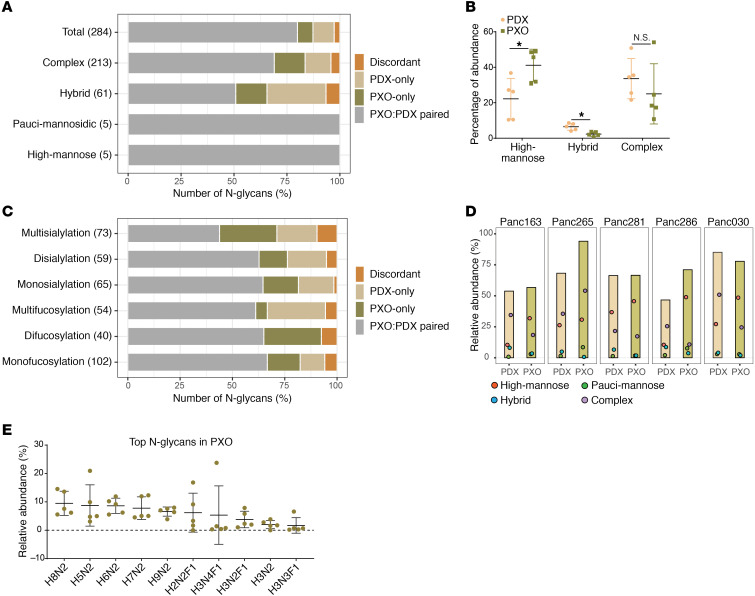
(A) Major N-glycan classes and their occurrence in all PXO and matched PDX models analyzed. The y axis identifies the different classes of glycans, the numbers represent numbers of N-glycan in each class, and the x axis shows percentage of glycans with different distribution patterns. Paired, glycans identified in both matched PDX and PXO models; discordant, glycans identified in PDX and PXO from different tumors; PDX only, glycans identified only in PDX tumors; PXO only, glycans identified only in PXO. (B) Average relative abundance of 3 major N-glycan classes in PDX and PXO models; mean values and 95% confidence interval are indicated. (C) Numbers on y axis refer to numbers of the subgroups corresponding to varying degrees of sialylation or fucosylation, and x axis shows percentage of glycans with different distribution patterns. Chart format is the same as in A. (D) Relative abundance of the 57 common N-glycans in PDX or PXO samples. Colored dots indicate abundance of glycans in each class. Red, high mannose; green, pauci-mannose; blue, hybrid; purple, complex. (E) Distribution of top N-glycans in PXO. H, hexose; F, fucose; N, N-acetylglucosamine. Mean values and 95% confidence interval range are shown.
Figure 7. Identification of EV-associated proteins enriched…
Figure 7. Identification of EV-associated proteins enriched in tumor organoid media.
( A ) PCA…
Figure 7. Identification of EV-associated proteins enriched in tumor organoid media.
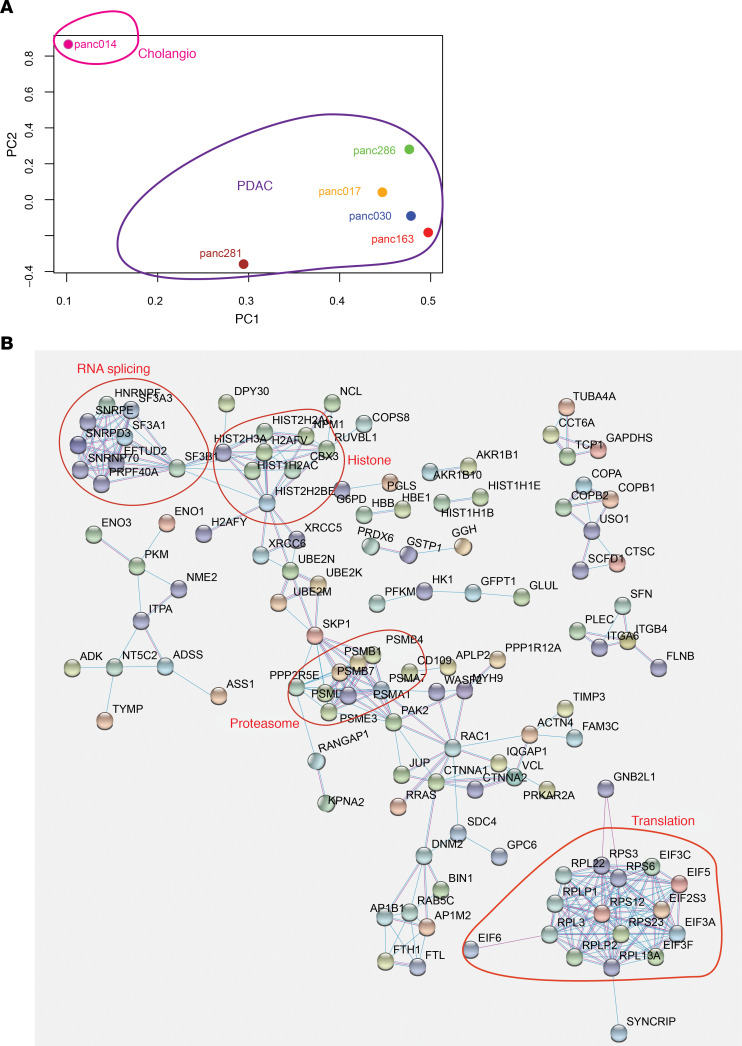
(A) PCA of EV-associated proteins identified in culture media of 6 PXO lines. (B) Functional clustering of EV proteins enriched in PXO supernatant-derived EV.
Figure 8. Validation of EV-associated proteins as…
Figure 8. Validation of EV-associated proteins as biomarker candidates in patient plasma.
( A )…
Figure 8. Validation of EV-associated proteins as biomarker candidates in patient plasma.
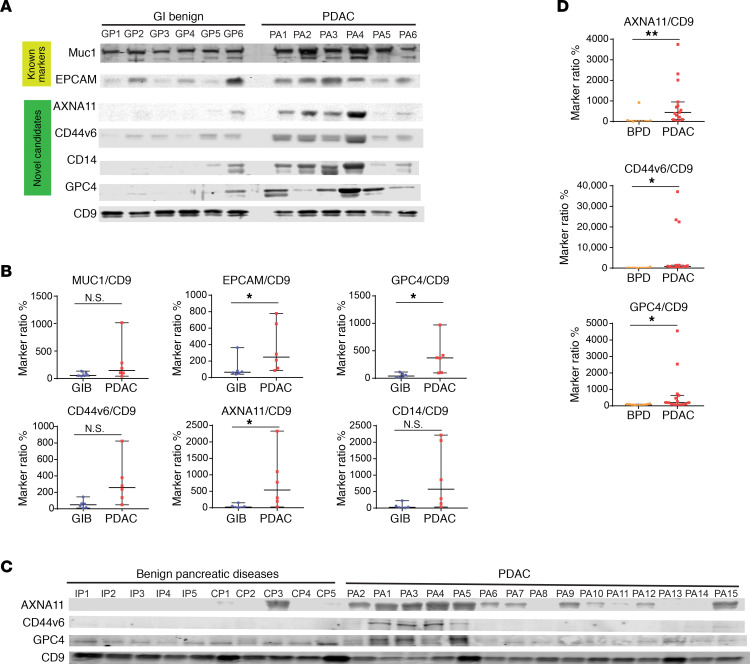
(A) Immunoblot detection of EV protein markers in 15 μL plasma from patients with benign GI diseases or PDAC (PA). (B) Quantification of protein levels detected in the immunoblot shown in panel C. GIB, benign gastrointestinal diseases. EV marker signals were normalized to CD9 signals, then rescaled to median values (set as 100) of each marker. Median values and 95% confidence interval are shown. (C) Immunoblot detection of EV markers in 5 μL plasma from patients with pancreatic diseases. IPMN, intraductal papillary mucosal neoplasms; CP, chronic pancreatitis. PA, PDAC. (D) Relative signals of EV markers in plasma from patients with pancreatic diseases detected in the immunoblots shown in panel C. BPD, benign pancreatic diseases. Median values and 95% confidence interval are shown. Kolmogorov-Smirnov test was used to calculate statistical significance. P value indicators: N.S., P ≥ 0.05; *0.01 ≤ P < 0.05; **0.001 ≤ P < 0.01.
Bleijs M, van de Wetering M, Clevers H, Drost J. Xenograft and organoid model systems in cancer research. EMBO J. 2019;38(15):e101654.
-
PMC
-
PubMed
Izumchenko E, et al. Patient-derived xenografts effectively capture responses to oncology therapy in a heterogeneous cohort of patients with solid tumors. Ann Oncol. 2017;28(10):2595–2605. doi: 10.1093/annonc/mdx416.
-
DOI
-
PMC
-
PubMed
Huang L, et al. Ductal pancreatic cancer modeling and drug screening using human pluripotent stem cell- and patient-derived tumor organoids. Nat Med. 2015;21(11):1364–1371. doi: 10.1038/nm.3973.
-
DOI
-
PMC
-
PubMed
Boj SF, et al. Organoid models of human and mouse ductal pancreatic cancer. Cell. 2015;160(1-2):324–338. doi: 10.1016/j.cell.2014.12.021.
-
DOI
-
PMC
-
PubMed
Seino T, et al. Human pancreatic tumor organoids reveal loss of stem cell niche factor dependence during disease progression. Cell Stem Cell. 2018;22(3):454–467.e6. doi: 10.1016/j.stem.2017.12.009.
-
DOI
-
PubMed