. 2020 Oct 9;48(18):10164-10183.
doi: 10.1093/nar/gkaa788.

Quantitative and time-resolved miRNA pattern of early human T cell activation

Affiliations

Quantitative and time-resolved miRNA pattern of early human T cell activation

Caroline Diener et al. Nucleic Acids Res. .

Abstract

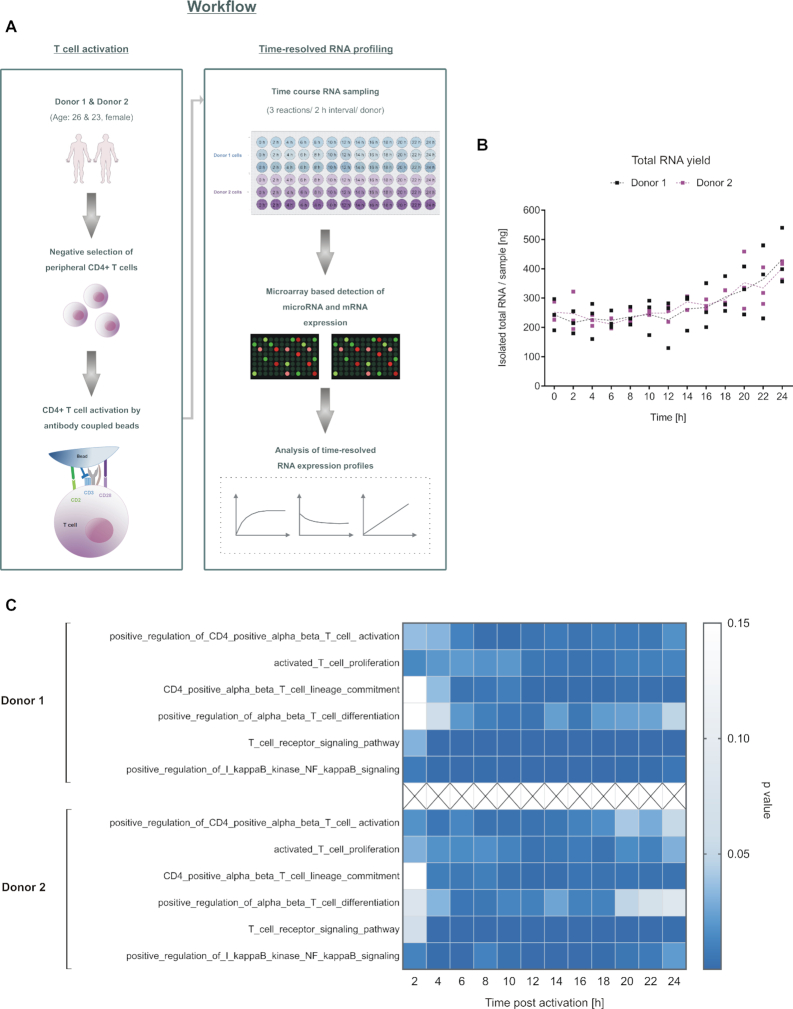
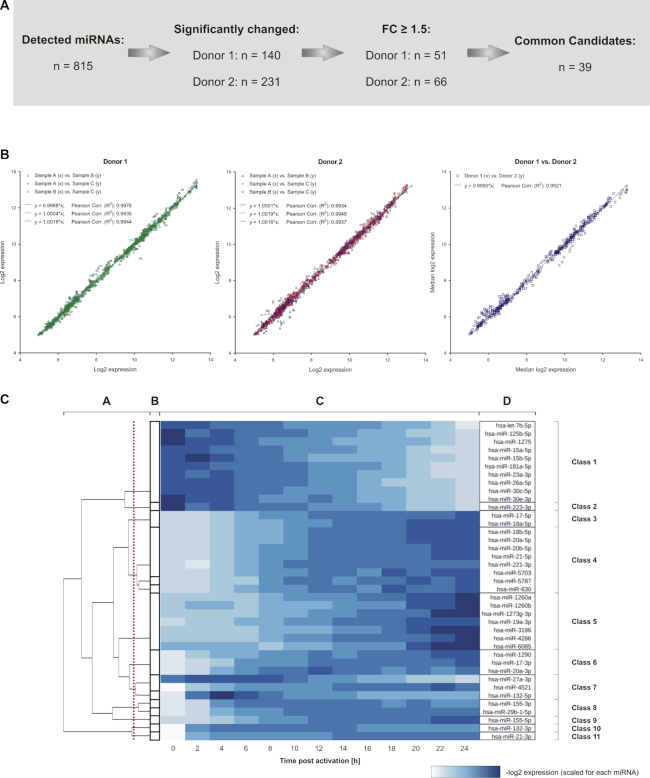
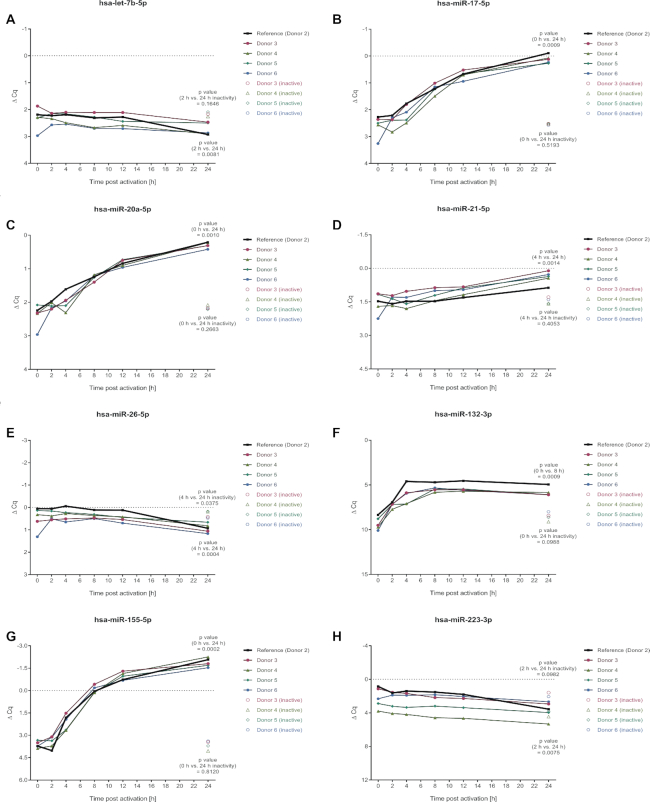
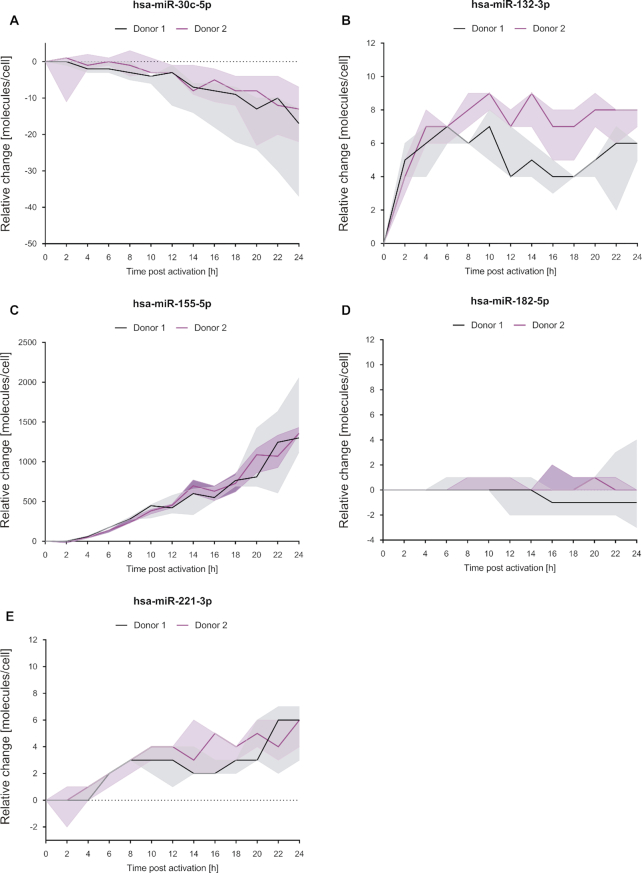
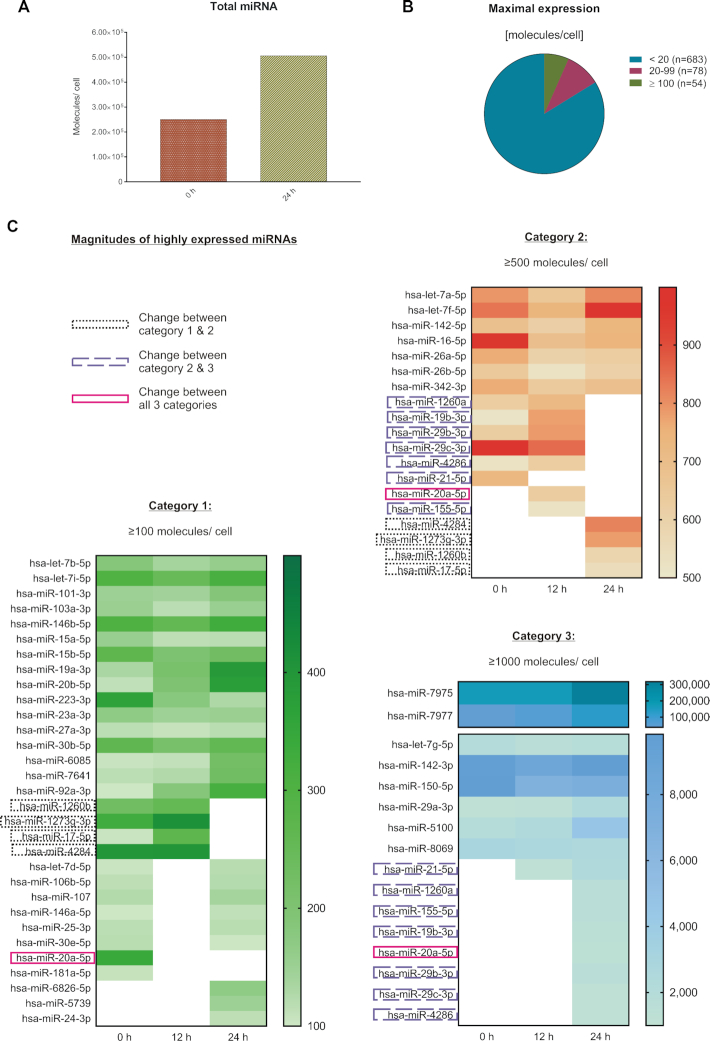
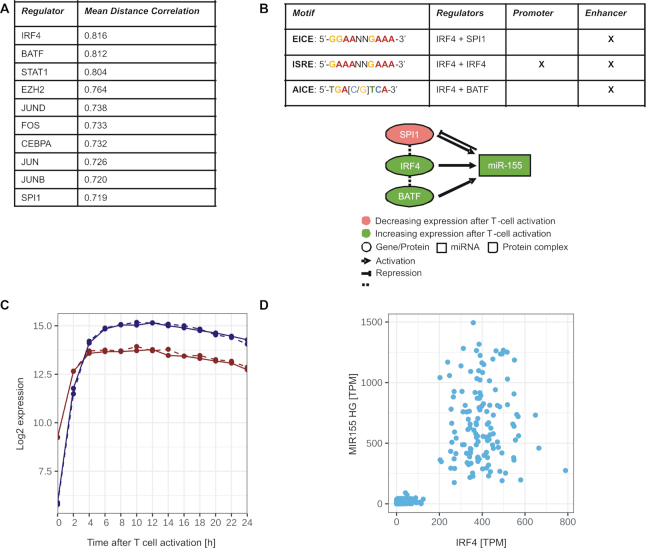
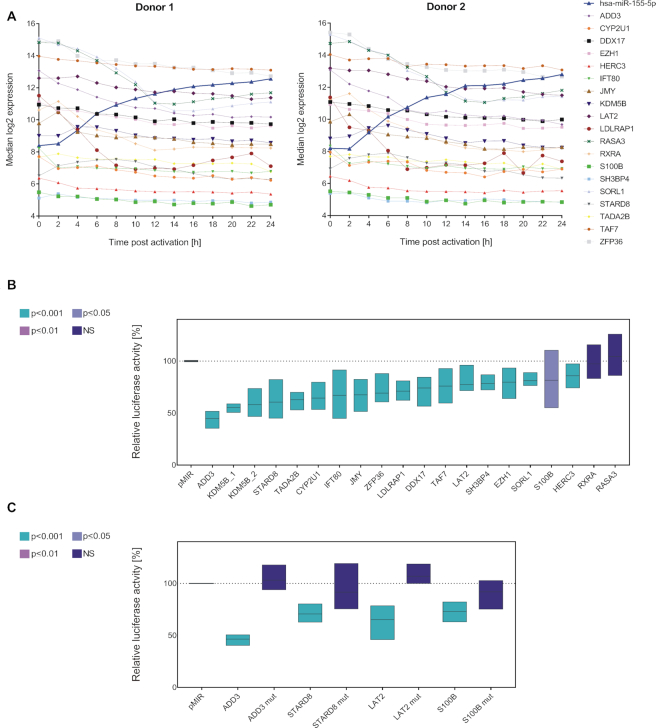
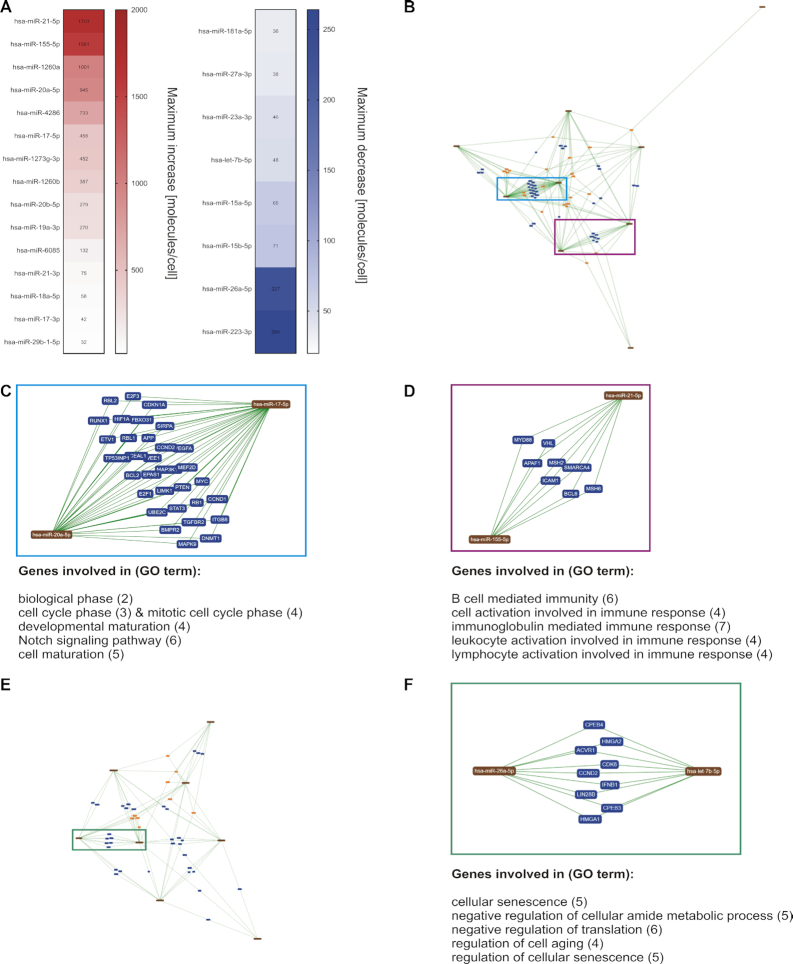
T cells are central to the immune response against various pathogens and cancer cells. Complex networks of transcriptional and post-transcriptional regulators, including microRNAs (miRNAs), coordinate the T cell activation process. Available miRNA datasets, however, do not sufficiently dissolve the dynamic changes of miRNA controlled networks upon T cell activation. Here, we established a quantitative and time-resolved expression pattern for the entire miRNome over a period of 24 h upon human T-cell activation. Based on our time-resolved datasets, we identified central miRNAs and specified common miRNA expression profiles. We found the most prominent quantitative expression changes for miR-155-5p with a range from initially 40 molecules/cell to 1600 molecules/cell upon T-cell activation. We established a comprehensive dynamic regulatory network of both the up- and downstream regulation of miR-155. Upstream, we highlight IRF4 and its complexes with SPI1 and BATF as central for the transcriptional regulation of miR-155. Downstream of miR-155-5p, we verified 17 of its target genes by the time-resolved data recorded after T cell activation. Our data provide comprehensive insights into the range of stimulus induced miRNA abundance changes and lay the ground to identify efficient points of intervention for modifying the T cell response.


Figures

Figure 1.
Figure 1.
Time-resolved RNA profiling within 24 h of CD4+ T cell activation. (A) Schematic overview on the experimental setup. Peripheral CD4+ T cells were isolated from the blood of two healthy, age and gender matched donors. The cells were in vitro activated by antibody-coupled beads. RNA samples were collected from three independently activated samples per time point and donor at intervals of 2 h and over a total time period of 24 h (n = 78 samples). Expression courses of miRNAs and mRNAs were determined by microarray-based profiling. (B) The total RNA yield of each time-course sample is shown for each time point. (C) T cell activation pathways (GO terms) were significantly upregulated, comparing the time-resolved mRNA expression data after T-cell activation to the expression values at 0 h (P-values adjusted by Benjamini−Hochberg). At each time point, three samples were analyzed for each donor.
Figure 2.
Figure 2.
Overview on the detected miRNA expression changes within early CD4+ T cell activation. (A) Overview on the number of miRNAs that were detected by time-resolved expression profiling. Significantly changed miRNAs were identified for each donor. Out of these, 39 miRNAs showed a median fold change larger 1.5 in both donors and were defined as potential candidates for the general regulation of early T cell activation signaling. (B) The identified 39 miRNA candidates showed a high correlation for a donor-wise comparison between the time-resolved miRNA expression data (log2) of the three separate T cell activation reactions per time point (denoted as A, B and C) and for the comparison between the median results of the two donors (n = 507 comparisons each). Regression equations and coefficients (R2) are indicated. (C) Grouping of the 39 miRNAs into classes of similar time-resolved expression patterns The analysis was based on the median result of all RNA samples from donor 1 and 2 (n = 6) per time point. Clusters were calculated using the ILP formulation by Grötschel and Wakabayashi in combination with a hierarchical clustering (B and A). The red line indicates the cut off, used to create the final clustering. The heatmap (C) shows scaled log2 expression values for each miRNA with the resulting classes of time-resolved expression patterns (D).
Figure 3.
Figure 3.
Validation of time-resolved miRNA expression patterns by TaqMan assays for independent donors. To confirm the validity of the time-resolved miRNA expression patterns of the microarray analyses (donors 1 and 2), the time-course experiments were reproduced with cells of four independent donors (donors 3, 4, 5 and 6). Time-course RNA samples were collected at 0, 2, 4, 8, 12 and 24 h after activation. As control, RNA samples was collected from non-activated cells after 24 h. Time-resolved miRNA expression patterns were analyzed by TaqMan assays. Donor 2 served as a reference of the microarray time-courses. A paired t-test was performed, comparing the time points of minimum and maximum expression that were determined based on the median results of the donors 3–6, assuming a normal distribution of the data.
Figure 4.
Figure 4.
Changes of miRNA molecules per cell upon activation of CD4+ T cells. MiRNA expression changes [molecules/cell] related to the 0 h time-point (non-activated cells) were exemplary determined for selected miRNAs by the application of corresponding microarray calibration curves to the time-resolved expression data. Results of the represented miRNAs are shown as median (line) of the three separate T cell activation reactions per time point and donor. The expressional ranges of the three activation reactions are shown for each time point by filled areas.
Figure 5.
Figure 5.
Quantification of absolute miRNA molecules per cell in context with CD4+ T cell activation. Absolute miRNA expression [molecules/cell] was determined for all detected miRNAs by the application of a microarray calibration curve to the time-resolved expression data. The quantitative and time-resolved miRNA patterns were evaluated based on the median result of all RNA samples from donors 1 and 2 (n = 6 per time point). (A) Total miRNA expression was determined by the sum of all detected miRNAs at 0 and 24 h after activation (n = 815). (B) The maximum expression of each miRNA was determined for the total 24 h time frame. (C) The highest expressed miRNAs were compared between the 0, 12 and 24 h time points. The increase of miR-451a was during 7–8 h after activation and is therefore not represented by the displayed time points.
Figure 6.
Figure 6.
Potential upstream regulators of miR-155 in context with T cell activation. (A) Top 10 list of potential regulators of MIR155HG gene sorted by their mean distance correlation on all investigated data sets. (B) Network of miR-155 and its potential upstream regulators IRF4, SPI1, BATF and annotation of corresponding binding motifs of their complexes within the regulatory regions of MIR155HG gene. (C) Time-resolved expression patterns (Median results of the mRNA data) of IRF4 and pre-miR-155 (MIR155HG) within 24 h of CD4+ T cell activation. (D) Scatter plot between the expression (TPM: transcripts per million) of IRF4 and MIR155HG in the GTEx data set.
Figure 7.
Figure 7.
MiR-155-5p and its target genes. (A) Overview on the time-resolved expression patterns of miR-155-5p and of its potential target genes (mRNA). Time courses (log2 expression) are donor-wise represented as median result of the three activation reactions per time point. Putative targets were selected based on an in silico prediction and an inverse correlation between their time-resolved mRNA profile and the corresponding miR-155-5p expression. (B) The interactions of miR-155-5p with its putative target genes were analyzed by dual luciferase assays. 3′UTR sequences of putative target genes were cloned into luciferase reporter plasmids (pMIR-RNL-TK) and tested in presence of miR-155 expression plasmid (pSG5-miR-155) or (empty) pSG5 control, respectively. The KDM5B 3′UTR was subdivided into two reporter constructs. Firefly and Renilla luciferase activities were measured 48 h after transfection of HEK293T cells. Results were standardized based on the transfection efficiency (determined by Renilla luciferase activity) and the basic activity of the 3′UTR-plasmid (empty pSG5 co-transfection). Results are shown in relation to the activity of an empty reporter control (pMIR without 3′UTR with miR-155 co-transfection ≡ 100%) as the average (line) with range (bars) of three independent experiments (conducted in duplicates). Statistical evaluation was performed in comparison to empty reporter control. P-values were adjusted by Benjamini–Hochberg. (C) For the exemplary validation of the luciferase assays, putative miR-155 binding sites in the 3′UTRs of four positively tested target genes were mutated and tested in comparative luciferase assays with both the wild type and corresponding mutated reporter constructs.
Figure 8.
Figure 8.
MiRNA-Target network analysis of prominently changed miRNA candidates. (A) Based on the quantitative and time-resolved miRNA patterns, 23 of the miRNA candidates showed abundance changes of more than 20 molecules/cell. (B) A miRNA-Target network was determined for those of the 23 miRNAs with increasing expression levels. (CD) Multiple shared targets were detected between miR-17–5p and miR-20a-5p and between miR-21-5p and miR-155-5p. Major functional involvements of the shared target genes are indicated. (B) A miRNA-Target network was determined for those of the 23 miRNAs with decreasing expression levels. (F) Multiple shared targets were detected between let-7b-5p and miR-26a-5p. Major functional involvements of the shared target genes are indicated. (The network images in B−F were exported from miRTargetLink (38).)

References

    1. Gaudino S.J., Kumar P.. Cross-talk between antigen presenting cells and T cells impacts intestinal homeostasis, bacterial infections, and tumorigenesis. Front. Immunol. 2019; 10:360. - PMC - PubMed
    1. Marshall J.S., Warrington R., Watson W., Kim H.L.. An introduction to immunology and immunopathology. Allergy Asthma Clin. Immunol. 2018; 14:49. - PMC - PubMed
    1. Mond J.J., Takahashi T., Thorbecke G.J.. Surface antigens of immunocompetent cells. 3. In vitro studies of the role of B and T cells in immunological memory. J. Exp. Med. 1972; 136:663–675. - PMC - PubMed
    1. Pollizzi K.N., Powell J.D.. Integrating canonical and metabolic signalling programmes in the regulation of T cell responses. Nat. Rev. Immunol. 2014; 14:435–446. - PMC - PubMed
    1. Golubovskaya V., Wu L.. Different subsets of T cells, memory, effector functions, and CAR-T immunotherapy. Cancers (Basel). 2016; 8:36. - PMC - PubMed