. 2020 Sep 29;15(9):e0239729.
doi: 10.1371/journal.pone.0239729. eCollection 2020.

Climate factors influence seasonal influenza activity in Bangkok, Thailand

Affiliations

Climate factors influence seasonal influenza activity in Bangkok, Thailand

Nungruthai Suntronwong et al. PLoS One. .

Abstract

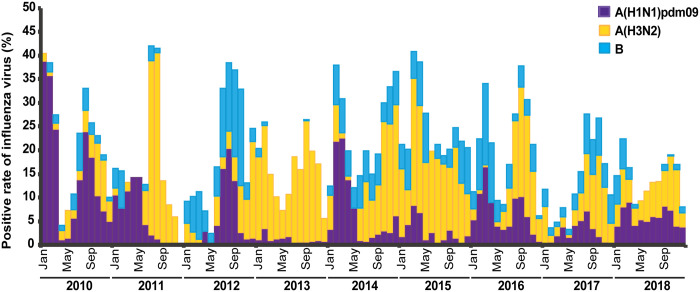
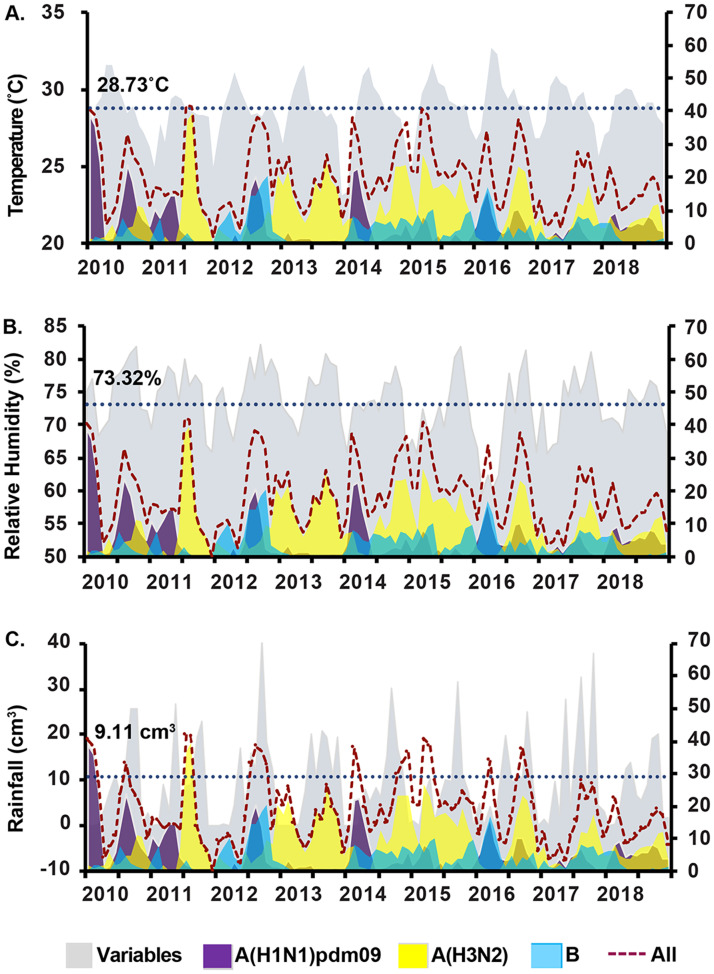
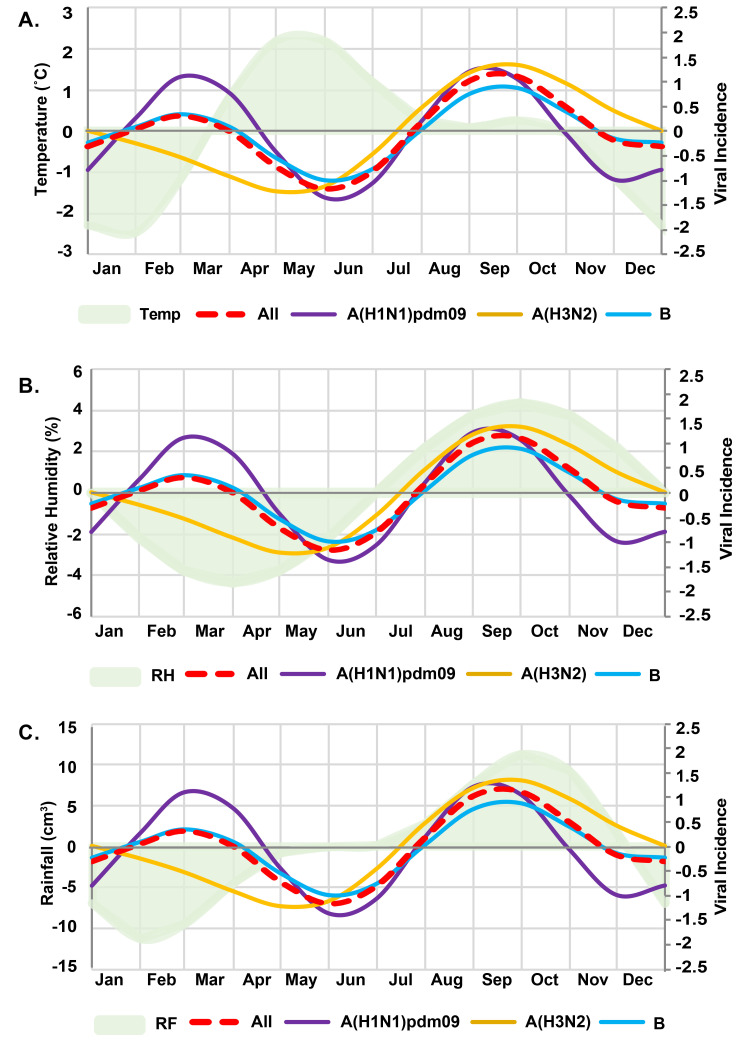
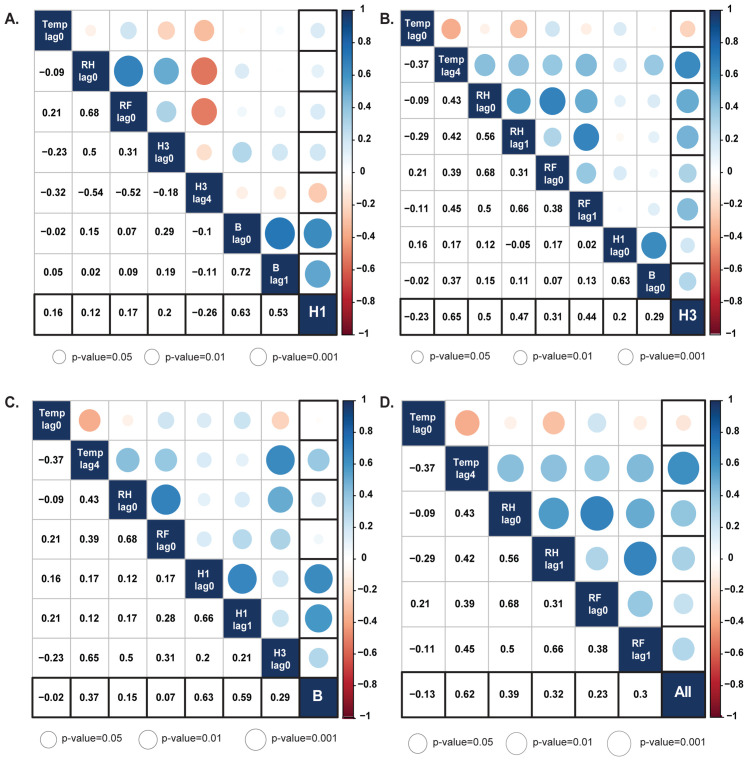
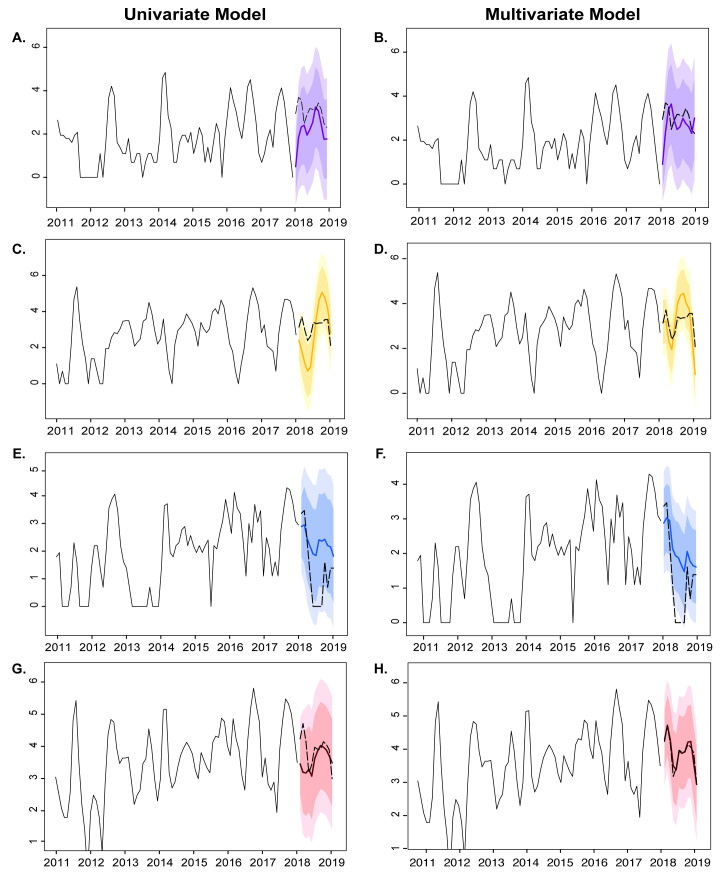
Yearly increase in influenza activity is associated with cold and dry winter in the temperate regions, while influenza patterns in tropical countries vary significantly by regional climates and geographic locations. To examine the association between influenza activity in Thailand and local climate factors including temperature, relative humidity, and rainfall, we analyzed the influenza surveillance data from January 2010 to December 2018 obtained from a large private hospital in Bangkok. We found that approximately one in five influenza-like illness samples (21.6% or 6,678/30,852) tested positive for influenza virus. Influenza virus typing showed that 34.2% were influenza A(H1N1)pdm09, 46.0% were influenza A(H3N2), and 19.8% were influenza B virus. There were two seasonal waves of increased influenza activity. Peak influenza A(H1N1)pdm09 activity occurred in February and again in August, while influenza A(H3N2) and influenza B viruses were primarily detected in August and September. Time series analysis suggests that increased relative humidity was significantly associated with increased influenza activity in Bangkok. Months with peak influenza activity generally followed the most humid months of the year. We performed the seasonal autoregressive integrated moving average (SARIMA) multivariate analysis of all influenza activity on the 2011 to 2017 data to predict the influenza activity for 2018. The resulting model closely resembled the actual observed overall influenza detected that year. Consequently, the ability to predict seasonal pattern of influenza in a large tropical city such as Bangkok may enable better public health planning and underscores the importance of annual influenza vaccination prior to the rainy season.


Conflict of interest statement

The authors have declared that no competing interests exist.

Figures

Fig 1
Fig 1. Monthly distribution of influenza activity from January 2010 to December 2018.
Bar graph represents the proportion of ILI samples tested positive for seasonal influenza A(H1N1) (purple), influenza A(H3N2) (yellow), and influenza B (blue) virus each month.
Fig 2
Fig 2. Incidence of influenza virus relative to meteorological factors.
Monthly mean temperature (A), relative humidity (B), or rainfall (C) (shaded gray) are shown with the confirmed cases of influenza A(H1N1)pdm09 virus (purple), influenza A(H3N2) virus (yellow), influenza B virus (blue), and all influenza viruses (dashed line). Scale on the right Y-axis denotes the percentage of the influenza virus-positive samples each month. Dotted horizontal line indicates the overall average temperature (28.73°C), relative humidity (73.32%), and rainfall (9.11 cm3) over nine years (left Y-axis).
Fig 3
Fig 3. Incidence of yearly influenza and the periodic fluctuation of meteorological variables.
Generalized linear models depict the incidence of influenza virus each month (colored waves) relative to the monthly mean values of climate factors (shaded). The left Y-axis represents the z-score of the (A) mean temperature (Temp), (B) relative humidity (RH), and (C) rainfall (RF). The right Y-axis represents the differences in the viral incidence for all influenza viruses (red dashed line), influenza A(H1N1)pdm09 virus (purple line), influenza A(H3N2) virus (yellow line), or influenza B virus (blue line). The highest point on the wave indicates the time of year influenza virus detection peaked.
Fig 4
Fig 4. Association between meteorological factors and influenza virus.
Correlation analysis of (A) influenza A(H1N1)pdm09 virus, (B) influenza A(H3N2) virus, (C) influenza B virus, and (D) all influenza viruses against climate variables and in the presence of co-circulating viruses at different lag times. Spearman’s rank cross-correlation coefficients ranged from -1 to 1. Negative value equates to negative association as indicated by red circles, and positive value equate to positive association as indicated by blue circles. Circle size represents the magnitude of the p-value. Color intensity represents the strength and weakness of the correlation (right scale). Temp, mean temperature; RH, relative humidity; RF, rainfall.
Fig 5
Fig 5. Seasonal ARIMA (p,d,q)(P, D, Q)12 fitted time series analysis for individual influenza (sub)type and all influenza virus activity in the different forecasting models.
Time series for influenza A(H1N1)pdm09 (A, B), influenza A(H3N2) (C, D), influenza B (E, F), and all influenza virus (G, H) activities are shown in black (January 2011 to December 2017) and dashed (January 2018 to December 2018) lines. Colored lines represent the predicted seasonality trends for 2018 using univariate (left panels) or multivariate (right panels) analysis with the 90% (darker shade) and 95% (lighter shade) confidence intervals shown.

References

    1. Troeger CE, Blacker BF, Khalil IA, Zimsen SR, Albertson SB, Abate D, et al. Mortality, morbidity, and hospitalisations due to influenza lower respiratory tract infections, 2017: an analysis for the Global Burden of Disease Study 2017. Lancet Respir Med. 2019;7(1):69–89. 10.1016/S2213-2600(18)30496-X. . - DOI - PMC - PubMed
    1. Kamigaki T, Chaw L, Tan AG, Tamaki R, Alday PP, Javier JB, et al. Seasonality of Influenza and Respiratory Syncytial Viruses and the Effect of Climate Factors in Subtropical–Tropical Asia Using Influenza-Like Illness Surveillance Data, 2010–2012. PLoS One. 2016;11(12):e0167712 10.1371/journal.pone.0167712. . - DOI - PMC - PubMed
    1. Lowen AC, Mubareka S, Steel J, Palese P. Influenza virus transmission is dependent on relative humidity and temperature. PLoS Pathog. 2007;3(10):e151 10.1371/journal.ppat.0030151. . - DOI - PMC - PubMed
    1. Lowen AC, Steel J, Mubareka S, Palese PJJov. High temperature (30°C) blocks aerosol but not contact transmission of influenza virus. J Virol. 2008;82(11):5650–2. 10.1128/JVI.00325-08. . - DOI - PMC - PubMed
    1. Lowen AC, Steel J. Roles of humidity and temperature in shaping influenza seasonality. J Virol. 2014;88(14):7692–5. 10.1128/JVI.03544-13. . - DOI - PMC - PubMed

Publication types

MeSH terms