. 2021 Jan 4;218(1):e20191365.
doi: 10.1084/jem.20191365.

Histamine H2 receptor negatively regulates oligodendrocyte differentiation in neonatal hypoxic-ischemic white matter injury

Affiliations

Histamine H2 receptor negatively regulates oligodendrocyte differentiation in neonatal hypoxic-ischemic white matter injury

Lei Jiang et al. J Exp Med. .

Abstract

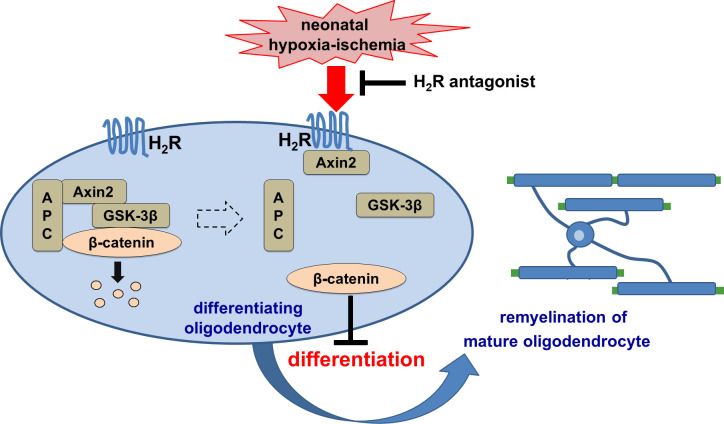
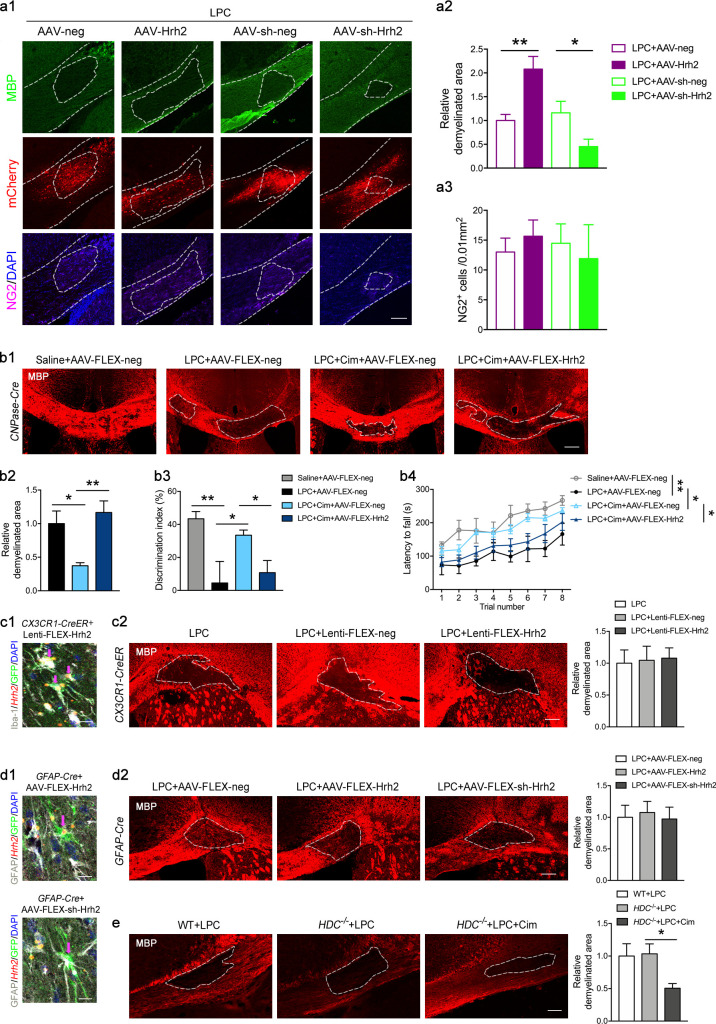
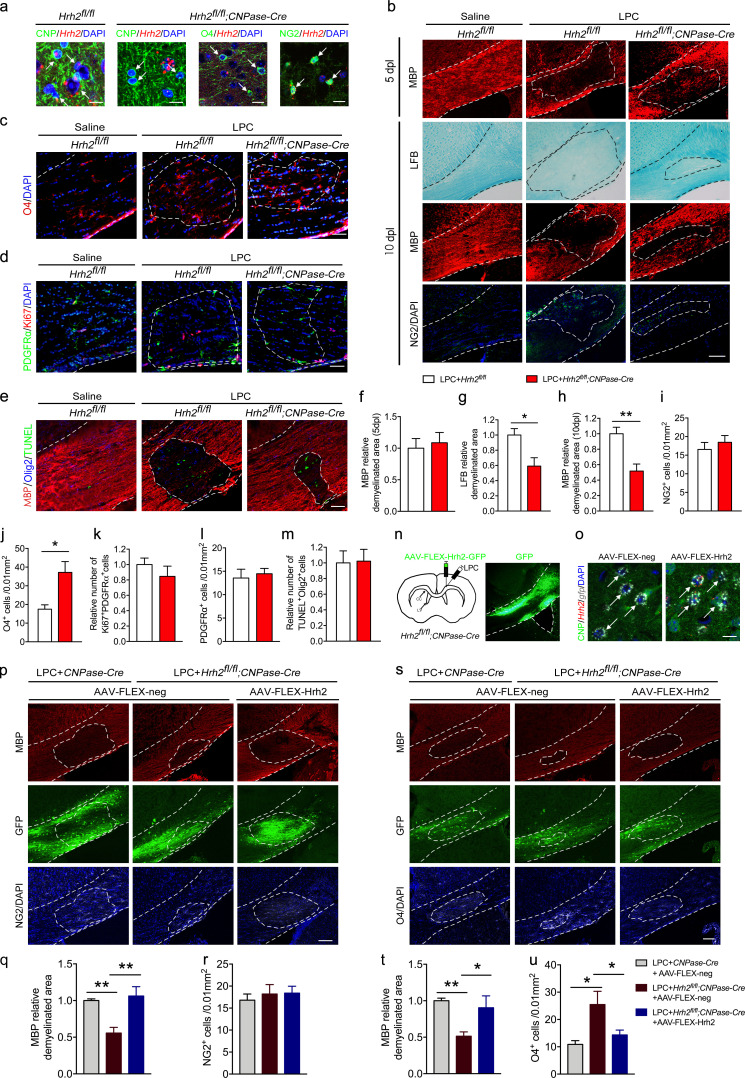
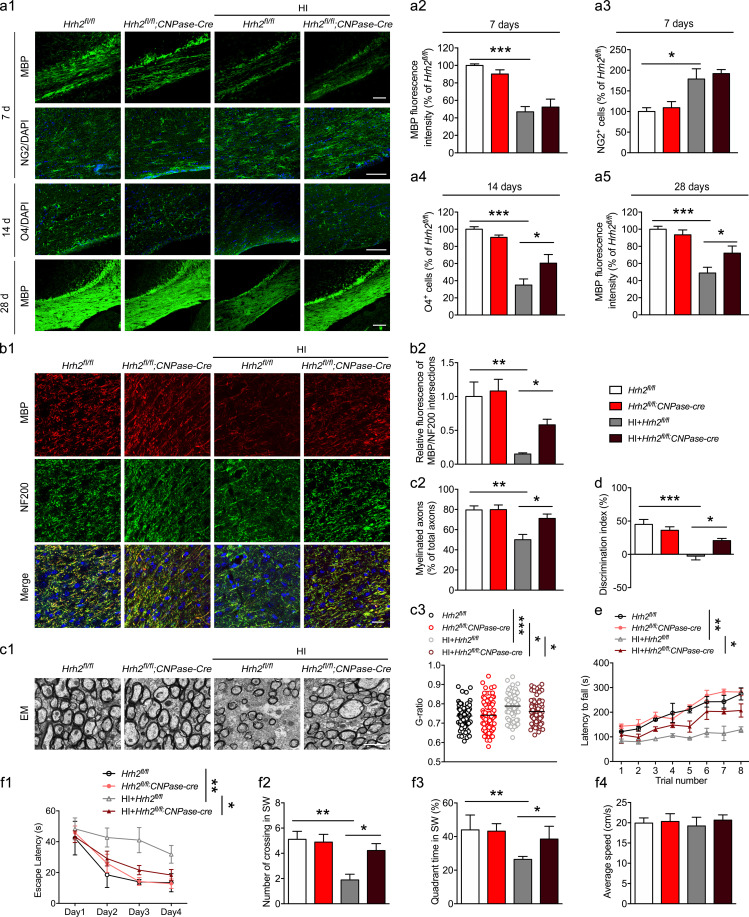
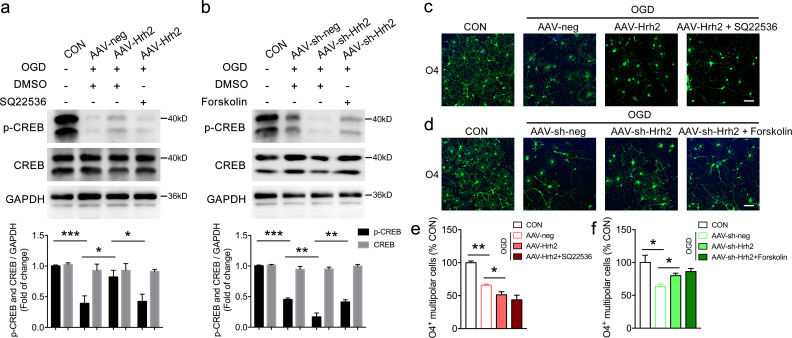
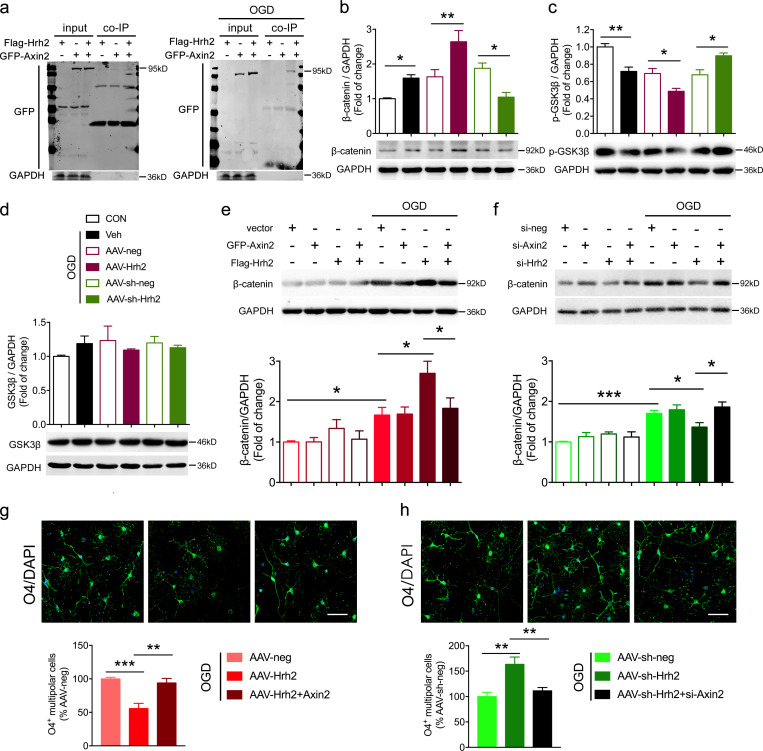
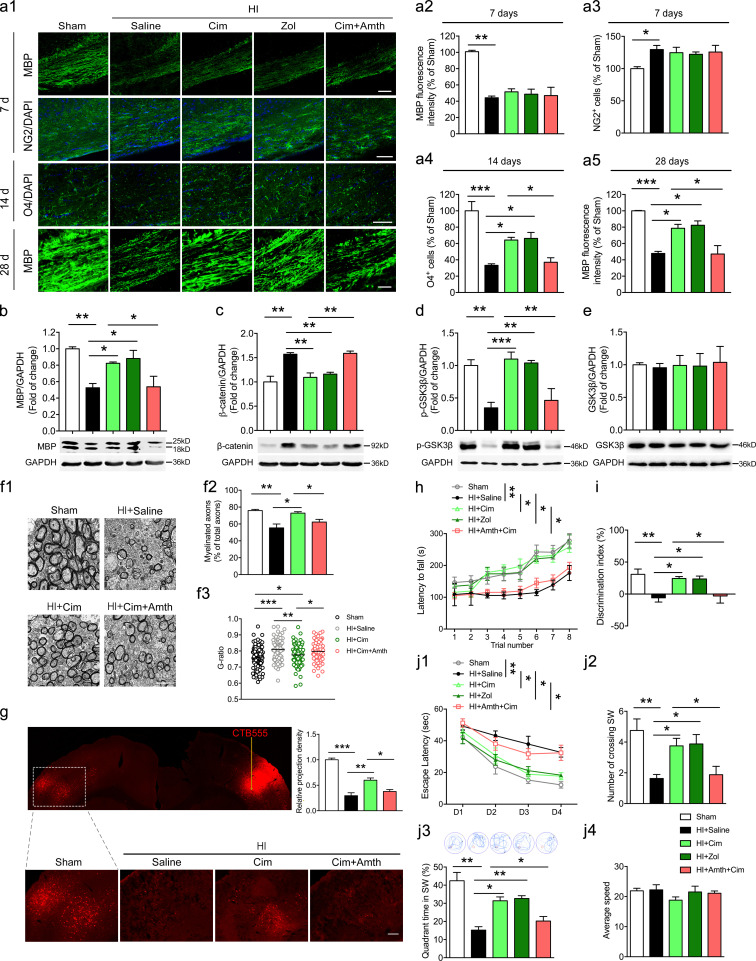
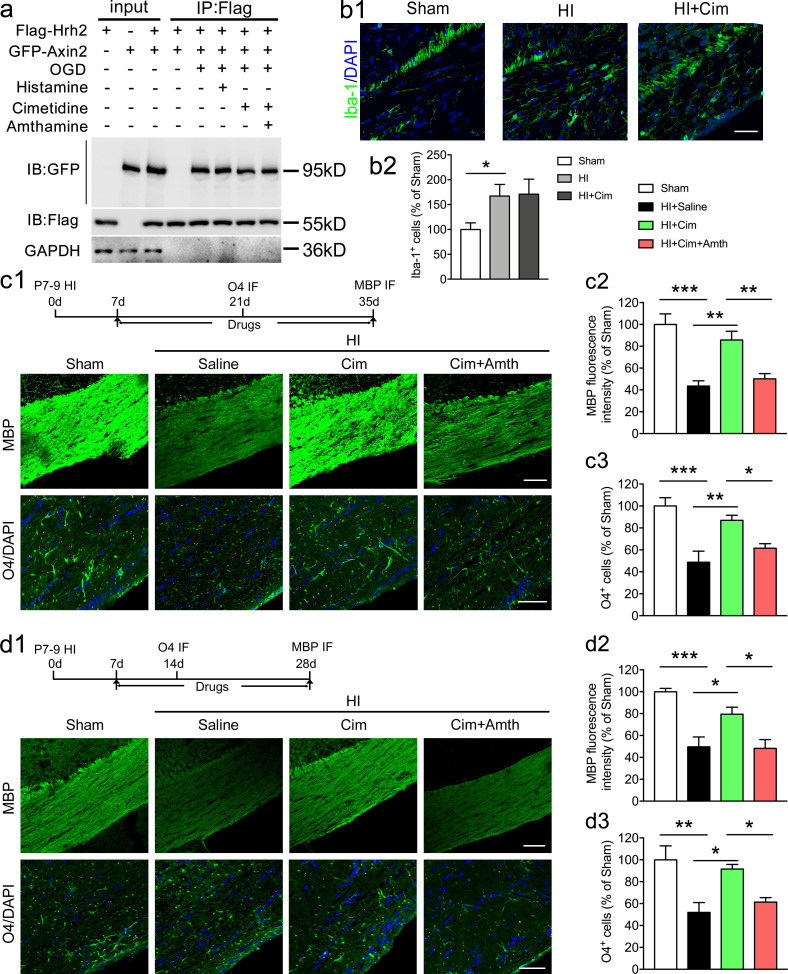
Neonatal hypoxic-ischemic encephalopathy (HIE) with the pathological characteristic of white matter injury often leads to lifelong cognitive and neurobehavioral dysfunction, but relevant therapies to promote remyelination are still unavailable. We found that histamine H2 receptor (H2R) negatively regulated the oligodendrocyte differentiation rate without affecting the oligodendrocytes at the oligodendrocyte precursor cell stage or mature stage following oxygen-glucose deprivation in vitro. Notably, selective deletion of the H2R gene (Hrh2) in differentiating oligodendrocytes (Hrh2fl/fl;CNPase-Cre) improved their differentiation, remyelination, and functional recovery following neonatal hypoxia-ischemia in mice. The regulation of oligodendrocyte differentiation by H2R is mediated by binding with Axin2, which leads to up-regulation of the Wnt/β-catenin signaling pathway. Furthermore, H2R antagonists also promoted oligodendrocyte differentiation and remyelination and the recovery of cognition and motor functions following neonatal hypoxia-ischemia. Thus, histamine H2R in oligodendrocytes could serve as a novel and effective therapeutic target for the retard of oligodendrocyte differentiation and remyelination following neonatal hypoxia-ischemia. The H2R antagonists may have potential therapeutic value for neonatal HIE.


Conflict of interest statement

Disclosures: The authors declare no competing interests exist.

Figures

None
Graphical abstract
Figure S1.
Figure S1.
H2R expression in the OL lineages and in different types of cells in the white matter following neonatal HI. (a) The primary cultured OPCs were differentiated with incubation in T3 (40 ng/ml) and CNTF (10 ng/ml) for 3 d (differentiating OLs) or 6 d (mature OLs). Immunocytochemical visualization of H2R expression in NG2+ OPCs, O4+ differentiating OLs, CC-1+, or MBP+ mature OLs. (b, d, and e) Immunohistochemical visualization of H2R protein as well as the quantification of the percentage of H2R+ cells and the intensity of H2R protein expression in NG2, O4, CNP, and CC-1+ OLs in the corpus callosum of the mouse brain. Green: NG2 labels OPCs; O4 and CNP label differentiating OLs; CC-1 labels mature OLs. Red, H2R; blue, DAPI. n = 4 or 5 from three independent experiments. (c and f) In situ hybridization of Hrh2 mRNA by RNAscope and the quantification of the Hrh2 mRNA expression intensity in NG2, O4, CNP, and CC-1+ OLs in the corpus callosum of the mouse brain. Green: NG2 labels OPCs; O4 and CNP label differentiating OLs, CC-1 labels mature OLs. Red, Hrh2 mRNA; blue, DAPI. n = 4 or 5 from three independent experiments. (g) Western blot analysis showing the protein expression of H2R in the corpus callosum at 1 d, 7 d, 14 d, and 28 d after neonatal HI. (h) ELISA of histamine level in the corpus callosum at 1 d, 7 d, 14 d, and 28 d after neonatal HI. (i–n) In situ hybridization of Hrh2 mRNA by RNAscope and the quantification of the Hrh2 mRNA expression intensity in OLs (Olig2+, i and k), microglia (Iba-1+, j and l), and astrocyte (GFAP+, m and n) in the corpus callosum after HI. (o) In situ hybridization of Hrh2 mRNA in pericytes by RNAscope together with immunostaining of PDGFRβ. n = 4 or 5 mice for each group from two independent experiments. All scale bars, 20 µm. *, P < 0.05; **, P < 0.01; ***, P < 0.001.
Figure 1.
Figure 1.
H2R negatively regulates OL differentiation following OGD in vitro. (a1–a3) The primary cultured OPCs or oli-neu cells were infected with AAV-Hrh2 or AAV-sh-Hrh2 and subjected to OGD/reperfusion. Immunocytochemical visualization (a1) and the quantification of numbers of NG2+ OPCs (a2) at 24 h after reperfusion. (a3) Western blot analysis of NG2+ expression in oli-neu cells at 24 h after reperfusion. (b1 and b2) The primary cultured OPCs were infected with AAV-Hrh2 or AAV-sh-Hrh2 and subjected to OGD/reperfusion. Immunocytochemical visualization (b1) and the quantification of numbers of O4+ multipolar cells (b2) at 2 d after reperfusion. (c1–c3) The primary cultured OPCs were differentiated into preOLs with incubation in T3 (40 ng/ml) and CNTF (10 ng/ml) for 2 d. The preOLs infected with AAV-Hrh2 or AAV-sh-Hrh2 were subjected to OGD/reperfusion. Immunocytochemical visualization (c1) and the quantification of numbers of O4+ multipolar OLs (c2) at 24 h after reperfusion. The cells in the box portion in c1 were enlarged in the bottom panel. (c3) The process extensions for O4+ multipolar OLs were analyzed using Sholl analysis. Branching was quantified by measuring the number of intersections that processes made with concentric circles, which are numbered 1–3 to reflect increasing distance from the cell body. (d1–d5) The primary cultured OPCs or oli-neu cells were differentiated into immature OLs with incubation in T3 (40 ng/ml) and CNTF (10 ng/ml) for 4 d. The immature OLs infected with AAV-Hrh2 or AAV-sh-Hrh2 were subjected to OGD/reperfusion. Immunocytochemical visualization (d1) and the quantification of numbers of CC-1+ mature OLs (d2) or MBP+ multipolar mature OLs (d3) at 24 h after reperfusion. (d4 and d5) Western blot analysis of CC-1+ and MBP+ expression in oli-neu cells at 24 h after reperfusion. (e1 and e2) The primary cultured OPCs were differentiated into mature OLs with incubation in T3 (40 ng/ml) and CNTF (10 ng/ml) for 6 d. The mature OLs infected with AAV-Hrh2 or AAV-sh-Hrh2 were subjected to OGD/reperfusion. Immunocytochemical visualization (e1) and the quantification of numbers of MBP+ multipolar mature OLs (e2) at 24 h after reperfusion. (f1–f3) The primary cultured OPCs were differentiated into preOLs with incubation in T3 (40 ng/ml) and CNTF (10 ng/ml) for 2 d. The preOLs infected with AAV-sh-Hrh2 were subjected to OGD/reperfusion. Immunocytochemical visualization (f1) and the quantification of percentage of O4+ (MBP) multipolar OLs and MBP+ multipolar OLs (f3) at 1 d, 3 d, 5 d, and 7 d after reperfusion (3 d, 5 d, 7 d, and 9 d differentiated from OPCs). (f2) The ratio of the MBP+ multipolar OL numbers to O4+ (MBP) multipolar OL numbers. Green: NG2 labels OPCs in a1; O4 labels preOLs in b1, c1, or f1; CC-1 and MBP label mature OLs in d1 or e1. Red, MBP labels mature OLs in f1; blue, DAPI. Scale bar, 50 µm. n = 4–6 from at least three independent experiments. *, P < 0.05; **, P < 0.01; ***, P < 0.001. The red asterisks represent the P value of the change in the numbers of MBP+ multipolar mature OLs, and the green asterisks represent the P value of the change in the numbers of O4+ (MBP) multipolar differentiating OLs in f3. CON, control; IF, immunofluorescence staining; Veh, vehicle.
Figure S2.
Figure S2.
The effect of overexpression and knockdown of H2R on cultured OLs. (a) The primary cultured OPCs were differentiated into preOLs with incubation in T3 (40 ng/ml) and CNTF (10 ng/ml) for 2 d. Immunocytochemical staining of Olig2 together with GFAP, NG2, or O4 was performed to confirm the purity of OPCs (NG2) or preOLs (O4), respectively. The percentage of Olig2+ OL lineage (and the percentage of astrocytes) in cultured cells as well as the percentage of NG2+ OPC and O4+ multipolar preOLs among all the Olig2+ OLs were quantified. Scale bar, 50 µm. (b and c) The AAV-Hrh2 and AAV-sh-Hrh2 infection efficiency was evaluated by immunocytochemical staining in primary cultured OLs (b) and Western blot analysis of oli-neu cells (c). (d1–d3) The primary cultured OPCs were differentiated into preOLs or immature OLs with incubation in T3 (40 ng/ml) and CNTF (10 ng/ml) for 2 d or 4 d, respectively. These preOLs or immature OLs transfected with AAV-Hrh2 or AAV-sh-Hrh2 were subjected to OGD/reperfusion. The total number of Olig2+ OL lineages was quantified at 24 h after reperfusion. Scale bar, 20 µm. (e1, e2, f, and g) The primary cultured OPCs or oli-neu cells were differentiated into preOLs with incubation in T3 (40 ng/ml) and CNTF (10 ng/ml) for 2 d. These preOLs infected with AAV-Hrh2 or AAV-sh-Hrh2 were subjected to OGD/reperfusion. (e1 and e2) Immunocytochemical visualization and the quantification of numbers of O4 and TUNEL double-positive OLs at 24 h after reperfusion. (f) Cell viability tested by MTT assay in oli-neu cells at 24 h after reperfusion. (g) Western blot analysis of cleaved-caspase3 in oli-neu cells at 24 h after reperfusion. (h1–h3 and i) The primary cultured OPCs or oli-neu cells were differentiated into preOLs or immature OLs with incubation in T3 (40 ng/ml) and CNTF (10 ng/ml) for 2 d or 4 d, respectively. These preOLs or immature OLs transfected with AAV-Hrh2 or AAV-sh-Hrh2 were allowed further differentiation for 1 d. Immunocytochemical visualization (h1) and the quantification of numbers of O4+ multipolar cells differentiated from preOLs (h2). Immunocytochemical visualization (h1) and the quantification of numbers of MBP+ multipolar cells differentiated from immature OLs (h3). Scale bar, 50 µm. (i) Western blot analysis of the MBP expression in oli-neu cells differentiated from immature stage. n = 4–6 trials from at least three independent experiments. *, P < 0.05; **, P < 0.01; ***, P < 0.001. CON, control; Veh, vehicle.
Figure S3.
Figure S3.
The effect of overexpression and knockdown of H2R on remyelination and neurological function in LPC-induced demyelination model. (a1–a3) Mice were injected with AAV-Hrh2 or AAV-sh-Hrh2 to overexpress or knock down H2R, and then received the LPC injection in the right side of the corpus callosum. Immunocytochemical visualization (a1) and quantification of demyelinated area in MBP staining (a2) and NG2+ OPCs (a3) in the LPC-induced demyelinated area at 10 dpl. The location of virus injection was indicated by mCherry (red) expression. (b1–b4) CNPase-Cre mice were injected with AAV-FLEX-Hrh2 to overexpress H2R in differentiating OLs (or AAV-FLEX-neg as control), and then received LPC injection in two sites of the corpus callosum and cimetidine treatment (Cim). Immunocytochemical visualization (b1) and quantification of demyelinated area in MBP staining (b2) at 10 dpl, as well as motor coordination in rotarod test (b3) and cognitive ability in object recognition test (b4) at 9–10 dpl. (c1 and c2) CX3CR1-Cre mice were received Lenti-FLEX-Hrh2 infection to overexpress H2R in microglia, and then received the LPC injection in the right side of corpus callosum. (c1) In situ hybridization of Hrh2 mRNA by RNAscope, immunostaining of Iba-1 and GFP, and visualization of nuclei by DAPI in the corpus callosum to confirm the overexpression H2R in microglia (arrows indicate the virus-infected Iba-1+ microglia). (c2) Immunocytochemical visualization and quantification of demyelinated area in MBP staining at 10 dpl. (d1 and d2) GFAP-Cre mice received AAV-FLEX-Hrh2 or AAV-FLEX-sh-Hrh2 infection to overexpress or knock down H2R, and then received the LPC injection in the right side of the corpus callosum. (d1) In situ hybridization of Hrh2 mRNA by RNAscope, immunostaining of GFAP and GFP, and visualization of nuclei by DAPI in the corpus callosum to confirm the overexpression or knockdown of H2R in astrocytes (arrows indicate the virus infected GFAP+ astrocytes). (d2) Immunocytochemical visualization and quantification of demyelinated area in MBP expression at 10 dpl. (e) HDC/− mice received the LPC injection in the right side of the corpus callosum and were administered cimetidine. Immunocytochemical visualization and quantification of demyelinated area in MBP staining at 10 dpl. All scale bars, 100 µm. n = 5 or 6 mice for each group from at least three independent experiments in a1–a3, b1, b2, c1, c2, d1, d2, and e; n = 7 or 8 mice for each group from at least three independent experiments in b3 and b4. The areas outlined by a dashed line indicate the demyelinated areas. *, P < 0.05; **, P < 0.01.
Figure 2.
Figure 2.
Selective deletion of H2R in differentiating OLs promotes OL differentiation and remyelination in LPC-induced WMI. (a) To specifically delete Hrh2 in differentiating OLs, Hrh2fl/fl homozygous mice were mated with CNPase-Cre mice to generate Hrh2fl/fl;CNPase-Cre mice. In situ hybridization of Hrh2 mRNA by RNAscope together with immunostaining of CNP, O4, or NG2 and visualization of nuclei by DAPI in the corpus callosum to confirm the deletion of H2R in differentiating OLs, but not in OPCs. Scale bar, 20 µm. (b–m) Hrh2fl/fl;CNPase-Cre mice and Hrh2fl/fl control mice were subjected to LPC injections in the corpus callosum. Representative images (b) and quantification of demyelinated area in MBP staining (f and h) and LFB staining (g), as well as numbers of NG2+ OPCs in the LPC-induced demyelinated area (i) at 5 d or 10 dpl. Red, MBP; green, NG2; blue, DAPI. n = 4–6 mice for each group from at least three independent experiments. Scale bar, 100 µm. Immunohistochemical visualization (c–e) and quantification of O4+ preOLs (j), OPC proliferation (Ki67 and PDGFRα colabeled cells, k), OPC numbers (PDGFRα labeled cells, l), and OL apoptosis (TUNEL and Olig2 colabeled cells, m) at 10 dpl. n = 4 or 5 mice for each group from at least two independent experiments. Scale bar, 50 µm. (n–s) Cre-dependent AAV containing floxed Hrh2-GFP (AAV-FLEX-Hrh2-GFP) was injected into the corpus callosum of Hrh2fl/fl;CNPase-Cre mice to selectively reexpress H2R in differentiating OLs. (n) Schematic diagram of microinjection of AAV-FLEX-Hrh2 and LPC in the corpus callosum of Hrh2fl/fl;CNPase-Cre mice, and representative images of Hrh2-GFP expression in the corpus callosum of Hrh2fl/fl;CNPase-Cre mice. (o) In situ hybridization of Hrh2 and gfp mRNA by RNAscope, immunostaining of CNP, and visualization of nuclei by DAPI in the corpus callosum to confirm the reexpression H2R in differentiating OLs. Arrows indicate the AAV-FLEX-Hrh2–infected OLs. Scale bar, 20 µm. (p–r) Immunohistochemical visualization (p) and quantification of demyelinated area in MBP staining (q) and NG2+ OPC numbers in LPC-induced demyelinated area (r) of Hrh2fl/fl;CNPase-Cre mice injected with AAV-FLEX-Hrh2-GFP or AAV-FLEX-GFP as control. Red, MBP; green, GFP; gray, NG2; blue, DAPI. (s–u) Immunohistochemical visualization (s) and quantification of demyelinated area in MBP staining (t) and O4+ differentiating OL numbers in LPC-induced demyelinated area (u) of Hrh2fl/fl;CNPase-Cre mice injected with AAV-FLEX-Hrh2-GFP or AAV-FLEX-GFP as control. Red, MBP; green, GFP; gray, O4; blue, DAPI. Scale bar, 100 µm. n = 5 mice for each group from three independent experiments. *, P < 0.05; **, P < 0.01. The areas outlined by a dashed line indicate the quantified areas in the corpus callosum.
Figure 3.
Figure 3.
Selective deletion of H2R in differentiating OLs promotes OL differentiation, remyelination, and functional recovery in neonatal HI mice. Hrh2fl/fl;CNPase-Cre and Hrh2fl/fl neonates were subjected to unilateral common carotid artery ligation plus inhalational hypoxia. (a1–a5) Immunohistochemical visualization and quantification of MBP expression and NG2+ OPC numbers at 7 d, O4+ differentiating OL numbers at 14 d, as well as MBP expression at 28 d after HI. n = 5–7 mice for each group from at least three independent experiments. Scale bars, 100 µm. (b1 and b2) Immunohistochemical visualization and quantification of colocalization of MBP and NF200 in the corpus callosum of Hrh2fl/fl;CNPase-Cre and Hrh2fl/fl mice at 28 d after HI. n = 5 mice for each group from three independent experiments. Scale bar, 50 µm. (c1–c3) Representative images, the percentage of myelinated axon fibers, and the g-ratio of myelinated axons in the corpus callosum from electron microscopy at 28 d after HI. n = 3 mice for each group from two independent experiments in c1 and c2; n = 74–109 axons for each group from three mice. Scale bar, 2 µm. (e) Motor coordination evaluated by the latency to fall from a rotating cylinder in rotarod tests in Hrh2fl/fl;CNPase-Cre and Hrh2fl/fl mice at day 28 after HI. Cognitive behavior was evaluated by discrimination index in object recognition test (d) and by Morris water maze test (f1–f4) for Hrh2fl/fl;CNPase-Cre and Hrh2fl/fl mice from 28 d to 35 d after HI. (f1) Latency to reach the platform during the acquisition trial. (f2 and f3) Searching time (f2) and crossing number (f3) in the SW quadrant (target quadrant) in the probe trial. (f4) Average speed in the probe trial. n = 8–10 mice for each group from at least three independent behavior experiments. *, P < 0.05; **, P < 0.01; ***, P < 0.001. EM, electron microscopy.
Figure S4.
Figure S4.
The effect of overexpression and knockdown of H2R on the AC/cAMP/CREB pathway during OL differentiation after OGD insult. (a) Western blot analysis of phosphorylation of CREB (p-CREB) and CREB following AAV-Hrh2 infection and SQ22536 treatment in oli-neu cells exposed to OGD/reperfusion. (b) Western blot analysis of p-CREB and CREB following AAV-sh-Hrh2 infection and forskolin treatment in oli-neu cells exposed to OGD/reperfusion. (c and e) Immunocytochemical visualization and quantification of O4+ multipolar differentiating OLs following AAV-Hrh2 infection and SQ22536 treatment. (d and f) Immunocytochemical visualization and quantification of O4+ multipolar differentiating OLs following AAV-sh-Hrh2 infection and forskolin treatment. n = 3 or 4 from three independent experiments. Scale bar, 50 µm. *, P < 0.05; **, P < 0.01; ***, P < 0.001. CON, control.
Figure 4.
Figure 4.
H2R inhibits OL differentiation by binding with axin2 to up-regulate the Wnt/β-catenin signaling pathway. (a) Representative co-immunoprecipitation results showing the interaction of H2R with Axin2 following OGD/reperfusion (bands of GFP  are located at ~95 kD). (b–d) Western blot analysis showing the effect of H2R overexpression (AAV-Hrh2) or knockdown (AAV-sh-Hrh2) on β-catenin, p-GSK3β, and GSK3β expression in OGD-treated oli-neu cells. (e) Western blot analysis showing the effect of Flag-Hrh2 plasmid cotransfection with GFP-Axin2 plasmid on β-catenin expression compared with the Flag-Hrh2 single transfection in OGD-treated oli-neu cells. (f) Western blot analysis showing the effect of small interfering (si)-Hrh2 cotransfection with si-Axin2 on β-catenin expression compared with the si-Hrh2 single transfection in OGD-treated oli-neu cells. (g and h) Immunocytochemical visualization and quantification of primary O4+ multipolar differentiating OLs that received the transfection of AAV-Hrh2 and Axin2 plasmid (g) or transfection of AAV-sh-Hrh2 and si-Axin2 (h) and exposure to OGD/reperfusion. n = 4–7 from at least three independent experiments. Scale bar, 50 µm. *, P < 0.05; **, P < 0.01; ***, P < 0.001. co-IP, co-immunoprecipitation; CON, control; Veh, vehicle.
Figure 5.
Figure 5.
H2R antagonists accelerate OL differentiation to alleviate the WMI and neurological function impairments in neonatal HI mice. Neonatal mice were subjected to unilateral common carotid artery ligation plus inhalational hypoxia and administrated with H2R antagonist cimetidine (Cim) or zolantidine (Zol), or cimetidine combined with H2R agonist amthamine (Amth) from 1 d to 28 d after HI. (a1–a5) Immunohistochemical visualization and quantification of MBP expression and NG2+ OPC numbers at 7 d, O4+ differentiating OL numbers at 14 d, and MBP expression at 28 d after HI surgery in the corpus callosum of mice administrated with H2R antagonists or agonists. n = 3–5 mice for each group from at least three independent experiments. All scale bars, 100 µm. (b–e) Western blot analysis of MBP expression at 28 d, as well as β-catenin, p-GSK3β, and GSK3β expression at 14 d after HI. n = 3–5 mice for each group from at least three independent experiments. (f1–f3) Representative images, the percentage of myelinated axon fibers, and the g-ratio of myelinated axons in the corpus callosum from electron microscopy at 28 d after HI. n = 3 mice for each group from at least two independent experiments in f1 and f2; n = 71–104 axons for each group from three mice in f3. Scale bar, 2 µm. (g) CTB555 was injected into the primary somatosensory barrel cortex to retrogradely trace axonal projections. The fluorescence-labeled neurons in the contralateral cortex were quantified. n = 6 mice for each group from three independent experiments. (h) Motor coordination evaluated by latency to fall from a rotating cylinder at 28 d after neonatal HI in mice administered H2R antagonists or agonist. (i and j1–j4) Cognitive behavior was evaluated by discrimination index in object recognition test (i) and Morris water maze test (j1–j4) from 28 d to 35 d after HI in mice administered H2R antagonists or agonist. (j1) Latency to reach the platform during the acquisition trial. (j2) Crossing number and (j3) searching time in the quadrant SW (target quadrant) in the probe trial. (j4) Average speed in the probe trial. n = 8–10 mice for each group from at least three independent behavior experiments. *, P < 0.05; **, P < 0.01; ***, P < 0.001.
Figure S5.
Figure S5.
Effects of H2R antagonist on the interaction between H2R and Axin2 or on the WMI in neonatal HI mice. (a) Representative coimmunoprecipitation results showing the effect of histamine, H2R antagonist cimetidine (Cim), or H2R agonist amthamine (Amth) on the interaction of H2R with Axin2 following OGD/reperfusion. (b1 and b2) Neonatal mice were subjected to unilateral common carotid artery ligation plus inhalational hypoxia and received cimetidine administration. Immunohistochemical visualization (b1) and quantification of Iba-1 expression (b2) indicating microglia activation at 14 d after HI. n = 4 mice for each group from two independent experiments. (c1–c3) The H2R antagonist cimetidine alone or together with H2R agonist amthamine was administered by a delayed (7–35 d, a–d) approach after HI surgery. Immunohistochemical visualization (c1) and quantification of MBP expression at 35 d (c2) and O4+ multipolar differentiating OLs at 21 d (c3). n = 7 mice for each group from three independent experiments. (d1–d3) The H2R antagonist cimetidine alone or together with H2R agonist amthamine was administered by a shortened and delayed (7–28 d) approach after HI surgery. Immunohistochemical visualization (d1) and quantification of MBP expression at 28 d (d2) and O4+ multipolar differentiating OLs at 14 d (d3). n = 6 mice for each group from three independent experiments. Scale bar, 100 µm. *, P < 0.05; **, P < 0.01; ***, P < 0.001. IB, immunoblot; IF, immunofluorescence staining; IP, immunoprecipitation.

References

    1. Back S.A., Han B.H., Luo N.L., Chricton C.A., Xanthoudakis S., Tam J., Arvin K.L., and Holtzman D.M.. 2002. Selective vulnerability of late oligodendrocyte progenitors to hypoxia-ischemia. J. Neurosci. 22:455–463. 10.1523/JNEUROSCI.22-02-00455.2002 - DOI - PMC - PubMed
    1. Behrens J., Jerchow B.A., Würtele M., Grimm J., Asbrand C., Wirtz R., Kühl M., Wedlich D., and Birchmeier W.. 1998. Functional interaction of an axin homolog, conductin, with beta-catenin, APC, and GSK3beta. Science. 280:596–599. 10.1126/science.280.5363.596 - DOI - PubMed
    1. Billiards S.S., Haynes R.L., Folkerth R.D., Borenstein N.S., Trachtenberg F.L., Rowitch D.H., Ligon K.L., Volpe J.J., and Kinney H.C.. 2008. Myelin abnormalities without oligodendrocyte loss in periventricular leukomalacia. Brain Pathol. 18:153–163. 10.1111/j.1750-3639.2007.00107.x - DOI - PMC - PubMed
    1. Blakemore W.F., and Franklin R.. 2008. Remyelination in experimental models of toxin-induced demyelination. In Current Topics in Microbiology and Immunology. Rodriguez M., editor. Springer-Verlag Berlin, Berlin: pp. 193–212. - PubMed
    1. Buser J.R., Maire J., Riddle A., Gong X., Nguyen T., Nelson K., Luo N.L., Ren J., Struve J., Sherman L.S., et al. . 2012. Arrested preoligodendrocyte maturation contributes to myelination failure in premature infants. Ann. Neurol. 71:93–109. 10.1002/ana.22627 - DOI - PMC - PubMed

Publication types

MeSH terms