

Overexpression of the SARS-CoV-2 receptor ACE2 is induced by cigarette smoke in bronchial and alveolar epithelia
- PMID: 32991738
- PMCID: PMC7537258
- DOI: 10.1002/path.5555
Overexpression of the SARS-CoV-2 receptor ACE2 is induced by cigarette smoke in bronchial and alveolar epithelia
Abstract
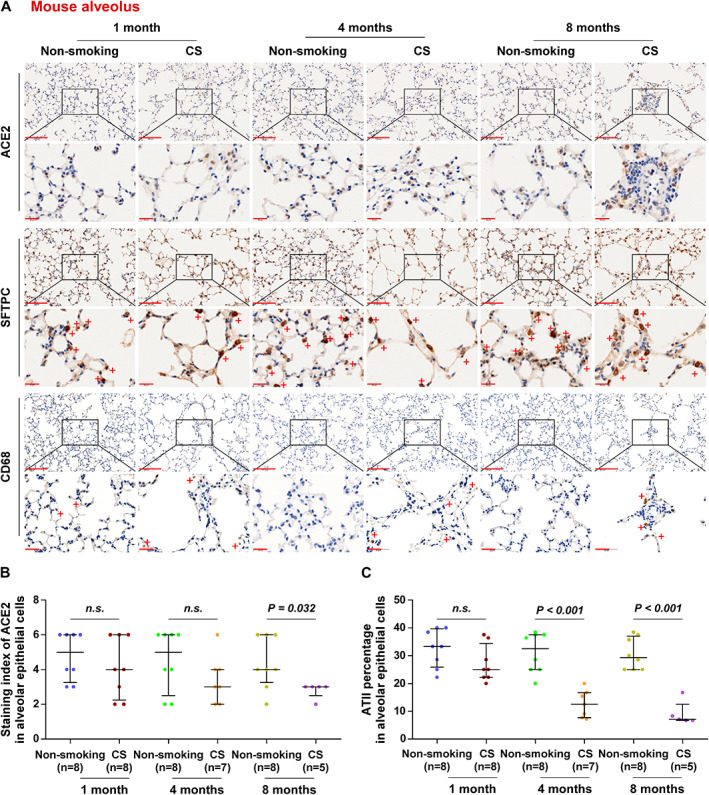
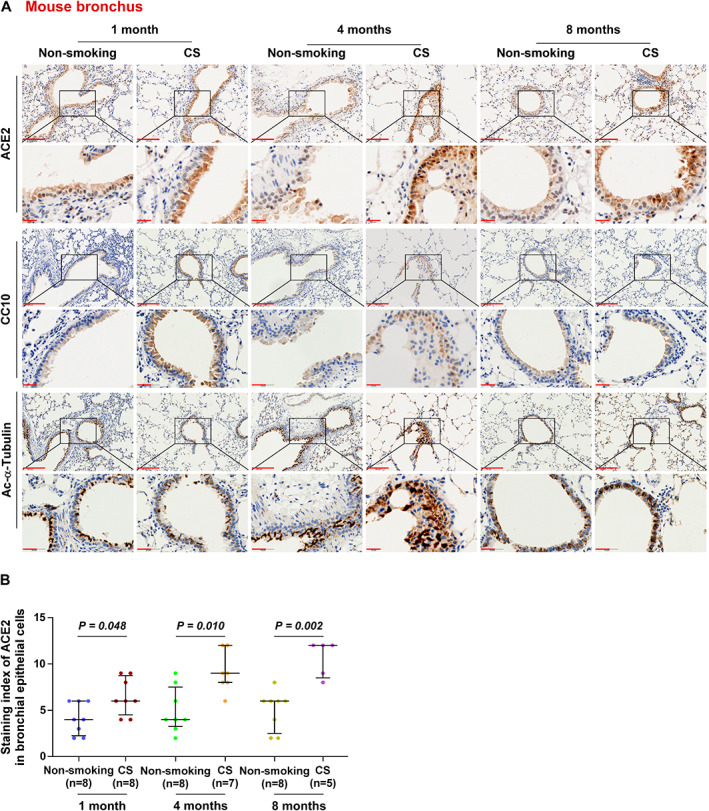
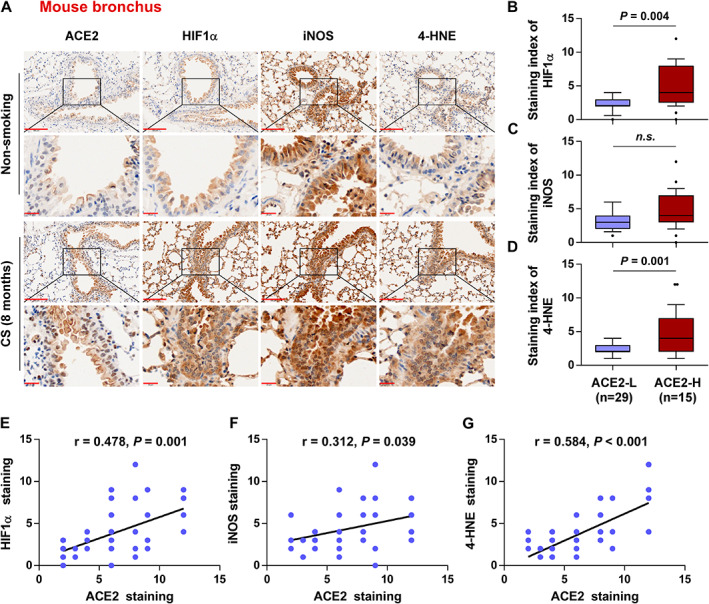
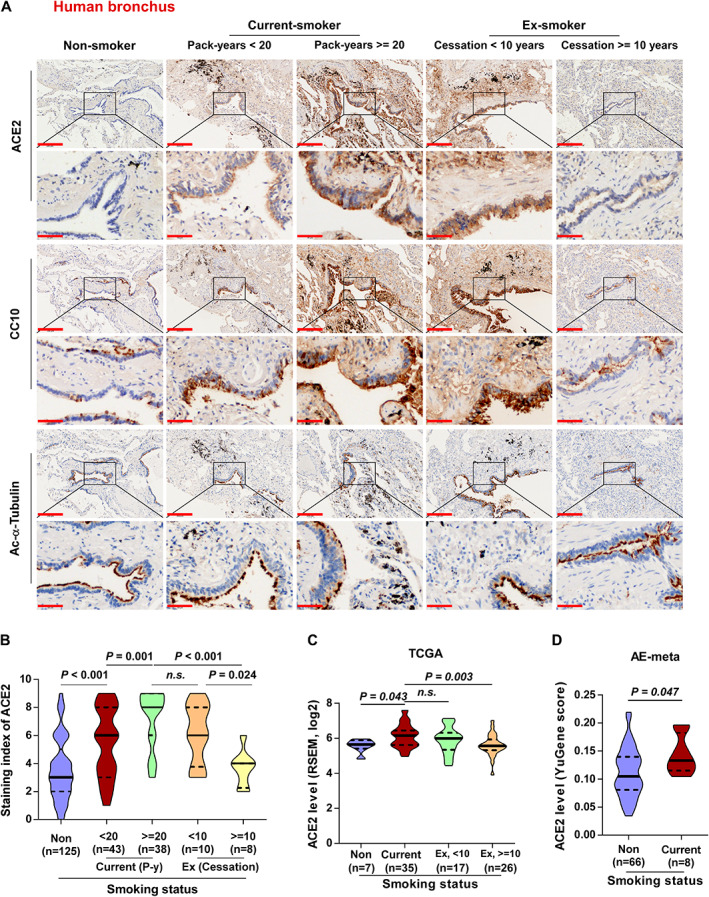
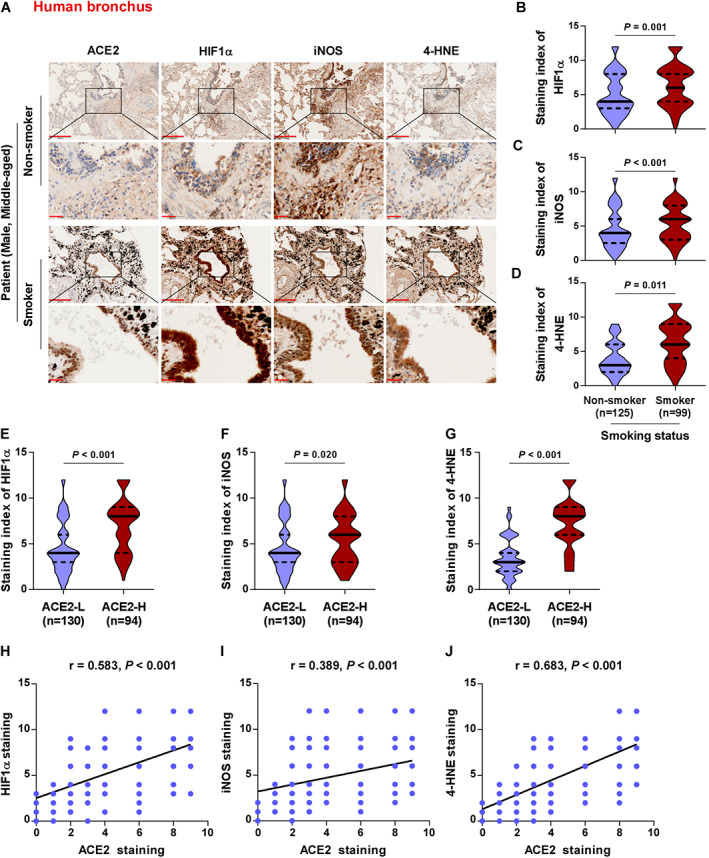
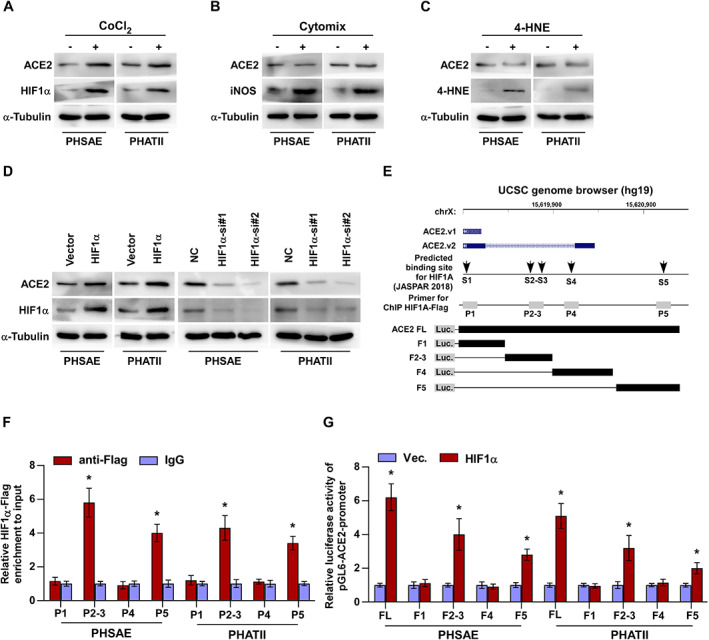
Angiotensin-converting enzyme 2 (ACE2) has been identified as the functional receptor of severe acute respiratory syndrome coronavirus 2 (SARS-CoV-2) and a target for disease prevention. However, the relationship between ACE2 expression and its clinical implications in SARS-CoV-2 pathogenesis remains unknown. Here, we explored the location and expression of ACE2, and its correlation with gender, age, and cigarette smoke (CS), in a CS-exposed mouse model and 224 non-malignant lung tissues (125 non-smokers, 81 current smokers, and 18 ex-smokers) by immunohistochemistry. Moreover, the correlations of ACE2 with CS-induced oxidative stress-related markers, hypoxia-inducible factor-1α (HIF-1α), inducible nitric oxide synthase (iNOS), and 4-hydroxynonenal (4-HNE) were investigated. Chromatin immunoprecipitation and luciferase reporter assays identified the cause of ACE2 overexpression in human primary lung epithelial cells. We demonstrated that ACE2 was predominantly overexpressed on the apical surface of bronchial epithelium, while reduced in alveolar epithelium, owing to the dramatically decreased abundance of alveolar type II pneumocytes in CS-exposed mouse lungs. Consistent with this, ACE2 was primarily significantly overexpressed in human bronchial and alveolar epithelial cells in smokers regardless of age or gender. Decreased ACE2 expression was observed in bronchial epithelial cells from ex-smokers compared with current smokers, especially in those who had ceased smoking for more than 10 years. Moreover, ACE2 expression was positively correlated with the levels of HIF-1α, iNOS, and 4-HNE in both mouse and human bronchioles. The results were further validated using a publicly available dataset from The Cancer Genome Atlas (TCGA) and our previous integrated data from Affymetrix U133 Plus 2.0 microarray (AE-meta). Finally, our results showed that HIF-1α transcriptionally upregulates ACE2 expression. Our results indicate that smoking-induced ACE2 overexpression in the apical surface of bronchial epithelial cells provides a route by which SARS-CoV-2 enters host cells, which supports clinical relevance in attenuating the potential transmission risk of COVID-19 in smoking populations by smoking cessation. © 2020 The Pathological Society of Great Britain and Ireland. Published by John Wiley & Sons, Ltd.
Keywords: ACE2; COVID-19; SARS-CoV-2; alveolar epithelial cells; bronchial epithelial cells; cigarette smoke.
© 2020 The Pathological Society of Great Britain and Ireland. Published by John Wiley & Sons, Ltd.
Figures
Comment in
-
Effects of cigarette smoking on SARS-CoV-2 receptor ACE2 expression in the respiratory epithelium†.J Pathol. 2021 Apr;253(4):351-354. doi: 10.1002/path.5607. Epub 2021 Jan 26. J Pathol. 2021. PMID: 33368245 Free PMC article.
Similar articles
-
Paradoxical effects of cigarette smoke and COPD on SARS-CoV-2 infection and disease.BMC Pulm Med. 2021 Aug 23;21(1):275. doi: 10.1186/s12890-021-01639-8. BMC Pulm Med. 2021. PMID: 34425811 Free PMC article.
-
Cigarette Smoke Stimulates SARS-CoV-2 Internalization by Activating AhR and Increasing ACE2 Expression in Human Gingival Epithelial Cells.Int J Mol Sci. 2021 Jul 18;22(14):7669. doi: 10.3390/ijms22147669. Int J Mol Sci. 2021. PMID: 34299289 Free PMC article.
-
SARS-CoV-2 (COVID-19) Adhesion Site Protein Upregulation in Small Airways, Type 2 Pneumocytes, and Alveolar Macrophages of Smokers and COPD - Possible Implications for Interstitial Fibrosis.Int J Chron Obstruct Pulmon Dis. 2022 Jan 11;17:101-115. doi: 10.2147/COPD.S329783. eCollection 2022. Int J Chron Obstruct Pulmon Dis. 2022. PMID: 35046647 Free PMC article.
-
Involvement of the ACE2/Ang-(1-7)/MasR Axis in Pulmonary Fibrosis: Implications for COVID-19.Int J Mol Sci. 2021 Nov 30;22(23):12955. doi: 10.3390/ijms222312955. Int J Mol Sci. 2021. PMID: 34884756 Free PMC article. Review.
-
Epithelial and Endothelial Expressions of ACE2: SARS-CoV-2 Entry Routes.J Pharm Pharm Sci. 2021;24:84-93. doi: 10.18433/jpps31455. J Pharm Pharm Sci. 2021. PMID: 33626315 Review.
Cited by
-
Alternative RAS in Various Hypoxic Conditions: From Myocardial Infarction to COVID-19.Int J Mol Sci. 2021 Nov 26;22(23):12800. doi: 10.3390/ijms222312800. Int J Mol Sci. 2021. PMID: 34884604 Free PMC article. Review.
-
ERS International Congress 2021: highlights from the Epidemiology and Environment Assembly.ERJ Open Res. 2022 May 23;8(2):00697-2021. doi: 10.1183/23120541.00697-2021. eCollection 2022 Apr. ERJ Open Res. 2022. PMID: 35615413 Free PMC article.
-
Clinical outcomes in patients with COPD hospitalized with SARS-CoV-2 versus non- SARS-CoV-2 community-acquired pneumonia.Respir Med. 2022 Jan;191:106714. doi: 10.1016/j.rmed.2021.106714. Epub 2021 Dec 9. Respir Med. 2022. PMID: 34915396 Free PMC article.
-
Long COVID among US adults from a population-based study: Association with vaccination, cigarette smoking, and the modifying effect of chronic obstructive pulmonary disease (COPD).Prev Med. 2024 Jul;184:108004. doi: 10.1016/j.ypmed.2024.108004. Epub 2024 May 14. Prev Med. 2024. PMID: 38754738 Free PMC article.
-
Inhalable SPRAY nanoparticles by modular peptide assemblies reverse alveolar inflammation in lethal Gram-negative bacteria infection.Sci Adv. 2024 Sep 13;10(37):eado1749. doi: 10.1126/sciadv.ado1749. Epub 2024 Sep 13. Sci Adv. 2024. PMID: 39270015 Free PMC article.
References
-
- World Health Organization . Weekly Operation Update on COVID‐19, 4 September 2020. [Accessed 6 September 2020]. Available from: https://www.who.int/docs/default-source/coronaviruse/situation-reports/w...
-
- Tipnis SR, Hooper NM, Hyde R, et al. A human homolog of angiotensin‐converting enzyme. Cloning and functional expression as a captopril‐insensitive carboxypeptidase. J Biol Chem 2000; 275 : 33238–33243. - PubMed
Publication types
MeSH terms
Substances
Grants and funding
- 2018A030310007/Science and Technology Project of Guangdong Province/International
- 2019A1515011565/Science and Technology Project of Guangdong Province/International
- 2019M660206/China Postdoctoral Science Foundation Grant/International
- 160260003/Emergency project of prevention and control for COVID-19 of Central South University/International
- A2017103/Medical Science Foundation of Guangdong Province/International
- J201801/Medical Science Foundation of Jiangmen Central Hospital/International
- 81602028/National Natural Science Foundation of China/International
- 81702917/National Natural Science Foundation of China/International
- 81770045/National Natural Science Foundation of China/International
- 81802918/National Natural Science Foundation of China/International
- 2019JJ50970/Natural Science Foundation of Hunan Province/International
- 2018090106380023859/Science and Technology Project of Jiangmen/International
- 2019-252-2-1/Science and Technology Project of Jiangmen/International
- 2019030102430012905/Science and Technology Project of Jiangmen/International
- 20181273/Science Foundation of Guangdong Province Bureau of Traditional Chinese Medicine/International
LinkOut - more resources
Full Text Sources
Medical
Molecular Biology Databases
Miscellaneous
