. 2020 Nov 5;27(5):765-783.e14.
doi: 10.1016/j.stem.2020.09.001. Epub 2020 Sep 28.

Loss of Extreme Long-Range Enhancers in Human Neural Crest Drives a Craniofacial Disorder

Affiliations

Loss of Extreme Long-Range Enhancers in Human Neural Crest Drives a Craniofacial Disorder

Hannah K Long et al. Cell Stem Cell. .

Abstract

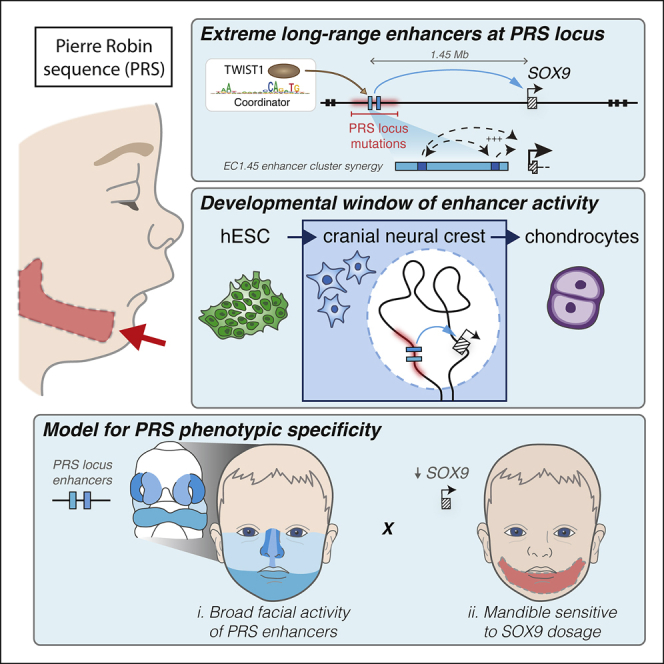
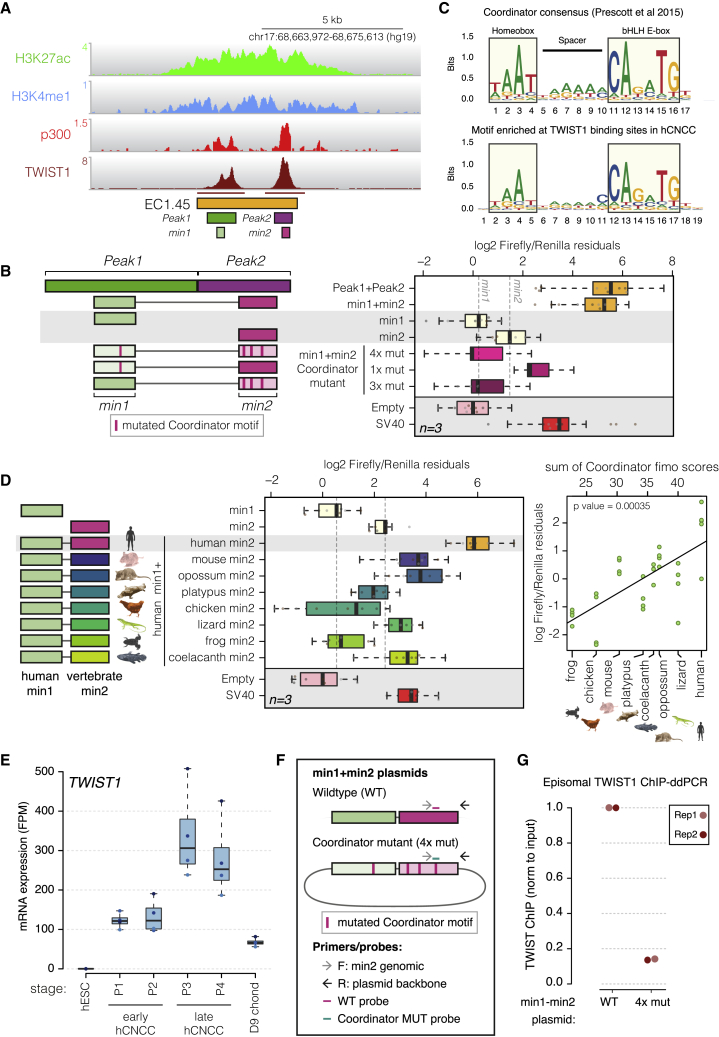
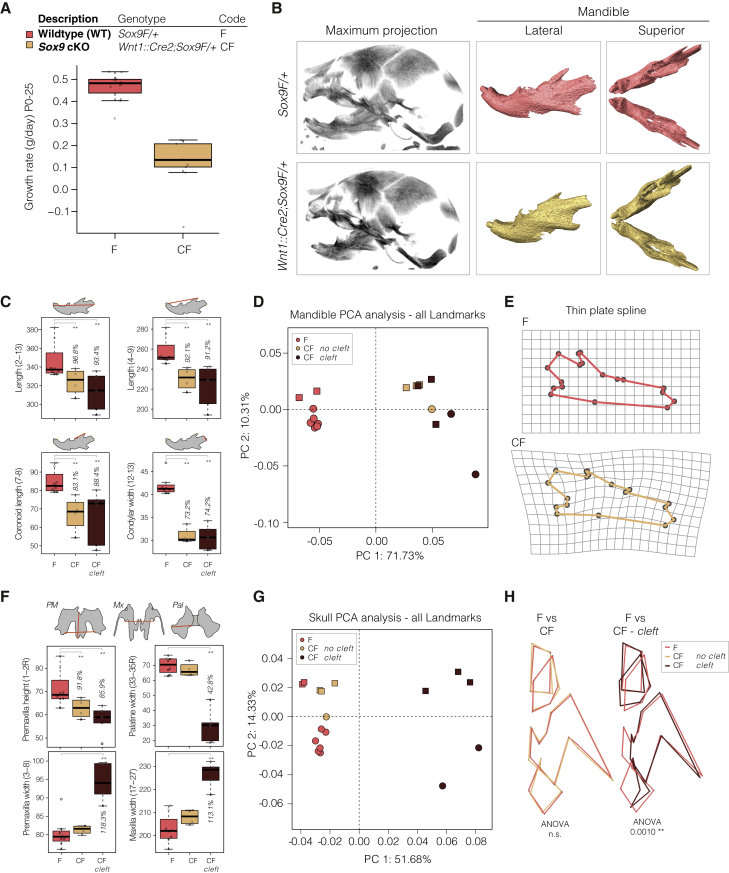
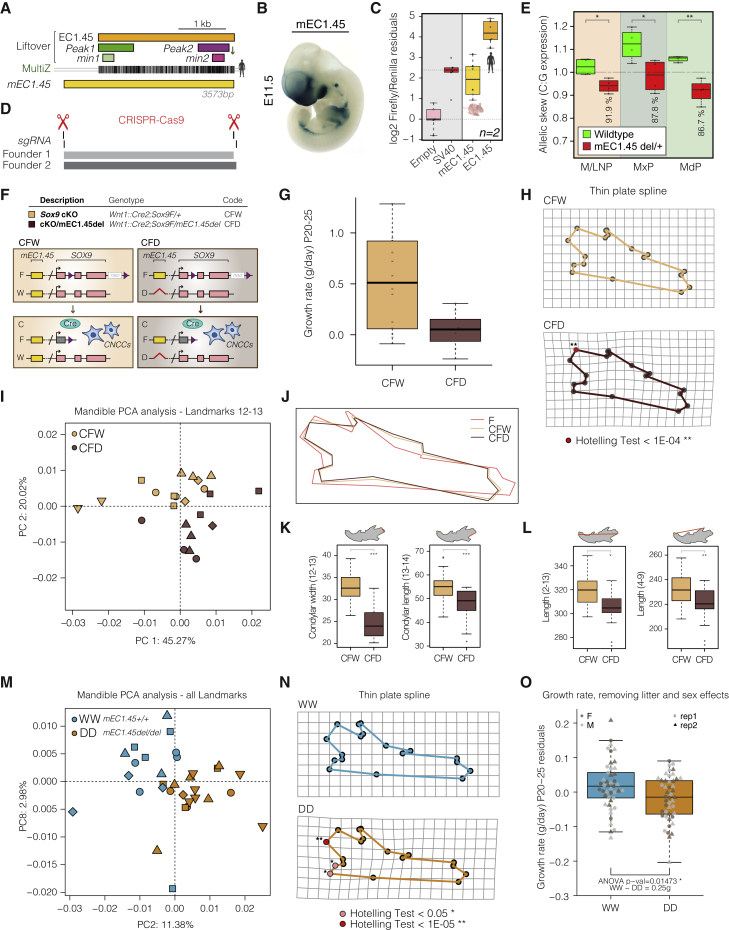
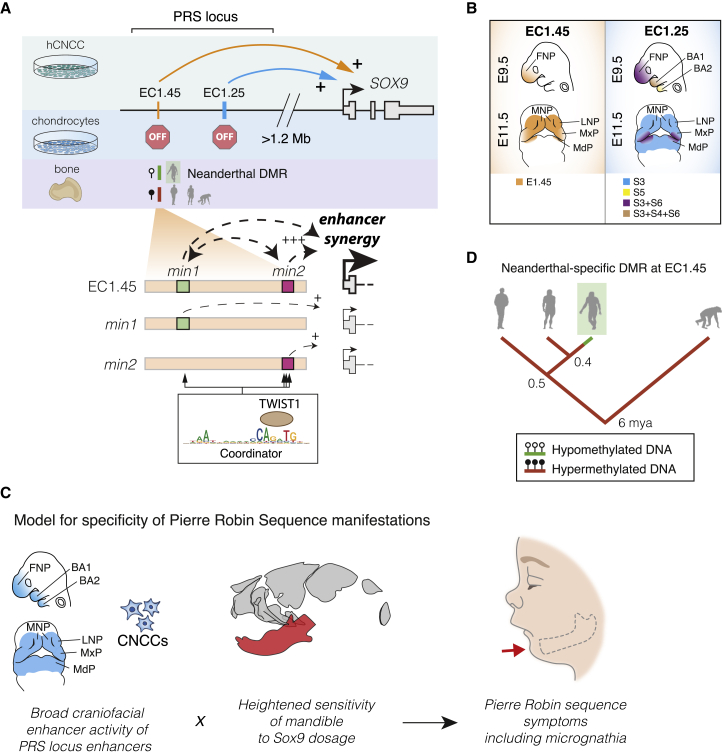
Non-coding mutations at the far end of a large gene desert surrounding the SOX9 gene result in a human craniofacial disorder called Pierre Robin sequence (PRS). Leveraging a human stem cell differentiation model, we identify two clusters of enhancers within the PRS-associated region that regulate SOX9 expression during a restricted window of facial progenitor development at distances up to 1.45 Mb. Enhancers within the 1.45 Mb cluster exhibit highly synergistic activity that is dependent on the Coordinator motif. Using mouse models, we demonstrate that PRS phenotypic specificity arises from the convergence of two mechanisms: confinement of Sox9 dosage perturbation to developing facial structures through context-specific enhancer activity and heightened sensitivity of the lower jaw to Sox9 expression reduction. Overall, we characterize the longest-range human enhancers involved in congenital malformations, directly demonstrate that PRS is an enhanceropathy, and illustrate how small changes in gene expression can lead to morphological variation.

Keywords: Pierre Robin sequence; SOX9; craniofacial; enhancer; enhanceropathy; gene dosage; long-range regulation; neural crest; non-coding mutation; transcription.


Conflict of interest statement

Declaration of Interests J.W. is a member of the CAMP4 scientific advisory board and ISSCR board of directors. J.R.H. and J.O.J.D. are founders and on the board of directors of Nucleome Theraputics.

Figures

None
Graphical abstract
Figure 1
Figure 1
Human Cranial Neural Crest-Specific Enhancers Are Associated with PRS Patient Mutations (A) ChIP-seq and ATAC-seq for hESCs (top) and P4 hCNCCs (bottom) at the human SOX9 locus. Three putative hCNCC-specific ECs overlap the PRS locus: EC1.45, EC1.35, and EC1.25. PRS patient deletions (red), translocation breakpoints (blue), topological domains (TADs) (Dixon et al., 2012), and protein-coding genes are shown. Centro, centromeric; telo, telomeric. (B) Capture-C from the SOX9 promoter (see anchor) in hESCs, neuroectodermal spheres (NECs), early (day 11) and late (P4) hCNCCs. See also Figures S1 and S2.
Figure 2
Figure 2
PRS Locus EC1.45 and EC1.25 Are Active in hCNCCs and during Mouse Craniofacial Development (A) ChIP-seq and ATAC-seq for PRS locus putative enhancer clusters EC1.45 (p300 Peak1 and Peak2), EC1.35 (S1 and S2), and EC1.25 (S3–S6). (B) Luciferase reporter assays for EC1.45, EC1.35 (S1 and S2) and EC1.25 (S3–S6) in hCNCCs (left) and hESCs (right). (C) Schematic outlining craniofacial domains at E9.5 and E11.5. BA1-2, branchial arch 1-2; FNP, frontonasal prominence; LNP, lateral nasal process; MdP, mandibular process; MNP, medial nasal process; MxP, maxillary process. (D) In situ hybridization (ISH) for Sox9 at E9.5 and E11.5. (E) Mouse LacZ reporter assay for EC1.45, EC1.35 (S1 and S2), and EC1.25 (S3–S6 tested individually) at E9.5 and E11.5. (F) HREM for an EC1.45 LacZ reporter embryo at E11.5 (frontal view, top; parasagittal section, bottom). White arrow, activity in the MdP. See also Figure S3 and Tables S1 and S2.
Figure 3
Figure 3
Heterozygous PRS Enhancer Deletion In Vitro Affects SOX9 Expression during a Restricted Window of Development (A) Overview of differentiation, including early hCNCCs at day 11, passage 1–2 early hCNCCs, passage 3–4 late hCNCCs, and chondrocytes on days 5 and 9. (B) Schematic of allele-specific RT-ddPCR, indicating primers and LNA probes (HEX/FAM) for the T/C SNP (rs74999341) in the SOX9 3′ UTR. Shown are wild-type (left) and heterozygous EC1.45 deletion (right). (C) RT-ddPCR for wild-type (green boxplot) and EC1.45 heterozygous deletion (red), plotting SOX9 C:T expression ratio. (D) ATAC-seq reveals hCNCC-specific accessibility for EC1.45. Shown are representative traces from 3–4 replicates. (E) Luciferase assay for late hCNCCs (left) and chondrocytes (right). A COL2A1 enhancer is active in both cell types, whereas EC1.45 and EC1.25 become inactive in chondrocytes. See also Figure S4 and Table S3.
Figure 4
Figure 4
Dissection of EC1.45 Enhancer Region Uncovers a Core Role of the Coordinator Motif and TWIST1 Binding in Developmental Enhancer Regulation (A) TWIST1 ChIP-seq peaks (marked under track) at EC1.45 overlap p300 Peak1 and Peak2 and minimally active sequences (min1 and min2). (B) Luciferase assay for EC1.45 min1 and min2, tested separately and combined, along with Coordinator mutant sequences. Left: schematic of the constructs. (C) Coordinator motif (top; Prescott et al., 2015) compared with the motif enriched at TWIST1 binding sites in hCNCCs (bottom). (D) Luciferase assay for the heterologous enhancer sequence for human min1 plus vertebrate min2. Left: schematic of the constructs. A scatterplot depicts the luciferase signal compared with the sum of Coordinator scores (ANOVA p = 0.00035; right). (E) TWIST1 is upregulated during hCNCC differentiation and reduced in chondrocytes (fragments per million [FPM]). (F) Schematic of plasmids, primers, and probes for ChIP-ddPCR for wild-type (WT) and Coordinator mutant (4x mut) min1+min2 plasmids. F, forward; R, reverse. (G) TWIST1 ChIP-ddPCR for P4 late hCNCCs transfected with the plasmids in (F), normalized to input, and WT adjusted to 1. Two biological replicates are depicted. See also Figure S5.
Figure 5
Figure 5
Conditional Neural Crest-Specific Sox9 Heterozygous Mutant Embryos Have Craniofacial Defects and Fail to Thrive in the Neonatal Period (A) Boxplot of postnatal growth rate in grams per day for mutant Wnt1::Cre2;Sox9F/+ (CF) and WT Sox9F/+ (F) pups (ANOVA p = 1.793e−07). (B) MicroCT scans of E18.5 WT (top) and mutant (bottom) embryos, maximum intensity projection (left), and segmented hemimandibles (right). (C) Boxplot of distance measurements for WT (F) and mutant mandibles with (CF cleft) and without (CF) cleft palate. Data are from two litters (17 embryos). Statistical test: ANOVA. (D) PCA of mandible landmarks following Procrustes analysis. Mutant (CF) and WT (F) mandibles are separated by PC1 regardless of clefting. (E) Morphometric landmarks for WT (top, F) and mutant (bottom, CF) mandibles projected onto a thin plate spline. All 18 landmarks differed significantly between WT and mutant mandibles by Hotelling test (p < 0.0006). (F) Boxplot of distance measurements for WT (F) and mutant midfacial elements with (CF cleft) and without (CF) cleft palate. PM, premaxilla; Mx, maxilla; Pal, palatine bones. Statistical test: ANOVA. (G) PCA of skull landmarks following Procrustes analysis. Mutant skulls without cleft (CF) cluster with wild-type skulls (F). (H) Wireframe outline of nasal bone, PM, Mx and Pal for half a skull for WT (F, dark pink) and mutant skulls without cleft (CF, yellow, left) or with cleft (CF cleft, brown, right). For PCA, different shape markers represent independent litters. See also Figure S6 and Table S4.
Figure 6
Figure 6
Reduction in Sox9 Activity Affects Mouse Craniofacial Development in a Dose-Dependent Manner (A) Schematic of mouse orthologous mEC1.45 with liftover of human EC1.45, Peak1, Peak2, min1, and min2 sequences and human-to-mouse MultiZ alignment. (B) Mouse LacZ reporter assay for mEC1.45 at E11.5. (C) Luciferase assay for human EC1.45 and mouse mEC1.45. (D) Location of single guide RNAs (sgRNAs) and founder 1 and 2 mEC1.45 deletions (aligned with A). (E) RT-ddPCR for Sox9 from WT and mEC1.45del/+ dissected E11.5 craniofacial tissues, plotted as C:G allelic ratio, mEC1.45 deleted on the C allele. t-test:p < 0.05, ∗∗p < 0.01. (F) Schematic of Sox9 heterozygous conditional knockout Wnt1::Cre2;Sox9F/+ (CFW) and compound heterozygous Wnt1::Cre2;Sox9F/mEC1.45del (CFD) mice with Sox9 deleted in CNCCs on one allele and mEC1.45 deleted on the other. Purple triangles, loxP sites; neo, neomycin resistance. (G) Boxplot of postnatal growth rate (P20–P25, grams per day) for CFW and CFD animals. ANOVA p = 0.01676. (H) Landmarks for CFW (top) and CFD (bottom) mandibles projected onto a thin plate spline. Landmarks that differ significantly by Hotelling test are highlighted in red (p < 1E−04). (I) PCA plot of mandible landmarks 12 and 13 following Procrustes analysis at E18.5 for 5 litters (23 embryos) of CFW (yellow) and CFD (brown) embryos. (J) Procrustes-transformed average mandible wireframes for WT (dark pink, FW), CFW (yellow), and CFD (brown) embryos. (K) Measurements of width and length of the condylar process for CFW (yellow) and CFD (brown) mandibles. For condylar width, ANOVA p = 1.52E−07. For condylar length, ANOVA p = 1.11E−04. (L) As for (K); two measurements of mandible length; 2–13, ANOVA p = 0.00143; 4–9, ANOVA p = 0.00687. (M) PCA plot of all mandible landmarks following Procrustes analysis for WT (mEC1.45+/+, blue, WW) and homozygous mutant (mEC1.45del/del, orange, DD) embryos at E18.5 for 5 litters (32 embryos). (N) Landmarks for WW and DD mandibles projected onto a thin plate spline. Landmarks that differ significantly by Hotelling test are highlighted in pink (p < 0.05) and red (p < 1E−05). (O) Boxplot of postnatal growth rate (P20–P25, g/day) for WW and DD embryos. Two replicate groups plotted as residuals of linear regression; ANOVA p = 0.01473. For PCA plots, different shape markers represent independent litters. See also Figure S7 and Tables S1 and S2.
Figure 7
Figure 7
Summary of PRS Locus Enhancer Activity with a Proposed Model for PRS Etiology and Associated Neanderthal Differentially Methylated Region (DMR) Evolution (A) A model of EC1.45 and EC1.25 hCNCC-specific regulation of SOX9 expression at extremely long distance followed by decommissioning in chondrocytes. A Neanderthal-specific hypomethylated region (HMR) overlaps EC1.45. Two minimal elements in EC1.45 have synergistic activity; i.e., (min1+min2) > (min1)+(min2). Coordinator motifs in min1 and min2 sequences are central for their activity and are bound by TWIST1. (B) EC1.45 and EC1.25 are active in the developing face. (C) A model for PRS etiology where by two features converge to confine disease phenotypes to the lower jaw. (D) Phylogenetic tree of the inferred regulatory evolution for an EC1.45 Neanderthal-specific hypomethylated region (HMR, green). From left to right: anatomically modern humans (AMHs), Denisovans, Neanderthals, and chimpanzees. mya, million years ago. See also Figure S6.

References

    1. Adams D.C., Otárola-Castillo E. Geomorph: An r package for the collection and analysis of geometric morphometric shape data. Methods Ecol. Evol. 2013;4:393–399.
    1. Akiyama H., Chaboissier M.C., Martin J.F., Schedl A., de Crombrugghe B. The transcription factor Sox9 has essential roles in successive steps of the chondrocyte differentiation pathway and is required for expression of Sox5 and Sox6. Genes Dev. 2002;16:2813–2828. - PMC - PubMed
    1. Albertson R.C., Kocher T.D. Genetic and developmental basis of cichlid trophic diversity. Heredity. 2006;97:211–221. - PubMed
    1. Amano O., Doi T., Yamada T., Sasaki A., Sakiyama K., Kanegae H., Kindaichi K. Meckel’s cartilage : Discovery, embryology and evolution -overview of the specificity of meckel’s cartilage- J. Oral Biosci. 2010;52:125–135.
    1. Amarillo I.E., Dipple K.M., Quintero-Rivera F. Familial microdeletion of 17q24.3 upstream of SOX9 is associated with isolated Pierre Robin sequence due to position effect. Am. J. Med. Genet. A. 2013;161A:1167–1172. - PubMed

Publication types

Substances