. 2020 Oct 29;183(3):666-683.e17.
doi: 10.1016/j.cell.2020.09.009. Epub 2020 Sep 28.

Translocation of Viable Gut Microbiota to Mesenteric Adipose Drives Formation of Creeping Fat in Humans

Affiliations

Translocation of Viable Gut Microbiota to Mesenteric Adipose Drives Formation of Creeping Fat in Humans

Connie W Y Ha et al. Cell. .

Abstract

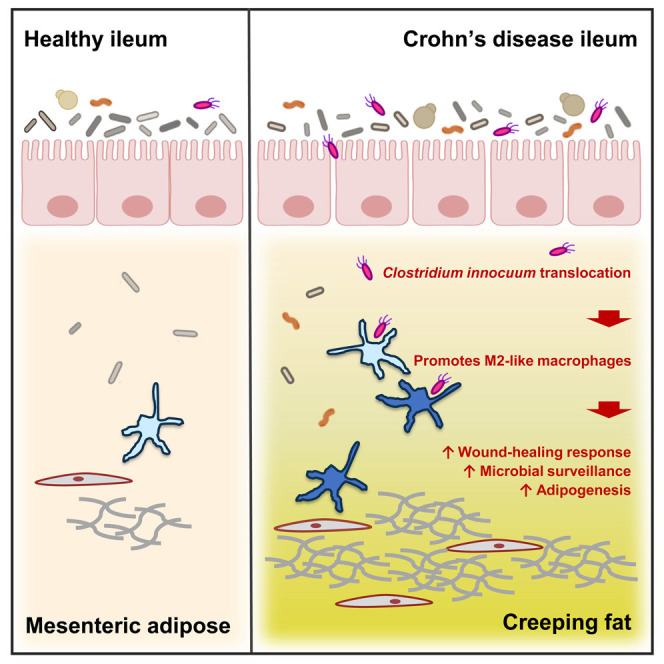
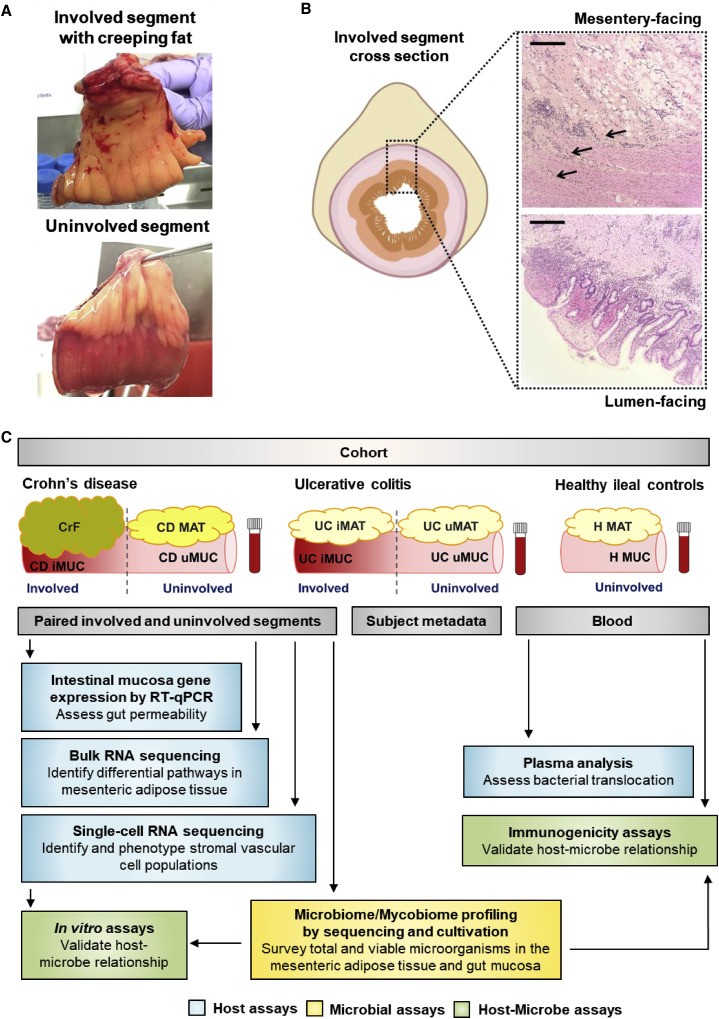
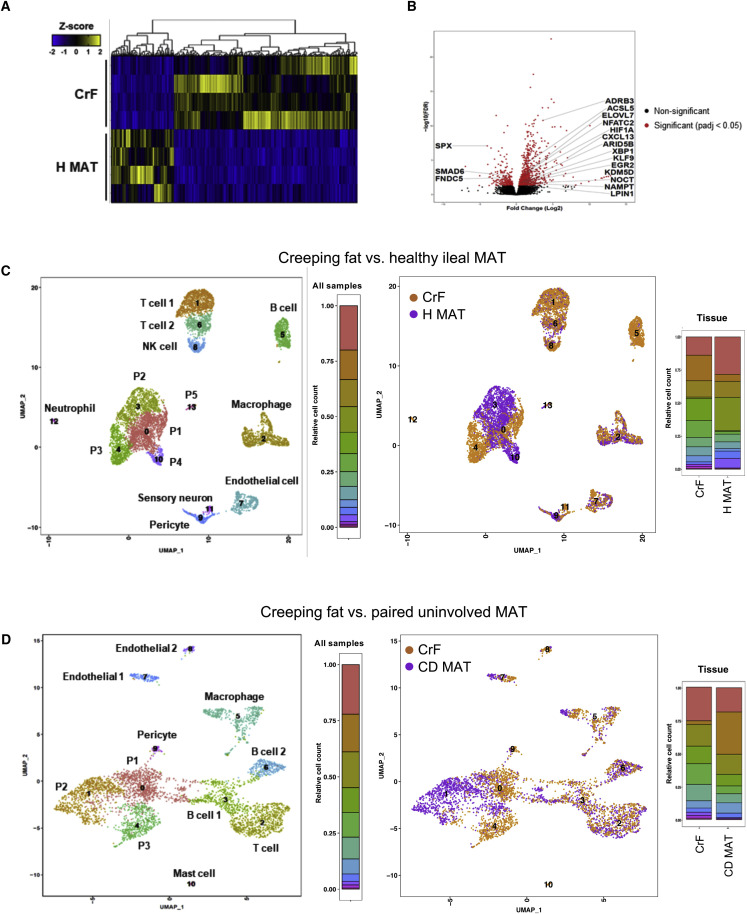
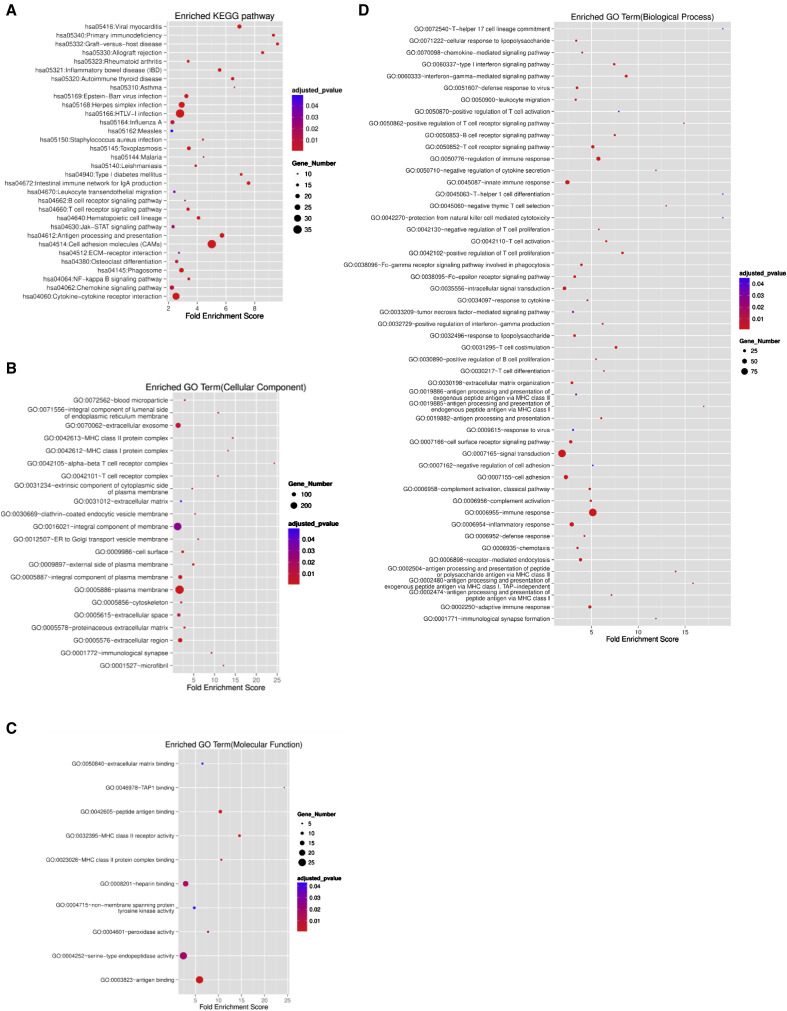
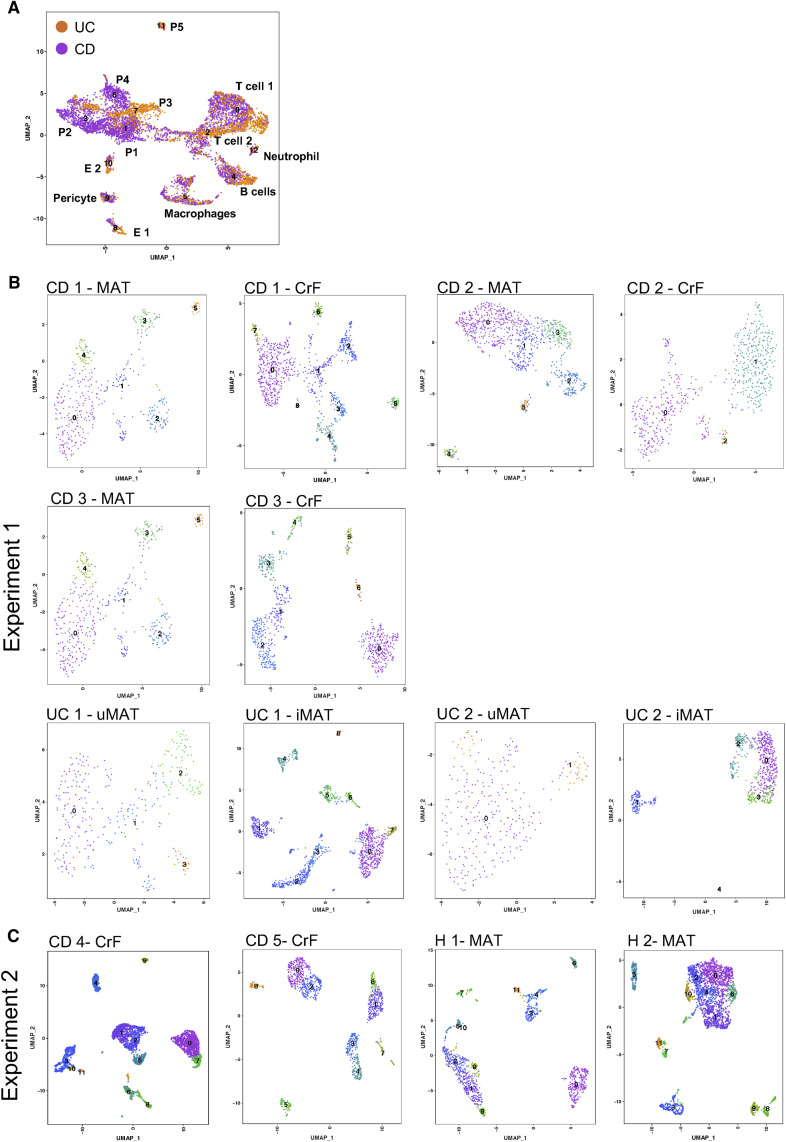
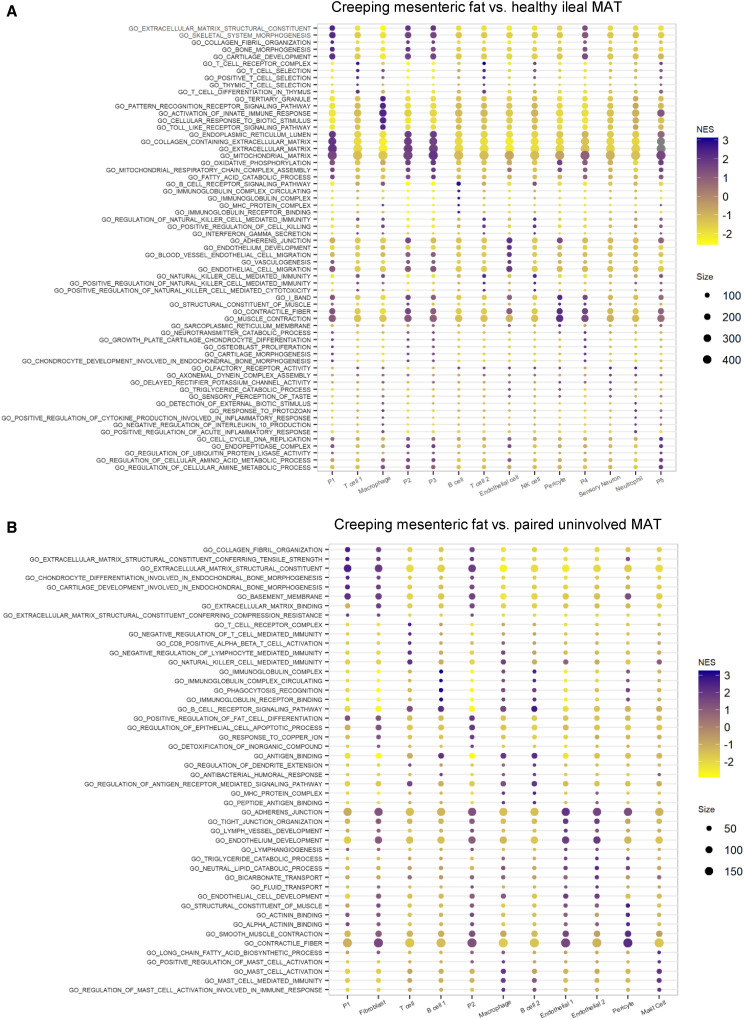
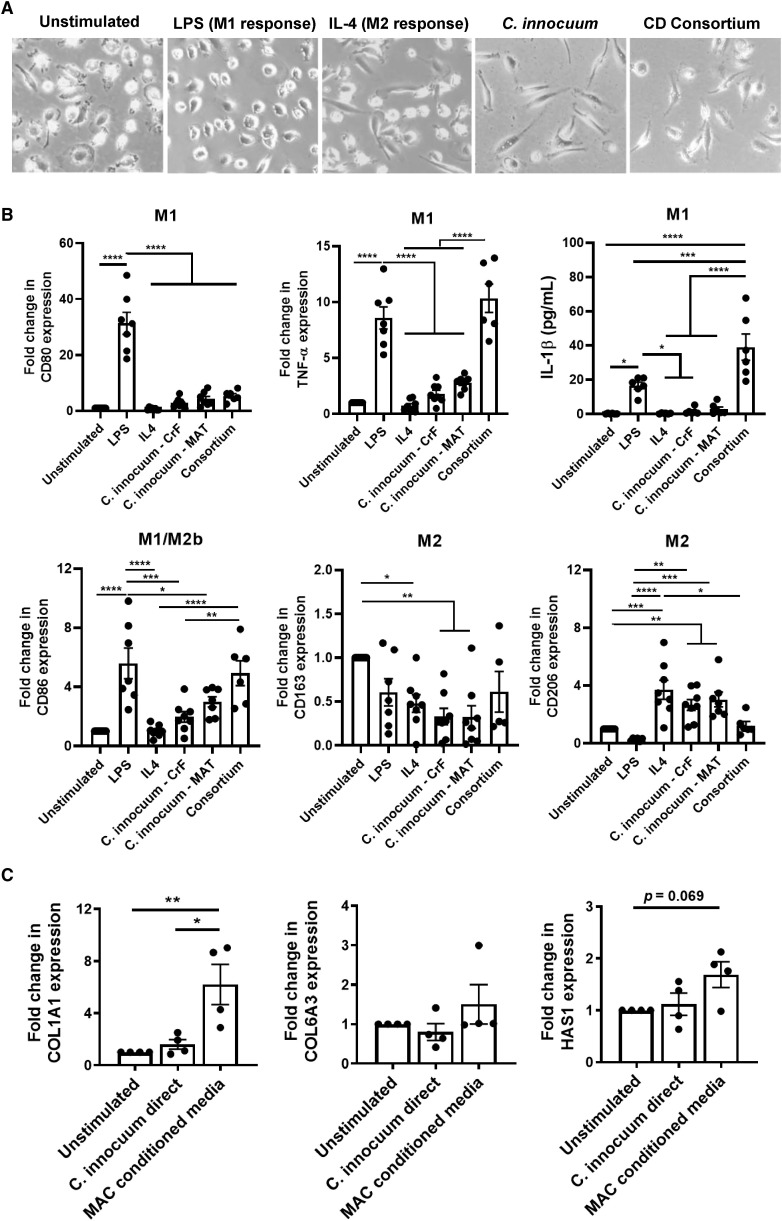
A mysterious feature of Crohn's disease (CD) is the extra-intestinal manifestation of "creeping fat" (CrF), defined as expansion of mesenteric adipose tissue around the inflamed and fibrotic intestine. In the current study, we explore whether microbial translocation in CD serves as a central cue for CrF development. We discovered a subset of mucosal-associated gut bacteria that consistently translocated and remained viable in CrF in CD ileal surgical resections, and identified Clostridium innocuum as a signature of this consortium with strain variation between mucosal and adipose isolates, suggesting preference for lipid-rich environments. Single-cell RNA sequencing characterized CrF as both pro-fibrotic and pro-adipogenic with a rich milieu of activated immune cells responding to microbial stimuli, which we confirm in gnotobiotic mice colonized with C. innocuum. Ex vivo validation of expression patterns suggests C. innocuum stimulates tissue remodeling via M2 macrophages, leading to an adipose tissue barrier that serves to prevent systemic dissemination of bacteria.

Keywords: Crohn’s disease; adipogenesis; creeping fat; fibrosis; human microbiome; ileum; inflammatory bowel diseases; macrophages; mesenteric adipose; translocation.


Conflict of interest statement

Declaration of Interests S.D. and C.W.Y.H. are inventors on US patent application #62/679,624.

Figures

None
Graphical abstract
Figure 1
Figure 1
Characterizing the Defining Features of CrF in CD (A) Representative adjacent paired involved and uninvolved intestinal segments from a CD patient. (B) H&E stained CrF at the intestinal interface (top) and mucosa (bottom) from the same CD specimen. Arrows point to fibrotic adipose interleaved with ileal muscularis. Scale bar, 500 μm. (C) Schematic of experimental design.
Figure S1
Figure S1
Diversity Analyses of the Metagenomes in Mesenteric Adipose Tissue and Ileal Mucosa in CrF and Healthy MAT Controls, Related to Figure 2 Relative abundance of bacterial phyla across tissue sites. H MAT has one less sample than the other groups because no bacterial DNA could be recovered from this sample.
Figure 2
Figure 2
MAT Harbors a Diverse Microbiome of Gut Origin (A) SourceTracker2 prediction of MAT bacterial origin compared against samples from the HMP. (B) Alpha diversity from metagenomic sequencing comparing CD and H (left); the following paired tissues: CrF and iMUC (middle-left), CD MAT and CD uMUC (middle-right), and H MAT and H Muc (far right). (C) Pathway analysis using Songbird multinomial regression of the total CD versus H microbiome. Positive values indicate association with CD. (D) 16S rRNA-based amplicon sequence variants (ASVs) of the MAT and MUC microbiota in CD and UC. (E) 16S rRNA-based phylogenetic tree of bacterial taxa observed in CD and UC resections. Vertical alignment of a dot represents co-occurrence of taxon across multiple sampling sites. (F) ITS-based ASVs of the MAT and MUC mycobiota in CD and UC. (G) Relative abundances of dominant fungal signals in CD and UC MAT and MUC. Error bars ± SEM. Kruskal-Wallis test (A). Two-sided Mann-Whitney U test (B, far left). Paired Wilcoxon signed rank test (B, middle-left to far right). One-way ANOVA with Tukey’s test for multiple comparisons (D, F, and G). Statistical significance (p < 0.05) is represented by different letters on each bar. See also Figures S1 and S2 and Tables S2 and S3.
Figure S2
Figure S2
16S rRNA and ITS Taxonomic Profiles of Mesenteric Adipose Tissue and Intestinal Mucosa in CD and UC, Related to Figure 2 (A) PCoA of Bray-Curtis distance of MAT- and MUC-associated microbiota in different subtypes of IBD. Specimens from involved (i) and uninvolved (u) resections are separated for analysis. (B) Relative abundance of bacterial phyla (Left) and families within the Firmicutes phylum (Right) in involved and uninvolved specimens. (C) Principal coordinate analysis of Bray-Curtis distance of MAT- and MUC-associated mycobiota from CD and UC resections.
Figure 3
Figure 3
CD MAT Has a Distinct Cultivable Microbiota Dominated by Clostridium innocuum (A) Key cultivable organisms recovered from CD, UC, and H MAT. Bacteria found in more than one specimen are shown. Each column represents the cultivable community for an individual patient. Organisms recovered solely from CD, UC, or H are shaded black. (B) Venn diagram denoting number of unique bacterial species identified by 16S rRNA sequencing and by cultivation methods. (C) Compositionally coherent log-ratio t tests of metagenomic sequences from the five bacteria exclusively cultivated in CD samples (C. innocuum, E. ramosum, P. distasonis, C. symbiosum, and B. pseudolongum; Figure 3A) to an H-MAT-exclusive bacteria, P. merdae, identified by Songbird multinomial regression. (D) Whole genome sequencing comparison of C. innocuum isolates recovered from CD CrF (n = 11), CD MAT (n = 6), CD mucosa (n = 8), and UC mucosa (n = 5), as well as a reference genome, C. innocuum 2959 and type strain DSM1286. Disease and tissue distribution of samples are coded on the right. (E) Differentially abundant KEGG pathways across C. innocuum isolates. R = reference strains. (F) Functional phenotyping of C. innocuum isolates by Biolog in vitro substrate utilization assay. Growth of each isolate was screened against 95 different substrates as the sole nutrient source. R = DSM1286 type strain. Student’s t tests were performed for (C) given a priori knowledge of CD and H-MAT-associated bacteria. Kruskal-Wallis test was performed for (E). See also Figure S3 and Tables S4 and S5.
Figure S3
Figure S3
C. innocuum Functional Motility Assay and Intestinal Barrier Gene Expression, Related to Figure 3 and 4 (A) Motility test of C. innocuum in pre-reduced brain-heart infusion media with 0.3% agar. Motility is designated by growth deviated from the center stab line after 48 h. Non-motile bacteria, Staphylococcus aureus, is included here as negative control. (B) Biolog assay from Figure 3F with CD CrF and CD MAT isolates grouped by patient source. Number indicates patient ID. For patients with multiple C. innocuum isolates, left-handed column refers to the CrF-derived isolate and the remaining columns for MAT-derived isolates. (C) qRT-PCR of gut barrier genes comparing involved CD and UC specimens relative to their paired uninvolved specimen. Data below the dotted line represents downregulation of target genes in the involved segment compared to paired uninvolved segment. Data below the dotted line represents reduced expression of target genes in the involved UC tissues when compared to involved CD tissues (Right). (n = 10 for CD; n = 8 for UC). Error bars ± SEM. Multiple t tests with FDR correction; ∗∗p < 0.01.
Figure 4
Figure 4
C. innocuum Translocation Promotes MAT Expansion and Attenuated Systemic Dissemination of Bacterial LPS (A) Gut barrier gene expression measured by qRT-PCR in CD, UC, and H MUC. Data below the dotted line represent downregulation of target genes compared to H MUC (H MUC, n = 4; CD, n = 10; UC, n = 8). (B) Plasma LBP and soluble CD14 from the same CD and UC as in (A). Healthy samples are a combination of H patients in (A) (open symbols) and ten additional healthy blood donors (H, n = 14; CD, n = 14; UC, n = 11). (C) Representative images of ileal-mesenteric region in ASF gnotobiotic mice gavaged with the following: PBS (left), live C. innocuum (middle), and live C. innocuum + DSS (right). Black arrow points to the MAT. (D) Gnotobiotic mice body weight change compared to baseline. Untreated, n = 3; C. innocuum alone, n = 2; C. innocuum + DSS, n = 2. (E) Colon lengths. (F) Translocated bacteria recovered from MAT of mice from (C). Arrows indicate distinct bacterial species (representative isolates; yellow, ASF; blue, C. innocuum). (G) qRT-PCR of adipogenesis and ECM markers in gnotobiotic MAT. (H) Endpoint plasma LBP in gnotobiotic mice. Error bars ± SEM. One-way ANOVA with Tukey’s multiple comparison test. p < 0.05; ∗∗p < 0.01; ∗∗∗p < 0.001; ∗∗∗∗p < 0.0001; #p < 0.05 compared to untreated and C. innocuum + DSS; +p < 0.05 compared to untreated. See also Figure S3.
Figure 5
Figure 5
Single-Cell and Bulk RNA Sequencing of MAT from CD, UC, and H Reveals a Distinct Cellular Profile in CrF (A) Bulk-RNA-sequencing-generated heatmap of differentially expressed genes (DEGs) in CrF versus H MAT. Genes with adjusted p value < 0.05 are shown. (B) Fold change in expression level for a given gene in CrF versus H MAT, with adipose differentiation genes highlighted. Significant DEGs with adjusted p value < 0.05 are colored red. (C) scRNA-seq-generated UMAP plots of CrF and H MAT distinguishing individual cell clusters (left) and tissue source (right). Frequency of cell types indicated by colored bars. (D) scRNA-seq-generated UMAP plots of CrF and paired CD MAT distinguishing individual cell clusters (left) and tissue source (right). Frequency of cell types indicated by colored bars. See also Figures S4 and Figure 1, Figure 2, Figure 3, Figure 4, Figure 5, Figure 6, Figure 7, Figure S1, Figure S2, Figure S3, Figure S4, Figure S5and Tables S6 and S7.
Figure S4
Figure S4
Enriched Functions Determined by Bulk RNA Sequencing in Creeping Fat Compared to Healthy Mesenteric Adipose Tissue, Related to Figure 5 Significant functions that were upregulated in CrF compared to H: (A) KEGG pathways (B) Cellular components (C) Molecular functions (D) Biological processes Categories with adjusted p value < 0.05 are shown. Size of the symbol represents the number of differentially expressed genes in creeping fat binned into a specific function. CD: n = 4; Healthy ileal controls: n = 4.
Figure S5
Figure S5
UMAP Plots from scRNA-Seq for Ulcerative Colitis Tissues and for Each Individual Patient, Related to Figure 5 (A) Total cell clusters from UC involved MAT and uninvolved MAT (left), and colored by tissue source (involved or uninvolved). n = 2 UC patients. (B) Individual plots for each patient included in experiment 1 comparing CD to UC adipose tissues. (C) Individual plots for each patient included in experiment 2 comparing CD creeping fat to healthy tissue controls.
Figure 6
Figure 6
Upregulated ECM and Anti-MMicrobial-Related Pathways Are Dominant Cellular Phenotypes of CrF (A) GSEA of pathways differentially expressed in CrF compared to H MAT. Top five significant pathways for each cell cluster are listed on the y axis. (B) GSEA of pathways differentially expressed in CrF compared to adjacent CD MAT. NES = normalized enrichment score. Size = size of the gene set for each pathway listed.
Figure 7
Figure 7
C. innocuum Promotes M2 Macrophage Polarization and Wound-Healing Response in Progenitor Cells In Vitro (A) Representative images of PBMC-derived macrophages after 24 h exposure to LPS, IL-4, C. innocuum lysates alone, and lysates from the consortium of CD-associated organisms including C. innocuum. (B) Immunogenicity assay determining polarization of PBMC-derived macrophages upon exposure to C. innocuum lysates sourced from either CrF or CD MAT (strain CD-CrF B and CD-MAT C from Figure 3D) or a consortium of CD-associated organisms without C. innocuum. (C) Co-culture of CrF-derived progenitor cells with C. innocuum lysate directly, or with conditioned media from macrophages exposed to C. innocuum lysates from (B). Gene expression was measured by qRT-PCR. Error bars ± SEM. One-way ANOVA with Tukey’s multiple comparison test (D); p < 0.05, ∗∗p < 0.01, ∗∗∗p < 0.001; ∗∗∗∗p < 0.0001.

Comment in

References

    1. Amar J., Chabo C., Waget A., Klopp P., Vachoux C., Bermúdez-Humarán L.G., Smirnova N., Bergé M., Sulpice T., Lahtinen S. Intestinal mucosal adherence and translocation of commensal bacteria at the early onset of type 2 diabetes: molecular mechanisms and probiotic treatment. EMBO Mol. Med. 2011;3:559–572. - PMC - PubMed
    1. Anderson M. A new method for non-parametric multivariate analysis of variance. Austral Ecol. 2001;26:32–46.
    1. Bankevich A., Nurk S., Antipov D., Gurevich A.A., Dvorkin M., Kulikov A.S., Lesin V.M., Nikolenko S.I., Pham S., Prjibelski A.D. SPAdes: a new genome assembly algorithm and its applications to single-cell sequencing. J. Comput. Biol. 2012;19:455–477. - PMC - PubMed
    1. Bao J., Pan G., Poncz M., Wei J., Ran M., Zhou Z. Serpin functions in host-pathogen interactions. PeerJ. 2018;6:e4557. - PMC - PubMed
    1. Baym M., Kryazhimskiy S., Lieberman T.D., Chung H., Desai M.M., Kishony R. Inexpensive multiplexed library preparation for megabase-sized genomes. PLoS ONE. 2015;10:e0128036. - PMC - PubMed

Publication types

MeSH terms