. 2020 Nov 12;183(4):982-995.e14.
doi: 10.1016/j.cell.2020.09.034. Epub 2020 Sep 14.

Mapping Systemic Inflammation and Antibody Responses in Multisystem Inflammatory Syndrome in Children (MIS-C)

Affiliations

Mapping Systemic Inflammation and Antibody Responses in Multisystem Inflammatory Syndrome in Children (MIS-C)

Conor N Gruber et al. Cell. .

Erratum in

  • Mapping Systemic Inflammation and Antibody Responses in Multisystem Inflammatory Syndrome in Children (MIS-C).
    Gruber CN, Patel RS, Trachtman R, Lepow L, Amanat F, Krammer F, Wilson KM, Onel K, Geanon D, Tuballes K, Patel M, Mouskas K, O'Donnell T, Merritt E, Simons NW, Barcessat V, Del Valle DM, Udondem S, Kang G, Agashe C, Karekar N, Grabowska J, Nie K, Le Berichel J, Xie H, Beckmann N, Gangadharan S, Ofori-Amanfo G, Laserson U, Rahman A, Kim-Schulze S, Charney AW, Gnjatic S, Gelb BD, Merad M, Bogunovic D. Gruber CN, et al. Cell. 2023 Jul 20;186(15):3325. doi: 10.1016/j.cell.2023.06.012. Cell. 2023. PMID: 37478820 Free PMC article. No abstract available.

Abstract

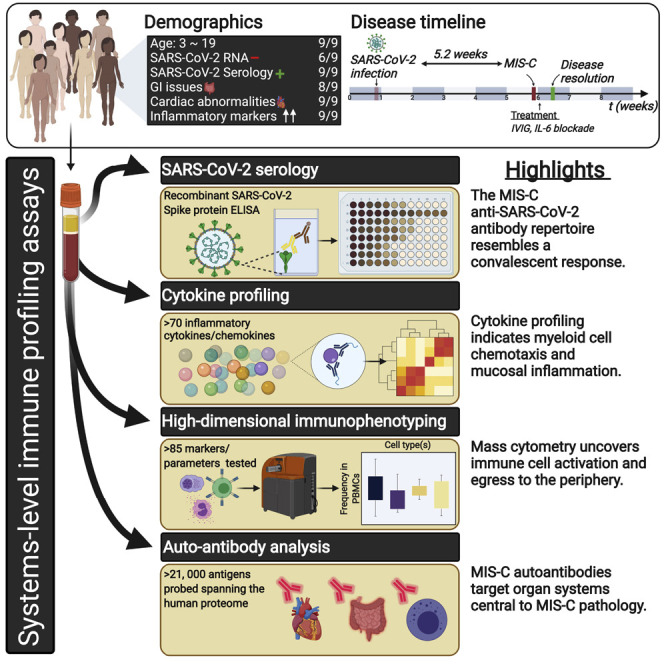
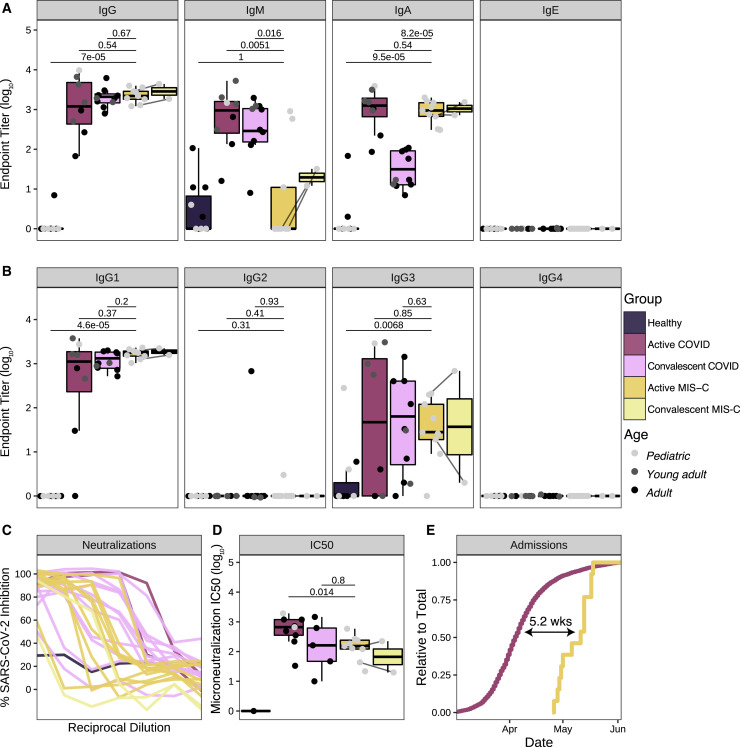
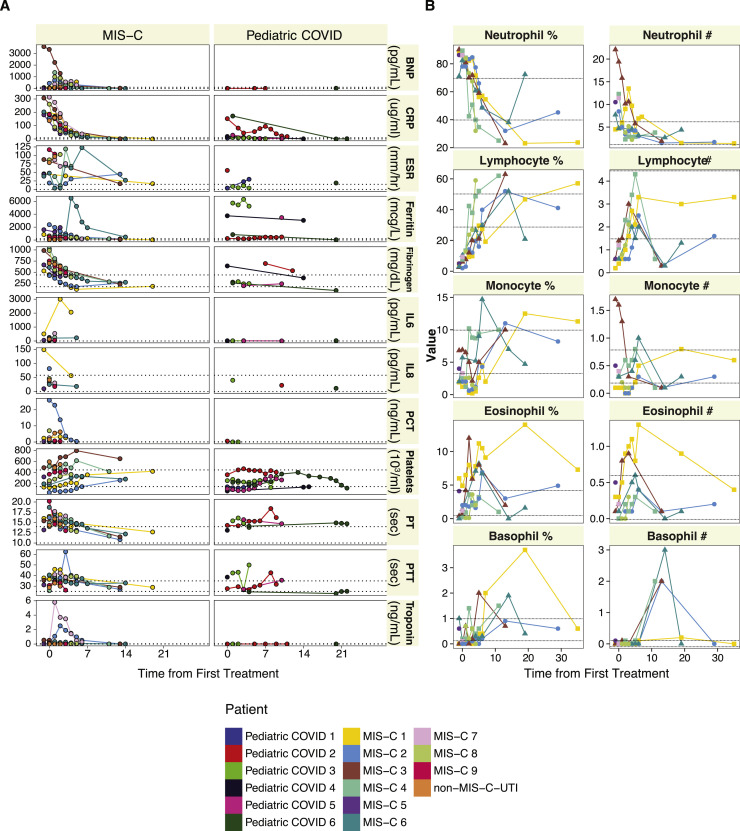
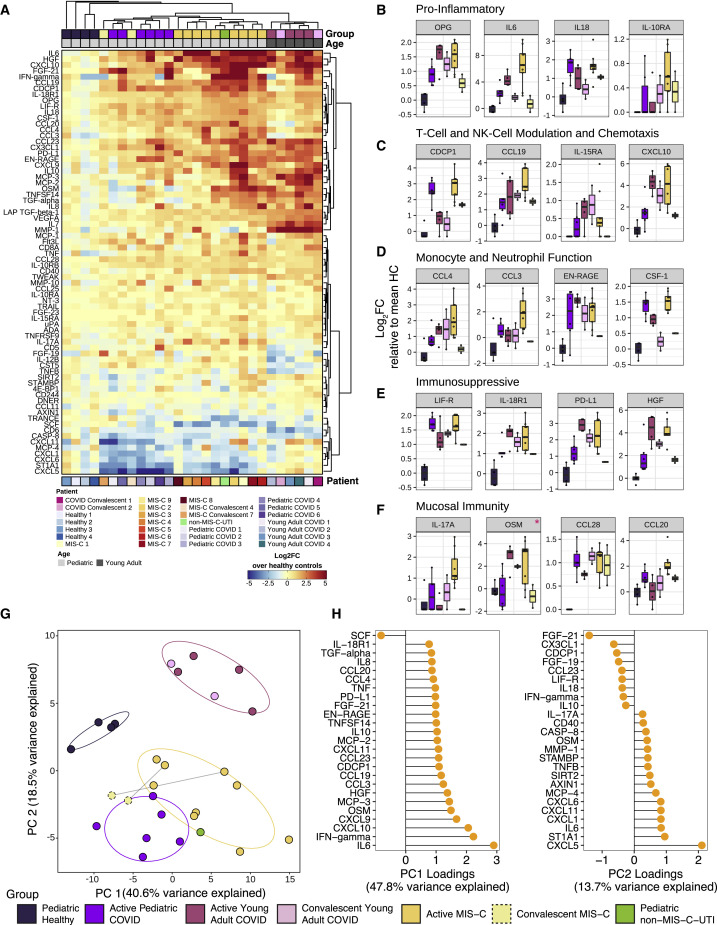
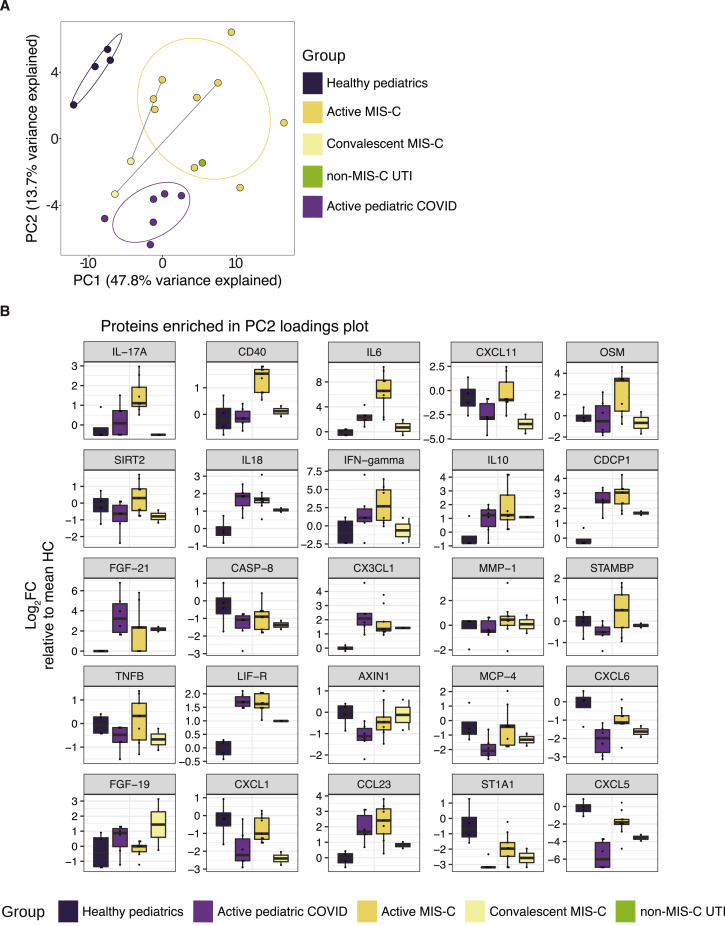
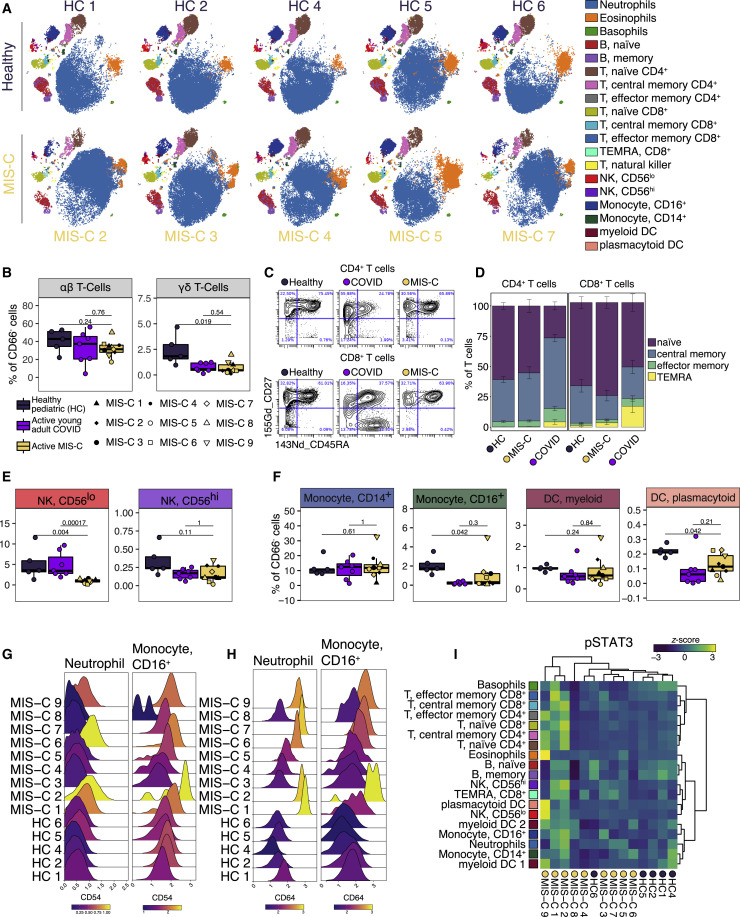
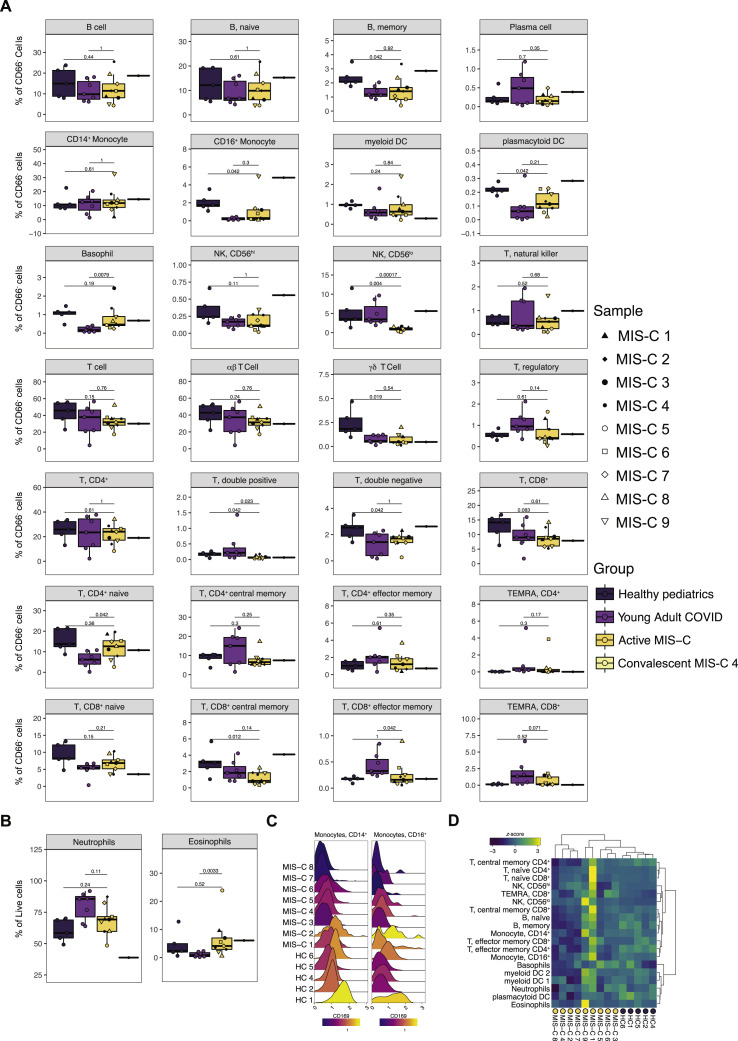
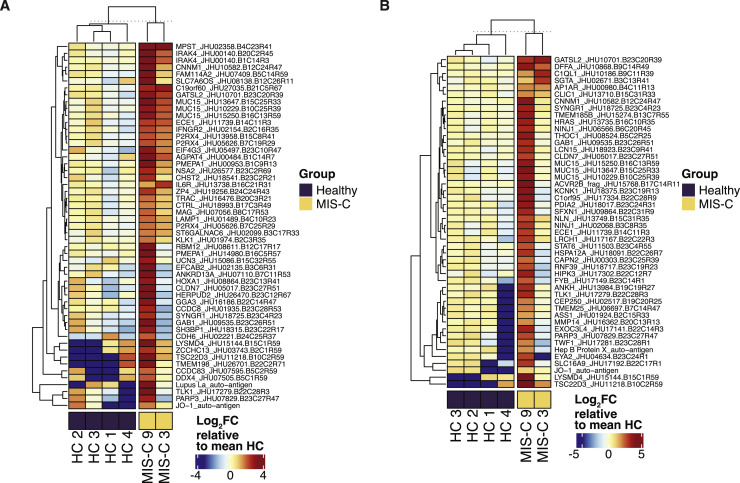
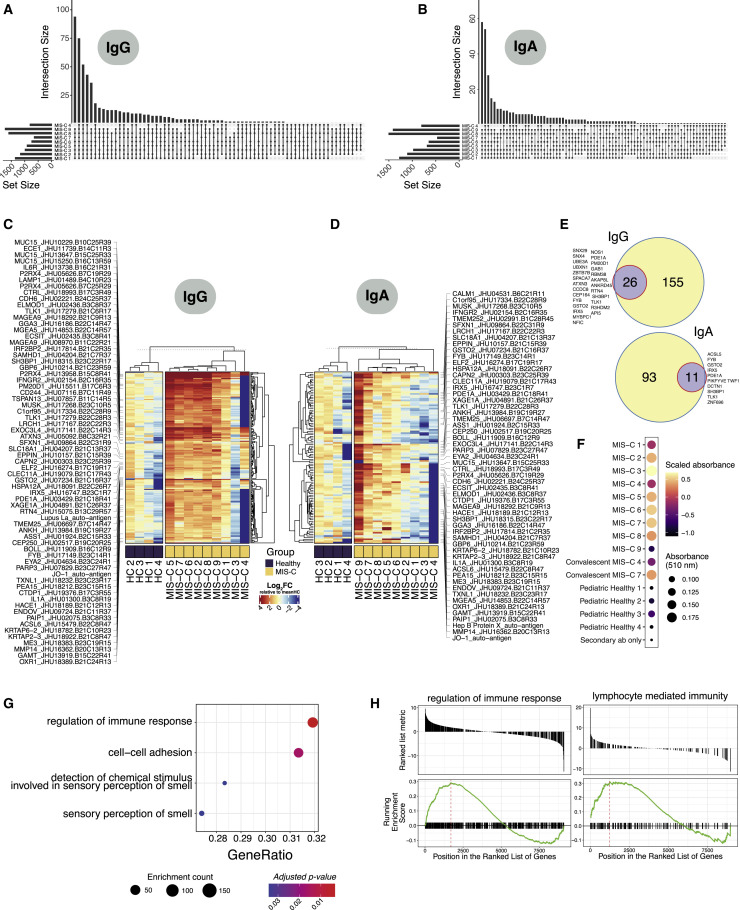
Initially, children were thought to be spared from disease caused by severe acute respiratory syndrome coronavirus 2 (SARS-CoV-2). However, a month into the epidemic, a novel multisystem inflammatory syndrome in children (MIS-C) emerged. Herein, we report on the immune profiles of nine MIS-C cases. All MIS-C patients had evidence of prior SARS-CoV-2 exposure, mounting an antibody response with intact neutralization capability. Cytokine profiling identified elevated signatures of inflammation (IL-18 and IL-6), lymphocytic and myeloid chemotaxis and activation (CCL3, CCL4, and CDCP1), and mucosal immune dysregulation (IL-17A, CCL20, and CCL28). Immunophenotyping of peripheral blood revealed reductions of non-classical monocytes, and subsets of NK and T lymphocytes, suggesting extravasation to affected tissues. Finally, profiling the autoantigen reactivity of MIS-C plasma revealed both known disease-associated autoantibodies (anti-La) and novel candidates that recognize endothelial, gastrointestinal, and immune-cell antigens. All patients were treated with anti-IL-6R antibody and/or IVIG, which led to rapid disease resolution.

Keywords: COVID-19; Kawasaki-like; MIS-C; PIMS; SARS-CoV-2; autoimmunity; dysfunction; immune; pediatrics.


Conflict of interest statement

Declaration of Interests DB reports ownership in Lab11 Therapeutics. S. Gnjatic reports consultancy and/or advisory roles for Merck, Neon Therapeutics and OncoMed and research funding from Bristol-Myers Squibb, Genentech, Immune Design, Agenus, Janssen R&D, Pfizer, Takeda, and Regeneron.

Figures

None
Graphical abstract
Figure S1
Figure S1
Chest X-Ray Images from Three MIS-C Patients and Patient Clinical Timelines, Related to Table 1 (A) MIS-C 1: Reactive airway disease with no evidence of pneumonia or atelectasis. (B) MIS-C 3: Cardiomegaly, retrocardiac opacity, and bilateral pleural effusion. (C) MIS-C 5: Mild bilateral, right greater than left, patchy and hazy pulmonary opacities in a basilar distribution. (D) Disease and treatment timeline for the MIS-C patients (N=9), pediatric COVID patients (N=6) and non-MIS-C UTI patient (N=1). Shaded regions represent complete sampling period (inclusive for hospital admission and discharge) for respective patients. Plot shading (beige) correspond to biweekly intervals.
Figure 1
Figure 1
Anti-SARS-CoV-2 Humoral Response in MIS-C Patients (A) Antibody endpoint titers against SARS-CoV-2 S protein in plasma from healthy patients (pediatric: N=4, adults: N=7), patients hospitalized for active COVID-19 (pediatric: N=1, young adult: N=4; adult: N=3), convalescent COVID-19 patients (young adult: N=2, adult: N=6), active MIS-C patients (N=9), and convalescent (recovered) MIS-C patients (N=2; MIS-C 4 and MIS-C 7). Pediatric, young adult, and adult patients are colored in light gray, dark gray, and black, respectively. (B) Corresponding antibody endpoint titers for IgG subtypes. (C) Neutralization of SARS-CoV-2 in Vero E6 cells by plasma from healthy donors (N=1), patients hospitalized for active COVID-19 (N=2), convalescent COVID-19 individuals (N=12), MIS-C patients (N=9), and convalescent (recovered) MIS-C patients (N=2). (D) Microneutralization IC50 values for reported neutralization curves across the full dataset. (E) Hospital admissions for COVID-19 and MIS-C, expressed as a relative proportion of total cases, respectively. Time indicates the delay between COVID-19 and MIS-C in the date of 50% total caseload. Statistical significance between healthy controls vs. active MIS-C, active COVID-19 vs active MIS-C or convalescent COVID-19 versus active MIS-C were assessed with the Wilcoxon ranked sum test and corrected for multiple testing (Benjamini-Hochberg method). Upper and lower hinges of boxplots correspond to 25th and 75th percentiles and whiskers extend 1.5× interquartile range (IQR) from the hinges. See also Table S2.
Figure S2
Figure S2
Longitudonal Assessment of Laboratory Markers and Cellular Frequencies, Related to Tables 1 and S2 (A) Longitudinal assessment of standard laboratory markers show differences in inflammation between MIS-C (N=9), pediatric COVID patients (N=6) and non-MIS-C UTI patient (N=1). Sampling times were taken throughout the course of hospitalization or treatment. Reference ranges for individual clinical labs are depicted as dotted lines. (B) Longitudinal assessment of complete blood count values in MIS-C (N=9) patients. Sampling times were taken throughout the course of hospitalization or treatment. Reference ranges for individual clinical labs are depicted as dotted lines.
Figure 2
Figure 2
Cytokine profiling indicates myeloid cell chemotaxis and mucosal inflammation. Cytokine profiling of plasma from MIS-C patients (N = 9), pediatric COVID-19 patients (N = 6), active young adult COVID-19 patients (N = 4), convalescent young adult COVID-19 (N = 2), age matched healthy pediatric controls (N = 4), and convalescent (recovered) MIS-C patients (N = 2). (A) Multiplex cytokine analysis by Olink ELISA, expressed as log2FC over the mean healthy controls per cytokine. Unsupervised clustering of samples and cytokines was done using the Ward’s method (distance metric: pearson). Top and bottom bar annotations correspond to relevant patient demographic and/or clinical information. (B–F) Cytokines related to (B) inflammation, (C) T-cell and NK-cell modulation and chemotaxis, (D) monocyte and neutrophil function, (E) immunosuppression, and (F) mucosal immunity reaching statistical significance when MIS-C samples are compared against age-matched healthy controls. Red asterisks indicate cytokines that failed to pass significance when adjusted for multiple testing (Wilcoxon rank sum test; Benjamini-Hochberg method). y axis corresponds to log2FC to the mean healthy controls. Hypothesis testing was executed by the non-parametric Wilcoxon ranked sum test. Upper and lower hinges of boxplots correspond to 25th and 75th percentiles and whiskers extend 1.5× interquartile range (IQR) from the hinges. (G) Principal component analysis of subjects at the first time point sampled. Points are colored by sample group classification. Ellipses reflect a 68% confidence interval around the colored group centroid. (H) Component loadings (PC1 and PC2) of PCA analysis on pediatric samples describing cytokine expression differences between healthy and diseased children (PC1) and between MIS-C and pediatric COVID-19 (PC2). See also Figure S3 and Table S2.
Figure S3
Figure S3
High-Throughput Cytokine Analysis of Pediatric Patient Samples, Related to Figure 2 (A) Principal component analysis of pediatric cases only. Points are colored by sample group classification. Ellipses reflect a 68% confidence interval around the colored group centroid. (B) Boxplots of proteins contributing most to PC2 loading plots, distinguishing MIS-C patients from pediatric COVID patients. All boxplots represent the median and interquartile range with error bars for the 95% confidence interval.
Figure 3
Figure 3
Immunophenotyping of MIS-C Patient Peripheral Blood by Mass Cytometry (A) Representative t-SNE plots illustrating the immune cell distribution in whole blood from age-matched healthy controls (N=5) and MIS-C patients (5 shown; N=9 total). (B) T cell subset frequencies expressed as percent of CD66- cells (non-granulocytes) from age-matched healthy controls (N=5), acute COVID-19 infection in young adults (N=7), and MIS-C patients (N=9). (C) Representative scatterplots for naïve, central memory, effector memory, and T effector memory re-expressing CD45RA (TEMRA) cells in a representative healthy donor, MIS-C patient, and an acute young adult COVID-19 patient. (D) Quantification of T cell subsets across samples. (E) NK cell subsets quantified as percent of CD66 cells. (F) Monocyte and dendritic cell sub-population frequencies quantified as percent of CD66 cells. (G and H) CD54 (G) and CD64 (H) expression in neutrophil and CD16+ monocyte subsets, color-coded by the mean log10 transformed signal intensity. (I) STAT3 phosphorylation across immune cell subtypes for all MIS-C patients and healthy controls. Heatmap is colored as Z scored scaled expression. Unsupervised clustering of patient samples and cell types was done using the Ward’s method (distance metric: canberra). All boxplots represent the median and interquartile range with error bars spanning 1.5× interquartile range. Statistical significance between healthy pediatrics and active MIS-C or active MIS-C and acute young adult COVID-19 were assessed with the Wilcoxon ranked sum test and corrected for multiple testing (Benjamini-Hochberg method). See also Figure S4.
Figure S4
Figure S4
Mass Cytometry of Peripheral Blood Immune Cells, Related to Figure 3 (A) Immune cell frequencies of all immunophenotypes cell types from age-matched healthy controls (n=5), acute COVID-19 infection in young adults (n=7), active MIS-C patients (n=9) and one convalescent MIS-C patient (MIS-C 4; represented as a single data point). (B). Granulocyte frequencies as a percentage of live cells. (C). Expression of CD169, an interferon-stimulated gene, in monocytes in pediatric healthy controls (N=4) and MIS-C patients (N=8; data unavailable for MIS-C 9). (E) Relative STAT1 phosphorylation.
Figure S5
Figure S5
Autoantibody Analysis of IVIG Treatment Naïve MIS-C Samples, Related to Figure 4 (A) Heatmap of enriched IgG autoantigens found enriched at least four-fold in both IVIG treatment naïve patients (MIS-C 3, MIS-C 9) versus age-matched healthy pediatric controls (N=4). Color intensity corresponds to the log2FC expression value relative to the mean of healthy pediatric controls (N=4). (B) Corresponding heatmaps for IgA.
Figure 4
Figure 4
Autoantibody Detection Unveils an Autoreactive Repertoire Enriched in MIS-C Patients (A) Upset plots delineating the number of shared autoantibodies between MIS-C patients, which were at least two-fold enriched when compared with controls for IgG autoantigens in HuProt protein microarray analysis. Upset plots were anchored on autoantibodies that were present in at least one IVIG-treatment-naïve sample (MIS-C 3 and MIS-C 9). Only intersections of 6 or more patients are visualized. (B) Corresponding upset plots for IgA autoantigens. (C) Heatmap of all IgG autoantigens with at least 4-fold enrichment in MIS-C compared to controls, in addition to the selection criteria above. Color intensity corresponds to the log2FC expression value relative to the mean of healthy pediatric controls (N=4). Flagged autoantigens were enriched in 5 patients and at least one treatment naive IVIG (MIS-C 3 or MIS-C 9) sample. (D) Corresponding heatmap for IgA autoantigens. (E) Top: validation of protein microarray hits identified by phage immunoprecipitation sequencing (PhIP-seq) for IgG autoantigens. The purple circle and corresponding number indicate the number of autoantigens enriched in the HuProt protein microarray that were also validated by PhIP-seq. Autoantigen peptides were collapsed at the gene level for overlap analyses. Bottom: corresponding overlap for IgA autoantigens. (F) Standard ELISA for CD244 auto-reactivity in MIS-C and healthy control plasma. (G) GSEA (gene set enrichment analysis) analysis of IgG autoantigens in treatment naïve MIS-C patients (N = 2; MIS-C 3 and MIS-C 9) versus age matched healthy controls (N = 4) ranked by t statistic. Dot color intensity corresponds to adjusted p value (FDR) and dot size represents the number of autoantigens found to be enriched in the associated gene set. (H) Corresponding enrichment scores for significantly (FDR<0.05) enriched biological pathways for IgG (regulation of immune response) and IgA (lymphocyte mediated immunity). Benjamini-Hochberg method was used to correct for multiple comparisons. See also Figure S5.

Update of

References

    1. Amanat F., Stadlbauer D., Strohmeier S., Nguyen T.H.O., Chromikova V., McMahon M., Jiang K., Arunkumar G.A., Jurczyszak D., Polanco J., et al. A serological assay to detect SARS-CoV-2 seroconversion in humans. Nat. Med. 2020;26:1033–1036. - PMC - PubMed
    1. Chang L.-Y., Lu C.-Y., Shao P.-L., Lee P.-I., Lin M.-T., Fan T.-Y., Cheng A.-L., Lee W.-L., Hu J.-J., Yeh S.-J., et al. Viral infections associated with Kawasaki disease. J. Formos. Med. Assoc. 2014;113:148–154. - PMC - PubMed
    1. Cheung E.W., Zachariah P., Gorelik M., Boneparth A., Kernie S.G., Orange J.S., Milner J.D. Multisystem Inflammatory Syndrome Related to COVID-19 in Previously Healthy Children and Adolescents in New York City. JAMA. 2020;324:294–296. - PMC - PubMed
    1. Conway J.R., Lex A., Gehlenborg N. UpSetR: an R package for the visualization of intersecting sets and their properties. Bioinformatics. 2017;33:2838–2840. - PMC - PubMed
    1. Dietz S.M., van Stijn D., Burgner D., Levin M., Kuipers I.M., Hutten B.A., Kuijpers T.W. Dissecting Kawasaki disease: a state-of-the-art review. Eur. J. Pediatr. 2017;176:995–1009. - PMC - PubMed

Publication types

MeSH terms

Supplementary concepts