. 2020 Sep 25;12(10):1085.
doi: 10.3390/v12101085.

Characterization of Avian Influenza Virus H10-H12 Subtypes Isolated from Wild Birds in Shanghai, China from 2016 to 2019

Affiliations

Characterization of Avian Influenza Virus H10-H12 Subtypes Isolated from Wild Birds in Shanghai, China from 2016 to 2019

Ling Tang et al. Viruses. .

Abstract

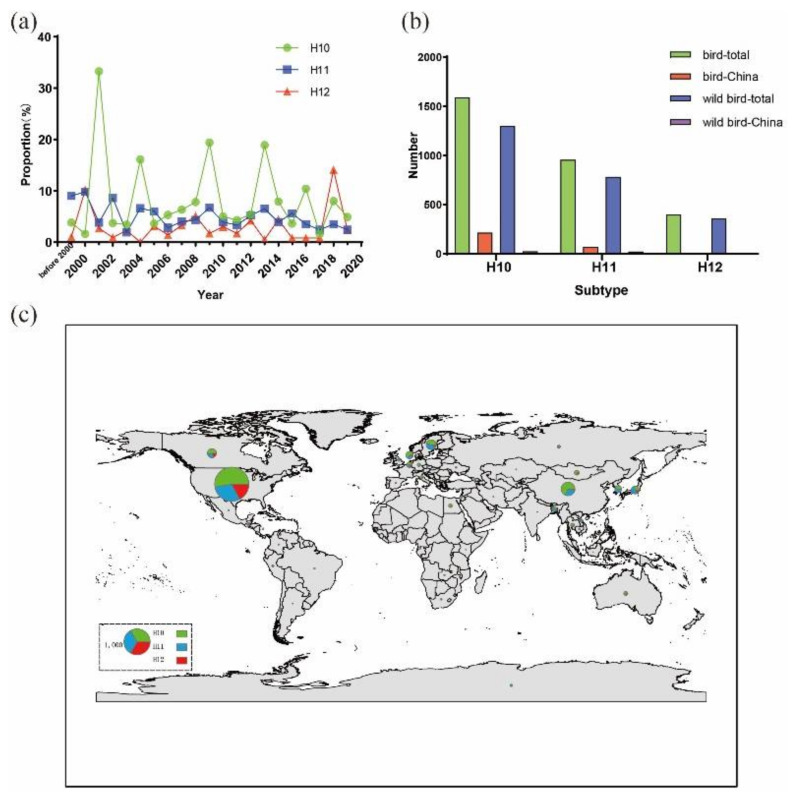
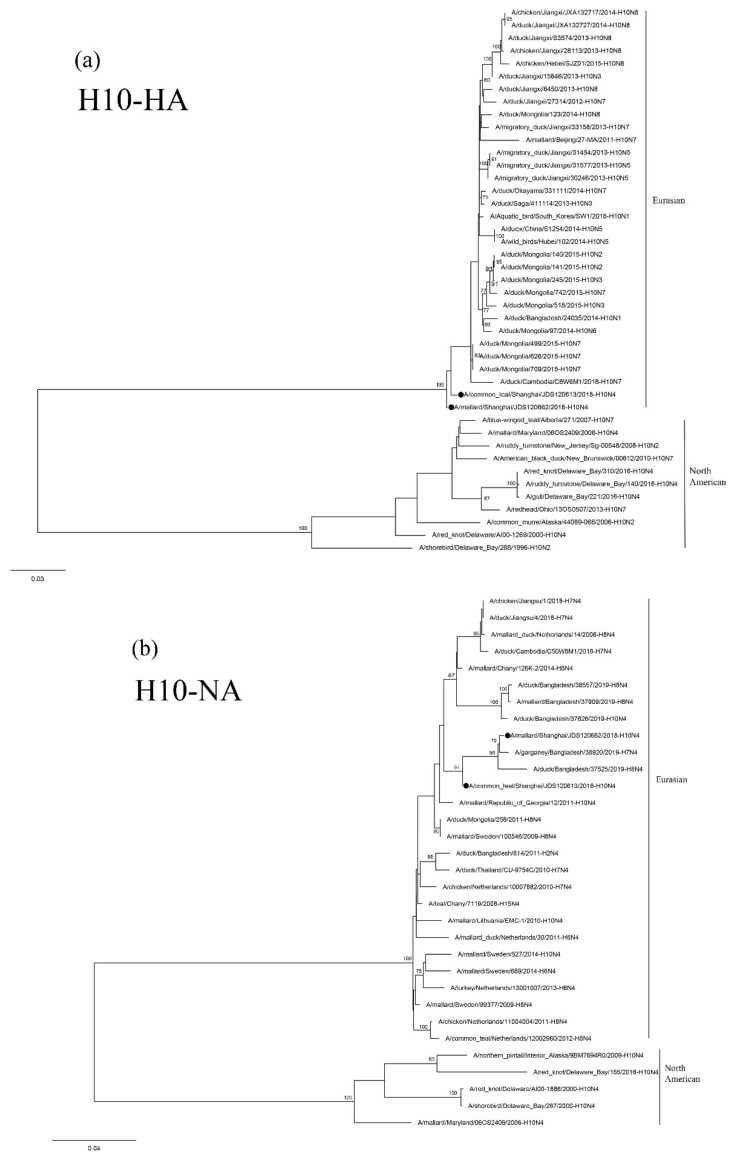
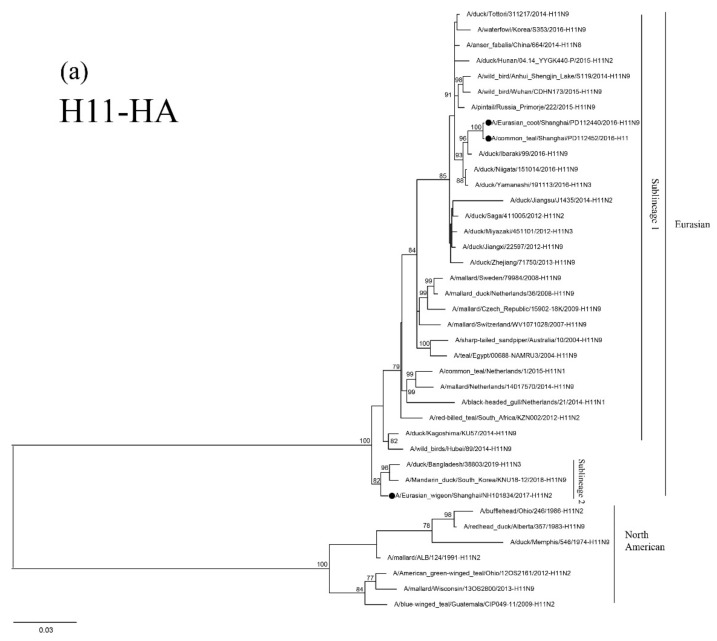
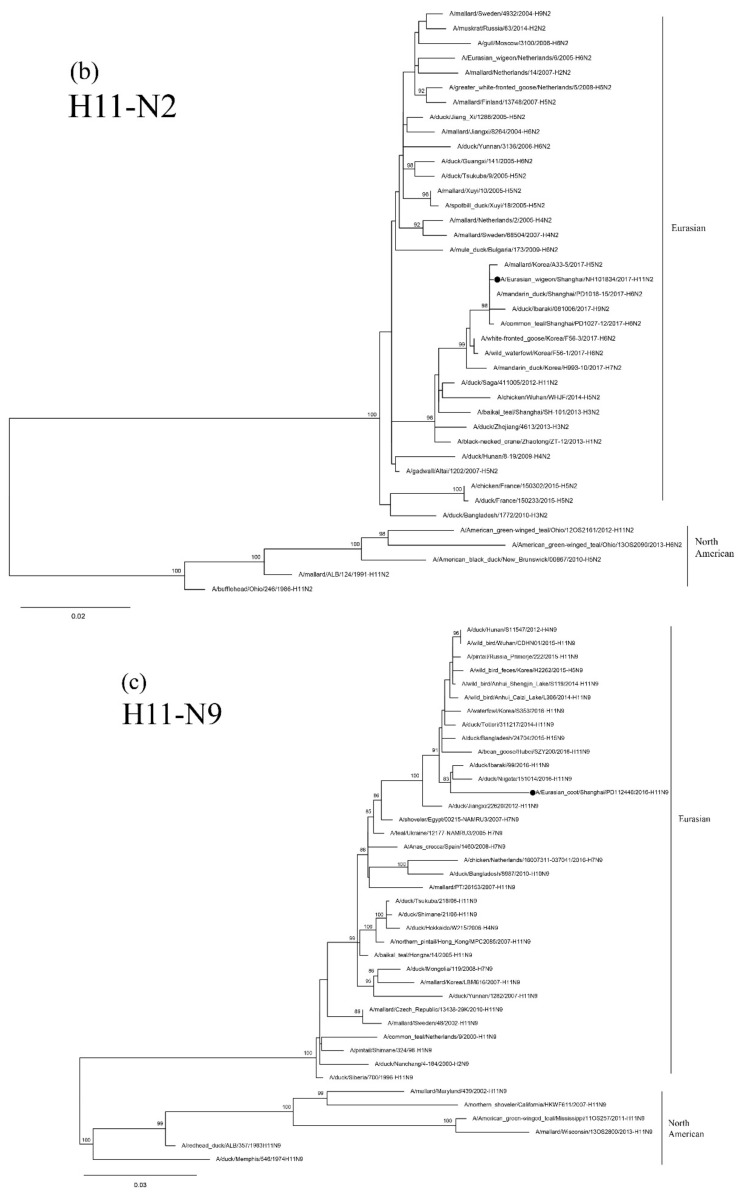
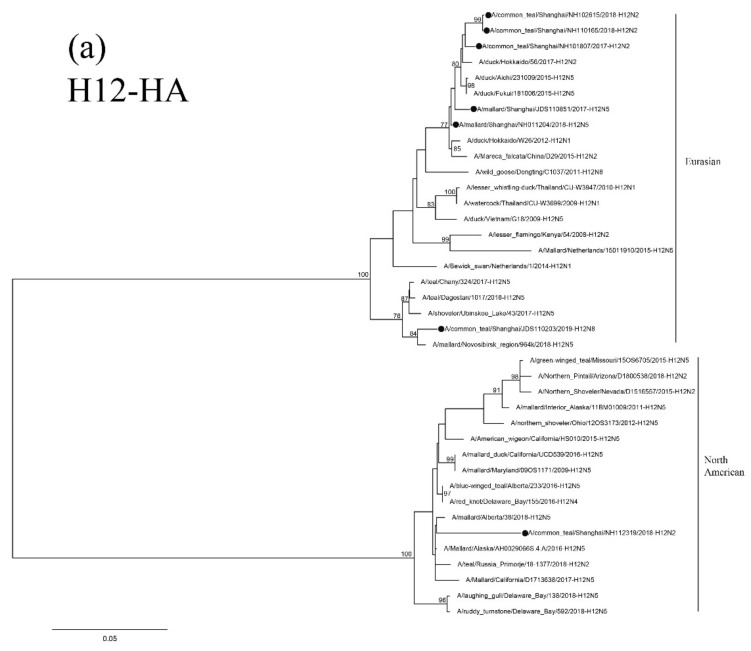
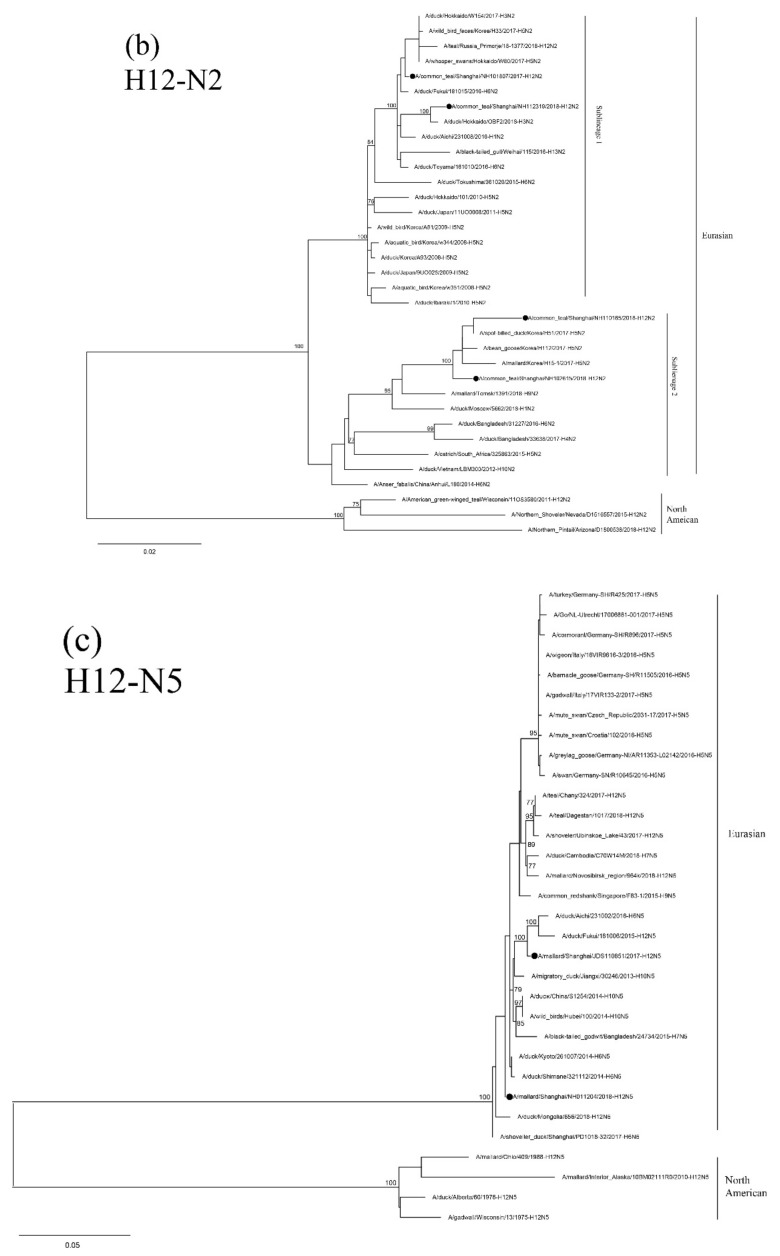
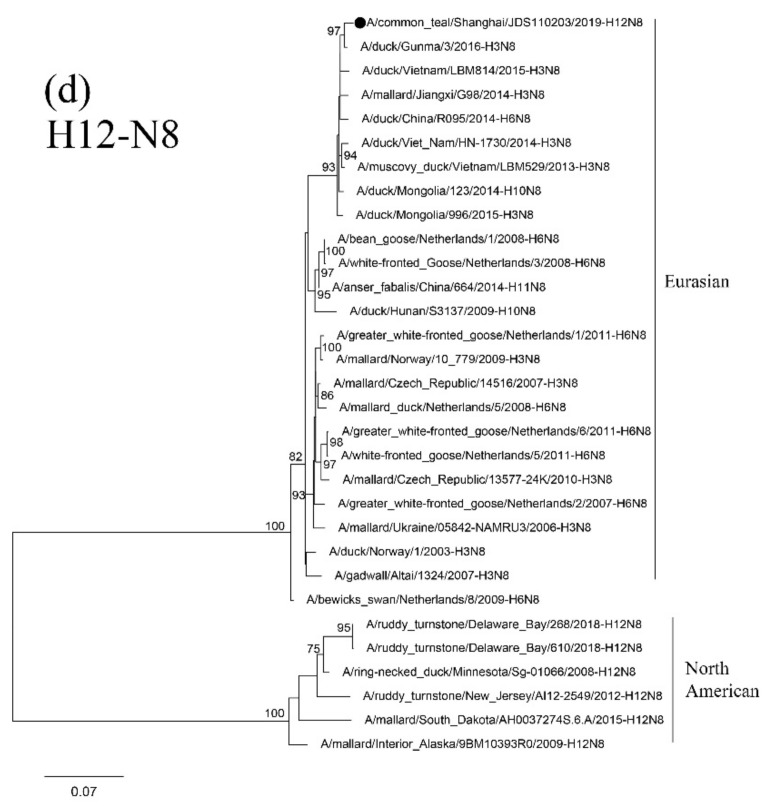
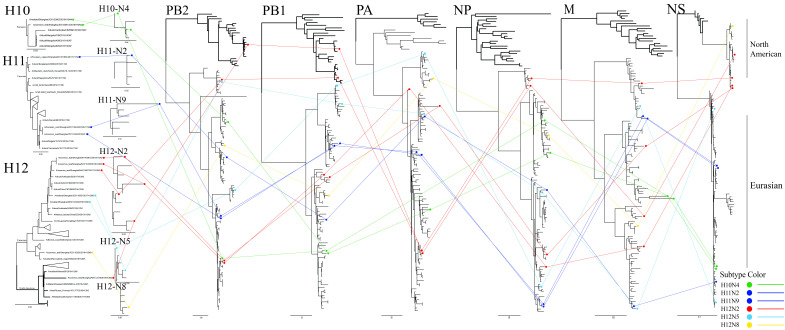
H10, H11 and H12 (H10-H12) subtypes of the avian influenza virus (AIV) are associated with waterfowl. Although these subtypes of AIV are infrequently detected in nature, they can undergo reassortment with other AIV subtypes. Few H10-H12 subtypes of AIV have been isolated from wild birds in China. In this study, 12 AIV isolates of H10-H12 subtypes were identified via routine surveillance of wild birds in Shanghai, China from 2016 to 2019, including two H10, three H11 and seven H12 isolates. Sequence and phylogenetic analyses revealed that the genomic segments of the 12 isolates are highly diverse. These 12 isolates are closely related to those in the Eurasian lineage and share a high degree of sequence identity with those from wild birds and domestic ducks in countries in the East Asian-Australasian Flyway, including Japan, Korea, Bangladesh, Vietnam and China. However, parts of the genomic segments of two H12N2 isolates (NH112319-H12N2 and NH101807-H12N2) belong to the North American lineage, suggesting intercontinental reassortment among H12 AIVs in Eurasia and North American. To better understand the ecological and phylodynamic features of H10-H12 subtypes in wild birds, a large-scale surveillance of AIVs in wild birds is warranted.

Keywords: H10–H12 subtypes; avian influenza virus; phylogenetic analysis; surveillance; wild birds.


Conflict of interest statement

The authors declare that they have no competing interests.

Figures

Figure 1
Figure 1
Distribution and yearly number of H10–H12 isolates. Data were obtained from the GenBank (http://www.ncbi.nlm.nih.gov) and the Global Initiative on Sharing Avian Influenza Data (www.gisaid.org) up to September 10, 2020. (a) Percentages of H10–H12 isolates out of the total number of AIVs per year; (b) total number of H10–H12 isolates from domestic and wild birds in the world and China; (c) global distribution of H10–H12 AIVs in wild birds. Map generated using ArcGIS version 10.2 (http://arcgis.com/). Size of each circle represents the number of isolates and the legend circle represents 1000 isolates. Green, blue and red colors represent H10, H11 and H12 isolates, respectively.
Figure 2
Figure 2
Phylogenetic trees of the HA (a) and NA (b) genes of the H10 isolates from Shanghai, China. HA and NA genes are 27–1701 bp and 1–1413 bp, respectively. Maximum-likelihood (ML) trees constructed using the GTR + G model for HA genes and the TIM2 + G model for NA genes in PhyML version 3.0. Bootstrap values were calculated for 100 replicates. Values less than 75% are not shown. Numbers indicate ML bootstrap values. H10 AIVs characterized in this study are indicated with black circles.
Figure 3
Figure 3
Phylogenetic trees of HA (a), N2 (b), and N9 (c) genes of the H11 isolates found in Shanghai, China. HA, N2 and N9 genes are 24–1688 bp, 29–1394 bp and 1–1413 bp, respectively. The maximum-likelihood (ML) trees were constructed using the TIM1+G model for HA and N2 genes and the GTR+G model for N9 genes in PhyML software version 3.0. Bootstrap values were calculated for 100 replicates. Values less than 75% are not shown. Numbers indicate ML bootstrap values. H11 AIV isolates characterized in this study are indicated with black circles.
Figure 3
Figure 3
Phylogenetic trees of HA (a), N2 (b), and N9 (c) genes of the H11 isolates found in Shanghai, China. HA, N2 and N9 genes are 24–1688 bp, 29–1394 bp and 1–1413 bp, respectively. The maximum-likelihood (ML) trees were constructed using the TIM1+G model for HA and N2 genes and the GTR+G model for N9 genes in PhyML software version 3.0. Bootstrap values were calculated for 100 replicates. Values less than 75% are not shown. Numbers indicate ML bootstrap values. H11 AIV isolates characterized in this study are indicated with black circles.
Figure 4
Figure 4
Phylogenetic trees of HA (a), N2 (b), N5 (c), and N8(d) genes of the H12 isolates found in Shanghai, China. HA, N2, N5 and N8 genes are 34–1704 bp, 24–1410 bp, 18–1399 bp and 24–1389 bp, respectively. The maximum-likelihood (ML) trees were constructed using the GTR + G model for HA, N5 and N8 genes and the TrN + I model for N2 genes in PhyML software version 3.0. Bootstrap values were calculated for 100 replicates. Values less than 75% are not shown. Numbers indicate ML bootstrap values. H12 AIV isolates characterized in this study are indicated with black circles.
Figure 4
Figure 4
Phylogenetic trees of HA (a), N2 (b), N5 (c), and N8(d) genes of the H12 isolates found in Shanghai, China. HA, N2, N5 and N8 genes are 34–1704 bp, 24–1410 bp, 18–1399 bp and 24–1389 bp, respectively. The maximum-likelihood (ML) trees were constructed using the GTR + G model for HA, N5 and N8 genes and the TrN + I model for N2 genes in PhyML software version 3.0. Bootstrap values were calculated for 100 replicates. Values less than 75% are not shown. Numbers indicate ML bootstrap values. H12 AIV isolates characterized in this study are indicated with black circles.
Figure 5
Figure 5
Genomic reassortment of H10–H12 isolates. ML trees contain all sequences generated in this study. Isolates and connecting lines are colored: H10—green; H11—dark blue; H12N2—red; H12N5—light blue; and H12N8—yellow. North American branches are shown in bold.

References

    1. Webster R.G., Bean W.J., Gorman O.T., Chambers T.M., Kawaoka Y. Evolution and ecology of influenza A viruses. Microbiol. Immunol. 1992;56:359–375. doi: 10.1128/MMBR.56.1.152-179.1992. - DOI - PMC - PubMed
    1. Kawaoka Y., Chambers T.M., Sladen W.L., Gwebster R. Is the gene pool of influenza viruses in shorebirds and gulls different from that in wild ducks. Virology. 1988;163:247–250. doi: 10.1016/0042-6822(88)90260-7. - DOI - PubMed
    1. Guan M., Hall J.S., Zhang X., Dusek R.J., Olivier A.K., Liu L., Li L., Krauss S., Danner A., Li T., et al. Aerosol transmission of Gull-Origin Iceland subtype H10N7 influenza A virus in ferrets. J. Virol. 2019:93. doi: 10.1128/JVI.00282-19. - DOI - PMC - PubMed
    1. Brown J.D., Swayne D.E., Cooper R.J., Burns R.E., Stallknecht D.E. Persistence of H5 and H7 avian influenza viruses in water. Avian Dis. 2007;51:285–289. doi: 10.1637/7636-042806R.1. - DOI - PubMed
    1. Lee H.J., Kwon J.S., Lee D.H., Lee Y.N., Youn H.N., Lee Y.J., Kim M.C., Jeong O.M., Kang H.M., Kwon J.H., et al. Continuing evolution and interspecies transmission of influenza viruses in live bird markets in Korea. Avian Dis. 2010;54(Suppl. 1):738–748. doi: 10.1637/8785-040109-ResNote.1. - DOI - PubMed

Publication types