Meta-Analysis
. 2020 Sep 29;20(1):247.
doi: 10.1186/s12911-020-01266-z.

Using machine learning of clinical data to diagnose COVID-19: a systematic review and meta-analysis

Affiliations
Meta-Analysis

Using machine learning of clinical data to diagnose COVID-19: a systematic review and meta-analysis

Wei Tse Li et al. BMC Med Inform Decis Mak. .

Abstract

Background: The recent Coronavirus Disease 2019 (COVID-19) pandemic has placed severe stress on healthcare systems worldwide, which is amplified by the critical shortage of COVID-19 tests.

Methods: In this study, we propose to generate a more accurate diagnosis model of COVID-19 based on patient symptoms and routine test results by applying machine learning to reanalyzing COVID-19 data from 151 published studies. We aim to investigate correlations between clinical variables, cluster COVID-19 patients into subtypes, and generate a computational classification model for discriminating between COVID-19 patients and influenza patients based on clinical variables alone.

Results: We discovered several novel associations between clinical variables, including correlations between being male and having higher levels of serum lymphocytes and neutrophils. We found that COVID-19 patients could be clustered into subtypes based on serum levels of immune cells, gender, and reported symptoms. Finally, we trained an XGBoost model to achieve a sensitivity of 92.5% and a specificity of 97.9% in discriminating COVID-19 patients from influenza patients.

Conclusions: We demonstrated that computational methods trained on large clinical datasets could yield ever more accurate COVID-19 diagnostic models to mitigate the impact of lack of testing. We also presented previously unknown COVID-19 clinical variable correlations and clinical subgroups.

Keywords: COVID-19; Diagnostic model; Machine learning.


Conflict of interest statement

The authors declare that they have no competing interests.

Figures

Fig. 1
Fig. 1
Select correlations with continuous clinical variables for COVID-19 patients. a Correlations between two continuous variables (Spearman, p < 0.05). b Correlations between one continuous and one categorical variable (Kruskal-Wallis test, p < 0.05)
Fig. 2
Fig. 2
Correlations between gender and another categorical variable. a Correlation between lymphocyte level categories and gender. b Correlation between neutrophil level categories and gender. c Correlation between serum leukocyte level categories and gender. A contingency table and a bar plot of the number of patients in each level are displayed for each correlation
Fig. 3
Fig. 3
Summary of COVID-19 patient clustering using SOM. a Plot of topographic error of the 2D SOM grid vs. size of the grid. b 2D plot of SOM neurons after retaining only the most significant clinical variable for analysis. Each small grid represents a neuron, and the size of the square in each grid represents the number of patients associated with each neuron. The color code corresponds to superclusters presented in panel (d). c Plot of number of patients in each neuron. d 3D dendrogram summarizing the neurons into superclusters. e 2D dendrogram with the same information as the dendrogram in panel (d). In both dendrograms, the vertical axis represents the relative distance between clusters, which can be known between any two clusters by looking at the branch point where they diverge. f Gradient map where light blue regions of the SOM depict higher similarity of neurons with each other. g Boxplots of immune-associated clinical variables that differentiate superclusters. h Boxplots in which superclusters 1 and 3 display similar trends. i Boxplots in which only one supercluster has a median at a different value from the other three. All variables have been previously normalized. For binary variables, only three possible positions on the vertical axis is possible: the bottom one being no, the middle one being yes, and the top one being missing. For the gender (sex) variable, the bottom position is female, the middle is male, and the top one is missing
Fig. 4
Fig. 4
Summary of XGBoost classification of COVID-19 and influenza patients. a ROC curve of prediction. b Precision recall curve of prediction. c Confusion matrix of prediction. d Variables most important for classification, listed by decreasing order of importance. e 6-level sample model of SOM decision tree construction
Fig. 5
Fig. 5
Classification of COVID-19 vs. influenza patients using RIDGE, random forest, and LASSO models. ROC curves and AUC for each model were presented
Fig. 6
Fig. 6
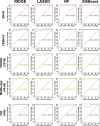
Classification of COVID-19 vs. influenza patients in different demographic cohorts. RIDGE, LASSO, random forest (RF), and XGBoost classification models were applied to 5 different cohorts of patients

References

    1. Chang MG, Yuan X, Tao Y, Peng X, Wang F, Xie L, Sharma L, Dela Cruz CS, Qin E. Time Kinetics of Viral Clearance and Resolution of Symptoms in Novel Coronavirus Infection. Am J Respir Crit Care Med. 2020;201(9):1150–2. - PMC - PubMed
    1. Zhang MQ, Wang XH, Chen YL, Zhao KL, Cai YQ, An CL, Lin MG, Mu XD. Clinical features of 2019 novel coronavirus pneumonia in the early stage from a fever clinic in Beijing. Zhonghua Jie He He Hu Xi Za Zhi. 2020;43(3):215–218. - PubMed
    1. Feng K, Yun YX, Wang XF, Yang GD, Zheng YJ, Lin CM, Wang LF. Analysis of CT features of 15 children with 2019 novel coronavirus infection. Zhonghua Er Ke Za Zhi. 2020;58(0):E007. - PubMed
    1. Li Y, Guo F, Cao Y, Li L, Guo Y. Insight into COVID-2019 for pediatricians. Pediatr Pulmonol. 2020;55:E1–E4. - PMC - PubMed
    1. HUANG P. If Most of your coronavirus tests come Back positive, You're not testing enough: NPR; Washington D.C.; 2020.

Publication types

MeSH terms