

Monitoring the progress of health-related sustainable development goals (SDGs) in Brazilian states using the Global Burden of Disease indicators
- PMID: 32993666
- PMCID: PMC7526114
- DOI: 10.1186/s12963-020-00207-2
Monitoring the progress of health-related sustainable development goals (SDGs) in Brazilian states using the Global Burden of Disease indicators
Abstract
Background: Measuring the Global Burden of Disease (GBD) has been the key to verifying the evolution of health indicators worldwide. We analyse subnational GBD data for Brazil in order to monitor the performance of the Brazilian states in the last 28 years on their progress towards meeting the health-related SDGs.
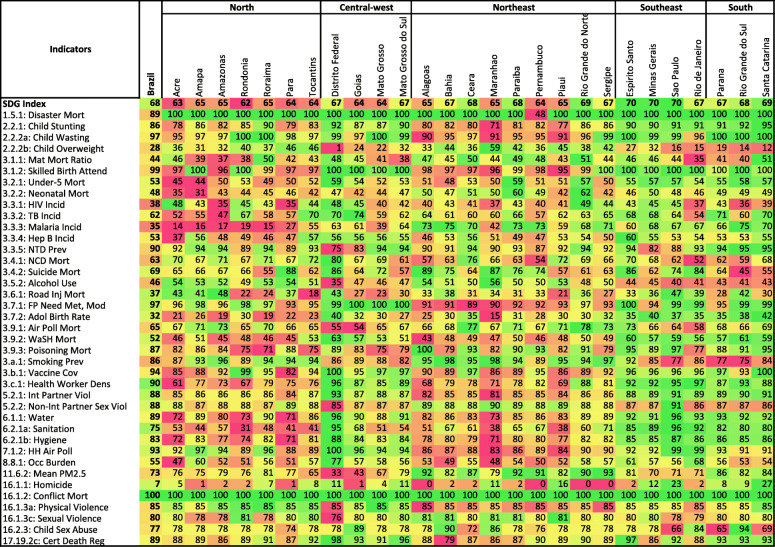
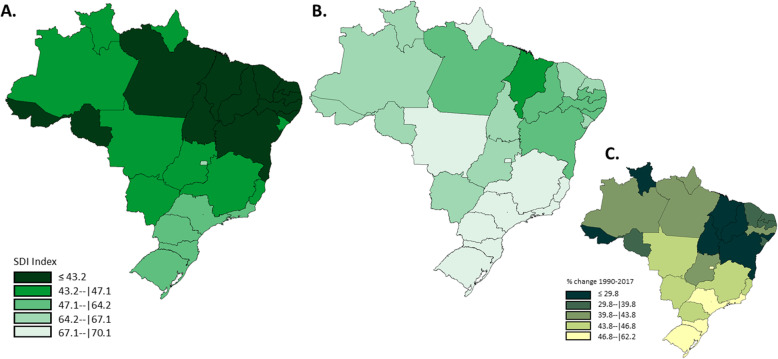
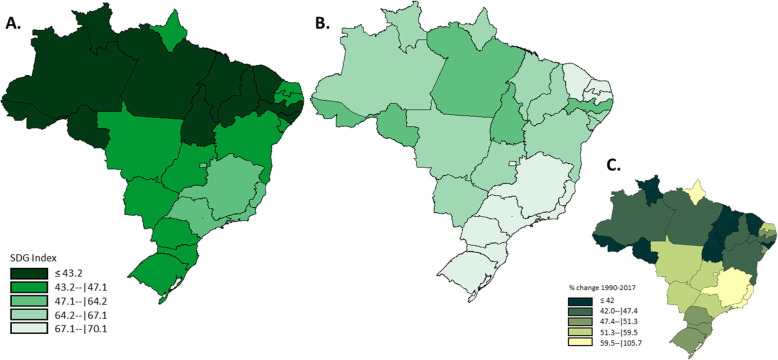
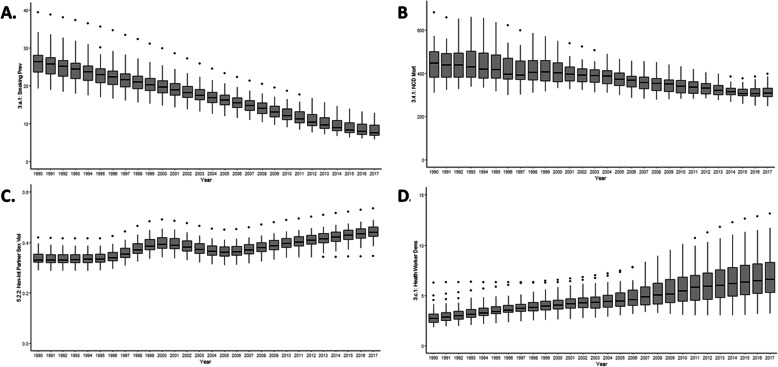
Methods: As part of the GBD study, we assessed the 41 health-related indicators from the SDGs in Brazil at the subnational level for all the 26 Brazilian states and the Federal District from 1990 to 2017. The GBD group has rescaled all worldwide indicators from 0 to 100, assuming that for each one of them, the worst value among all countries and overtime is 0, and the best is 100. They also estimate the overall health-related SDG index as a function of all previously estimated health indicators and the SDI index (Socio-Demographic Index) as a function of per capita income, average schooling in the population aged 15 years or over, and total fertility rate under the age of 25 (TFU25).
Results: From 1990 to 2017, most subnational health-related SDGs, the SDG and SDI indexes improved considerable in most Brazilian states. The observed differences in SDG indicators within Brazilian states, including HIV incidence and health worker density, increased over time. In 2017, health-related indicators that achieved good results globally included the prevalence of child wasting, NTD, household air pollution, conflict mortality, skilled birth attendance, use of modern contraceptive methods, vaccine coverage, and health worker density, but poor results were observed for child overweight and homicide rates. The high rates of overweight, alcohol consumption, and smoking prevalence found in the historically richest regions (i.e., the South and Southeast), contrast with the high rates of tuberculosis, maternal, neonatal, and under-5 mortality and WASH-related mortality found in the poorer regions (i.e., the North and Northeast).
Conclusions: The majority of Brazil's health-related SDG indicators have substantially improved over the past 28 years. However, inequalities in health among the Brazilian states and regions remain noticeable negatively affecting the Brazilian population, which can contribute to Brazil not achieving the SDG 2030 targets.
Keywords: Health disparities; Health indicators; Inequalities; Middle-income countries; Poverty.
Conflict of interest statement
The authors declare that they have no competing interests.
Figures

References
-
- WHO. Health in 2015: from MDGs, millennium development goals to SDGs, sustainable development goals. Geneva: World Health Organization; 2015.
-
- UNESCO . La UNESCO avanza la Agenda 2030 para el Desarrollo Sostenible. Paris: Unesco; 2017.
-
- WHO. Handbook on health inequality monitoring: with a special focus on low-and middle-income countries: World Health Organization; 2013.
-
- World Bank. GINI index: The World Bank; 2017. Available from: http://data.worldbank.org/indicator/SI.POV.GINI/countries/%201W?display. .
MeSH terms
LinkOut - more resources
Full Text Sources
Research Materials
Miscellaneous
