. 2020 Sep 29;17(1):285.
doi: 10.1186/s12974-020-01956-5.

Role of sex and high-fat diet in metabolic and hypothalamic disturbances in the 3xTg-AD mouse model of Alzheimer's disease

Affiliations

Role of sex and high-fat diet in metabolic and hypothalamic disturbances in the 3xTg-AD mouse model of Alzheimer's disease

Lisa S Robison et al. J Neuroinflammation. .

Abstract

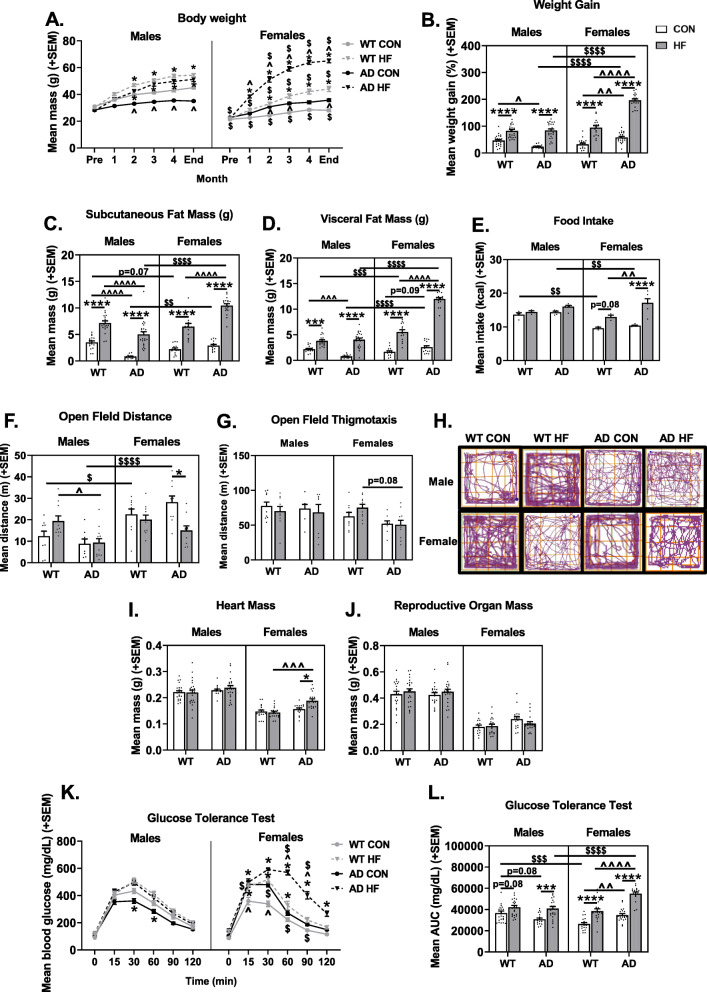
Background: Hypothalamic dysfunction occurs early in the clinical course of Alzheimer's disease (AD), likely contributing to disturbances in feeding behavior and metabolic function that are often observed years prior to the onset of cognitive symptoms. Late-life weight loss and low BMI are associated with increased risk of dementia and faster progression of disease. However, high-fat diet and metabolic disease (e.g., obesity, type 2 diabetes), particularly in mid-life, are associated with increased risk of AD, as well as exacerbated AD pathology and behavioral deficits in animal models. In the current study, we explored possible relationships between hypothalamic function, diet/metabolic status, and AD. Considering the sex bias in AD, with women representing two-thirds of AD patients, we sought to determine whether these relationships vary by sex.

Methods: WT and 3xTg-AD male and female mice were fed a control (10% fat) or high-fat (HF 60% fat) diet from ~ 3-7 months of age, then tested for metabolic and hypothalamic disturbances.

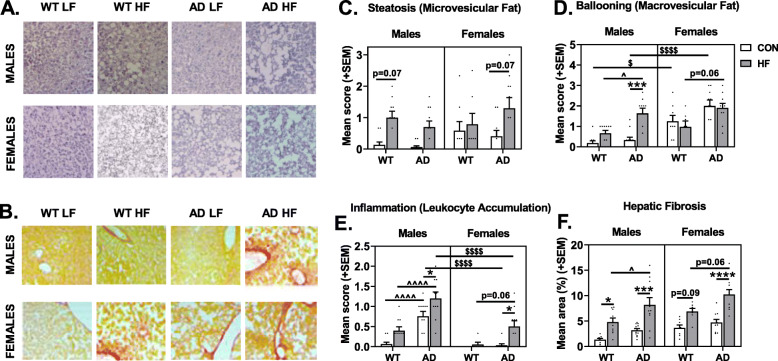
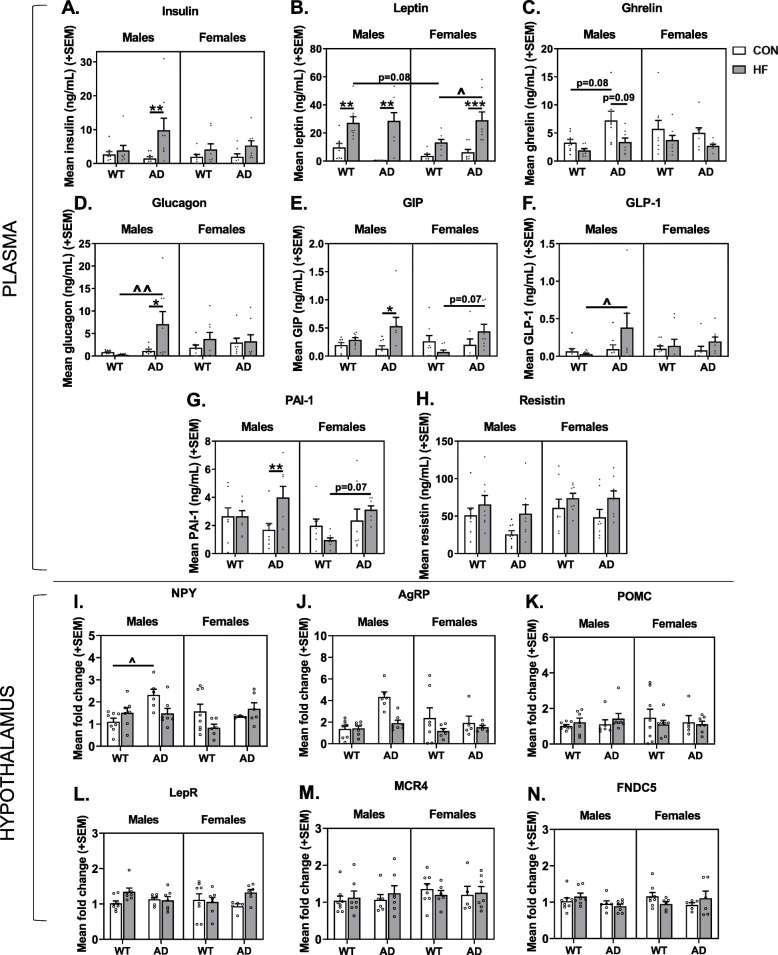
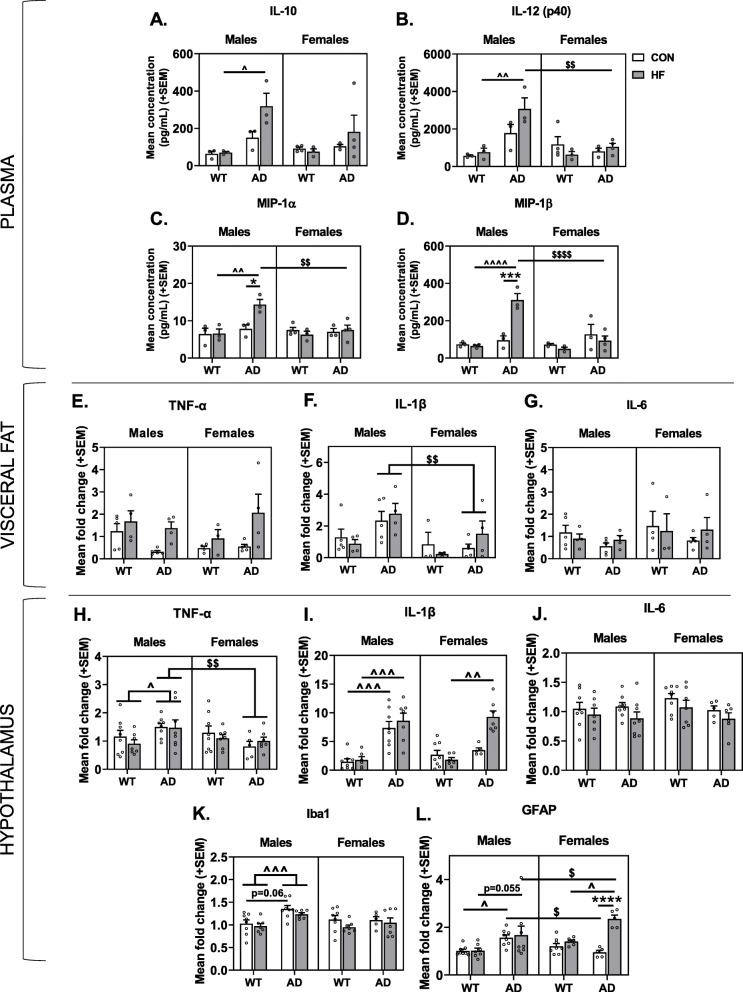
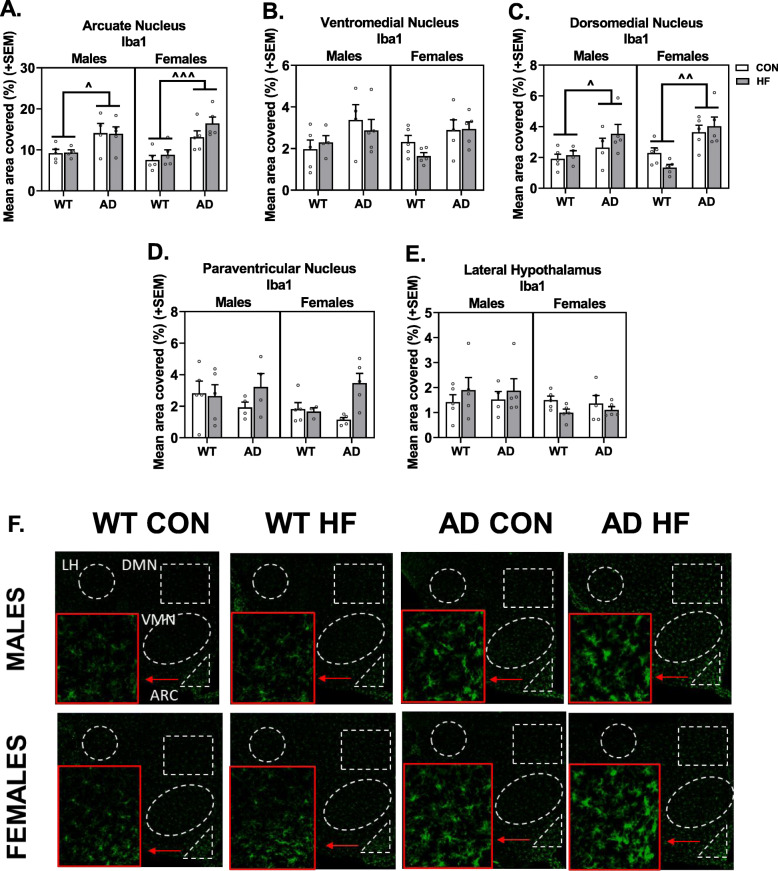
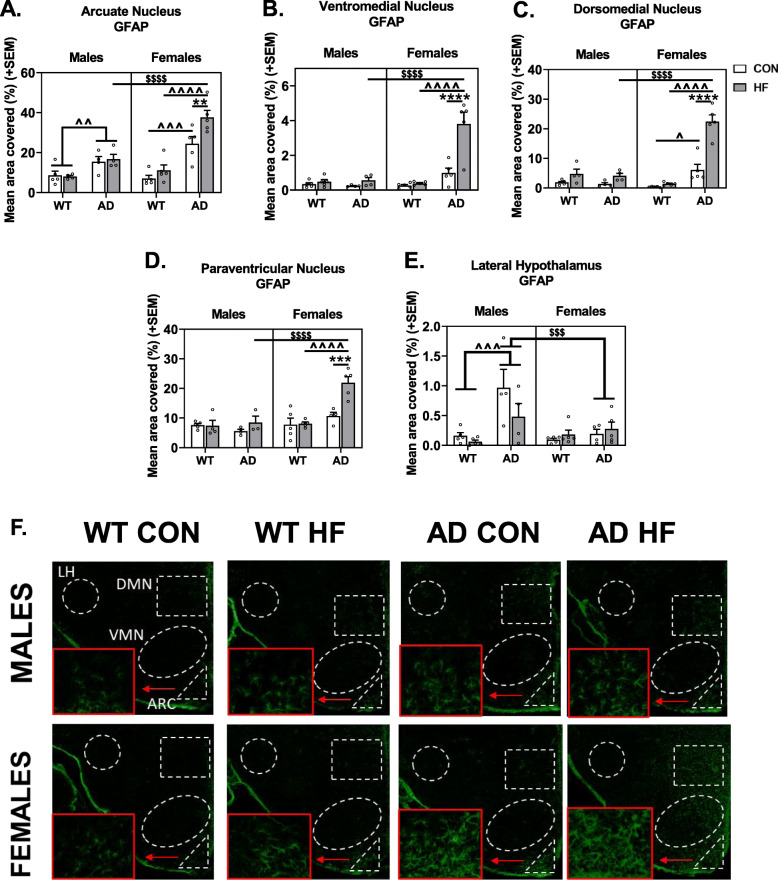
Results: On control diet, male 3xTg-AD mice displayed decreased body weight, reduced fat mass, hypoleptinemia, and mild systemic inflammation, as well as increased expression of gliosis- and inflammation-related genes in the hypothalamus (Iba1, GFAP, TNF-α, IL-1β). In contrast, female 3xTg-AD mice on control diet displayed metabolic disturbances opposite that of 3xTg-AD males (increased body and fat mass, impaired glucose tolerance). HF diet resulted in expected metabolic alterations across groups (increased body and fat mass; glucose intolerance; increased plasma insulin and leptin, decreased ghrelin; nonalcoholic fatty liver disease-related pathology). HF diet resulted in the greatest weight gain, adiposity, and glucose intolerance in 3xTg-AD females, which were associated with markedly increased hypothalamic expression of GFAP and IL-1β, as well as GFAP labeling in several hypothalamic nuclei that regulate energy balance. In contrast, HF diet increased diabetes markers and systemic inflammation preferentially in AD males but did not exacerbate hypothalamic inflammation in this group.

Conclusions: These findings provide further evidence for the roles of hypothalamic and metabolic dysfunction in AD, which in the 3xTg-AD mouse model appears to be dependent on both sex and diet.

Keywords: Alzheimer’s disease; Diabetes; High-fat diet; Hypothalamus; Inflammation; Metabolic; Obesity; Sex.


Conflict of interest statement

The authors declare that they have no competing interests.

Figures

Fig. 1
Fig. 1
Sex and diet interact to influence weight gain, adiposity, and glucose intolerance in 3xTg-AD mice. a Body weight was measured at the beginning of the experiment, prior to the start of respective diet intervention, once per month during the diet intervention, and at the end of the experiment just prior to tissue collection. N = 18–25/group. b Weight gain was calculated as the percent difference in body weight at the end of the experiment versus initial body weight measured prior to the start of diet intervention. N = 18–25/group. c Subcutaneous and d visceral fat wet weights (in grams) assessed at the end of the experiment. N = 14–24/group. e Food intake was measured (in grams) to obtain an average measure of daily food intake for each cage of mice within the same treatment group. The mass of food consumed was multiplied by the energy density in each respective diet type to obtain the average daily caloric intake. Each data point represents the mean intake of one cage of mice (3–5 mice per cage). N = 3–6 cages/group. f Distance traveled (m) in a 10-min open field test. N = 8–13/group. g Thigmotaxis in a 10-min open field test. N = 8-13/group. h Representative traces of locomotor behavior in a 10-min open field test. Mean wet weight (in grams) of the heart (i) and reproductive organs (seminal vesicles in males, uterine weights in females) (j). N = 14-25/group. kl Glucose tolerance testing (GTT). GTT was performed to assess diabetic status 3 months after the start of diet intervention. k Blood glucose levels were measured following overnight fasting (t = 0), then mice were injected with glucose challenge and blood glucose levels were measured at 15, 30, 60, 90, and 120 min post-injection. l Area under the curve for GTT testing was computed as a measure of total glucose exposure. N = 18–25/group. * = diet effect p < 0.05; ** = diet effect p < 0.01; *** = diet effect p < 0.001; **** = diet effect p < 0.0001; $ = sex effect p < 0.05; $$ = sex effect p < 0.01; $$$ = sex effect p < 0.001; $$$$ = sex effect p < 0.0001; ^ = AD effect p<0.05; ^^ = AD effect p < 0.01; ^^^ = AD effect p < 0.001; ^^^^ = AD effect p < 0.0001
Fig. 2
Fig. 2
HF diet and AD are associated with nonalcoholic fatty liver disease (NAFLD)-related pathology. Liver sections were stained with a hematoxylin and eosin (H&E) or b Sirius red to assess NAFLD pathology. H&E-stained sections were assessed for c steatosis (microvesicular fat), d ballooning (macrovesicular fat), and e inflammation (leukocyte accumulation) using a semi-quantitative scoring system (scored 0–3). f Sirius red-stained sections were assessed for hepatic fibrosis by measuring the percent area positive for the stain. N = 7–12/group for all measures. * = diet effect p < 0.05; *** = diet effect p < 0.001; **** = diet effect p < 0.0001; $$$$ = sex effect p < 0.0001; ^ = AD effect p < 0.05; ^^^^ = AD effect p < 0.0001
Fig. 3
Fig. 3
Sex-specific effects of HF diet and AD on plasma levels of diabetes-associated markers and expression of hypothalamic peptides that regulate feeding. ah Plasma concentrations of diabetes-related markers. Blood was collected following a 5 h fasting period just prior to euthanasia, and assayed for a insulin, b leptin, c ghrelin, d glucagon, e gastric inhibitory polypeptide (GIP), f glucagon-like-peptide 1 (GLP-1), g plasma plasminogen activator inhibitor-1 (PAI-1), and h resistin. N = 8/group for all plasma markers. in Gene expression levels in homogenate of the whole hypothalamus related to energy balance. Hypothalamus was collected following a 5 h fasting period just prior to euthanasia, and assayed for i neuropeptide Y (NPY), j agouti-related peptide (AgRP), k pro-opiomelanocortin (POMC), l leptin receptor (LepR), m melanocortin receptor 4 (MCR4), n fibronectin type III domain-containing protein 5 (FNDC5). N = 5–8/group for all gene expression analyses in the hypothalamus. * = diet effect p < 0.05; ** = diet effect p < 0.01; ^ = AD effect p < 0.05; ^^ = AD effect p < 0.01
Fig. 4
Fig. 4
Sex differences in the effects of AD and diet on peripheral inflammation and hypothalamic expression of inflammation-related genes. ad Plasma concentrations of cytokines. Blood was collected following a 5 h fasting period just prior to euthanasia and assayed for 23 cytokines, with significant group differences seen for a IL-10, b IL-12 (p40), c MIP-1α, and d MIP-1β. N = 3–4/group for all plasma markers. eg Gene expression levels in visceral fat related to inflammation, including e TNF-α, f IL-1β, g IL-6. hl Gene expression levels in homogenate of the whole hypothalamus related to inflammation. Hypothalamus was collected following a 5-h fasting period just prior to euthanasia and assayed for h TNF-α, i IL-1β, j IL-6, k Iba1, l GFAP. N = 5–8/group for all gene expression analyses in the hypothalamus. * = diet effect p < 0.05; *** = diet effect p < 0.001; **** = diet effect p < 0.0001; $ = sex effect p < 0.05; $$ = sex effect p < 0.01; $$$$ = sex effect p < 0.0001; ^ = AD effect p < 0.05; ^^ = AD effect p < 0.01; ^^^ = AD effect p < 0.001; ^^^^ = AD effect p < 0.0001
Fig. 5
Fig. 5
Hypothalamic microgliosis in AD mice occurs in a nucleus-specific manner but is unaffected by sex or HF diet. Labeling of tissue sections including the hypothalamus was performed for Iba1. Quantification was performed for percent area positive for each label in the arcuate nucleus (a), ventromedial nucleus (b), dorsomedial nucleus (c), paraventricular nucleus (d), and lateral hypothalamus area (e). Representative images for labeling with Iba1 are also shown (f). N = 3–5/group. ^ = AD effect p < 0.05; ^^ = AD effect p < 0.01; ^^^ = AD effect p < 0.001
Fig. 6
Fig. 6
Sex differences in hypothalamic gliosis in response to AD and HF diet. Labeling of tissue sections including the hypothalamus was performed for GFAP. Quantification was performed for percent area positive for each label in the arcuate nucleus (a), ventromedial nucleus (b), dorsomedial nucleus (c), paraventricular nucleus (d), and lateral hypothalamus area (e). Representative images for labeling with GFAP are also shown (f). N = 3–5/group. *** = diet effect p < 0.001; **** = diet effect p < 0.0001; $$$ = sex effect p < 0.001; $$$$ = sex effect p < 0.0001; ^^ = AD effect p < 0.01; ^^^ = AD effect p < 0.001; ^^^^ = AD effect p < 0.0001

References

    1. Prince M, Bryce R, Albanese E, Wimo A, Ribeiro W, Ferri CP. The global prevalence of dementia: a systematic review and metaanalysis. Alzheimers Dement. 2013;9(1):63–75.e2. doi: 10.1016/j.jalz.2012.11.007. - DOI - PubMed
    1. Ishii M, Iadecola C. Metabolic and non-cognitive manifestations of Alzheimer’s disease: the hypothalamus as both culprit and target of pathology. Cell Metab. 2015;22(5):761–776. doi: 10.1016/j.cmet.2015.08.016. - DOI - PMC - PubMed
    1. White H, Pieper C, Schmader K. The association of weight change in Alzheimer’s disease with severity of disease and mortality: a longitudinal analysis. J Am Geriatr Soc. 1998;46(10):1223–1227. doi: 10.1111/j.1532-5415.1998.tb04537.x. - DOI - PubMed
    1. Buchman AS, Wilson RS, Bienias JL, Shah RC, Evans DA, Bennett DA. Change in body mass index and risk of incident Alzheimer disease. Neurology. 2005;65(6):892–897. doi: 10.1212/01.wnl.0000176061.33817.90. - DOI - PubMed
    1. Cova I, Clerici F, Rossi A, Cucumo V, Ghiretti R, Maggiore L, et al. Weight loss predicts progression of mild cognitive impairment to Alzheimer’s disease. PLoS One. 2016;11(3):e0151710. doi: 10.1371/journal.pone.0151710. - DOI - PMC - PubMed

MeSH terms