. 2020 Oct 27;147(20):dev195388.
doi: 10.1242/dev.195388.

RYK-mediated filopodial pathfinding facilitates midgut elongation

Affiliations

RYK-mediated filopodial pathfinding facilitates midgut elongation

Sha Wang et al. Development. .

Abstract

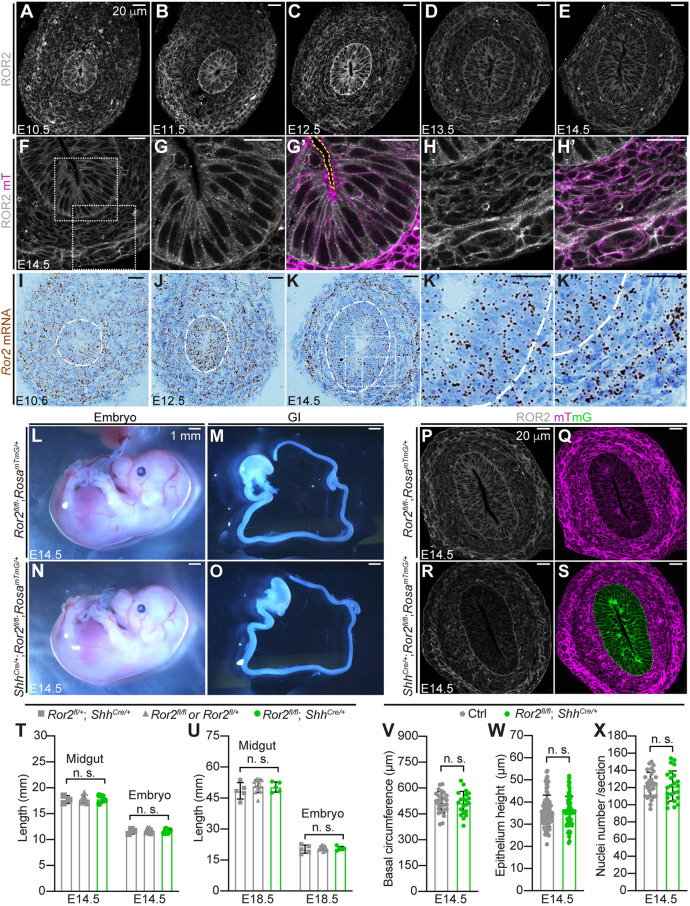
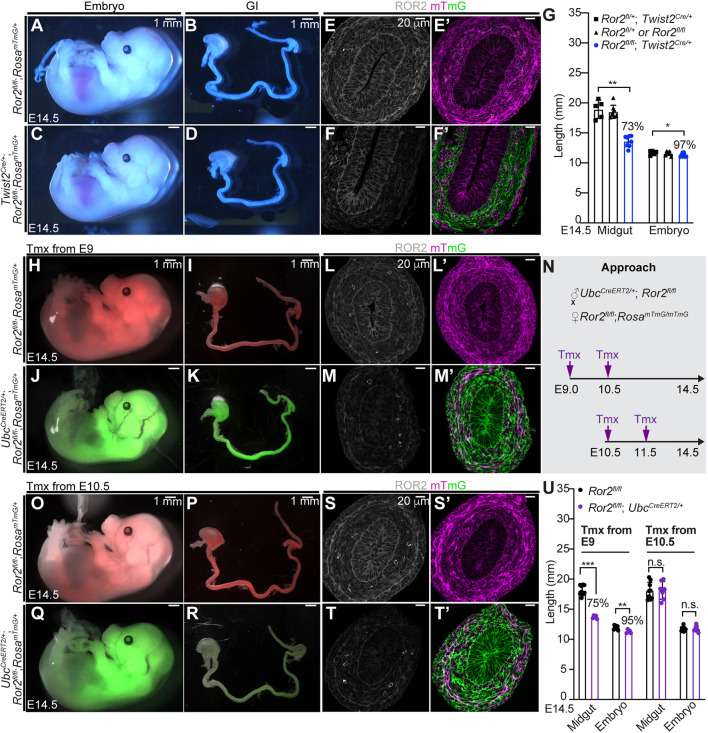
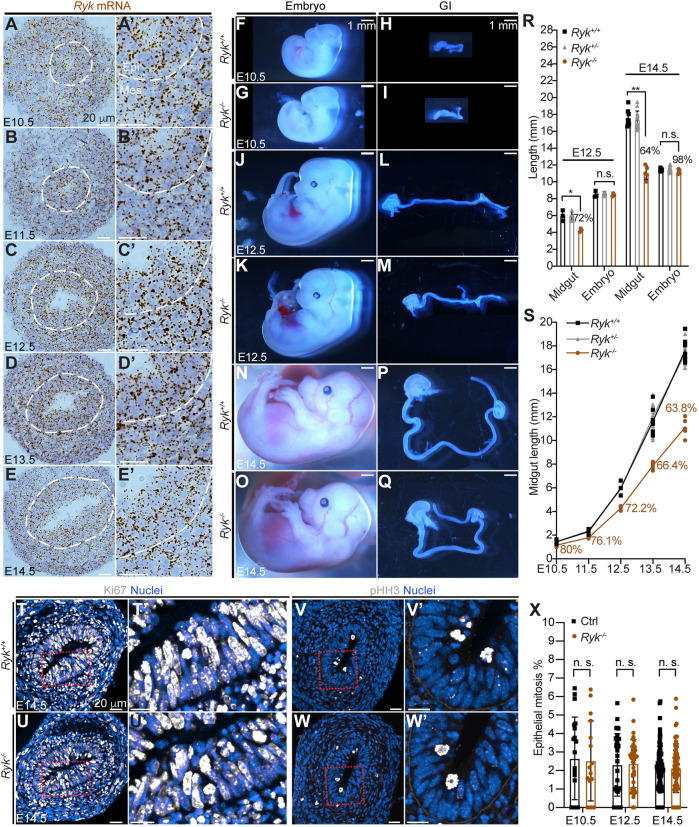
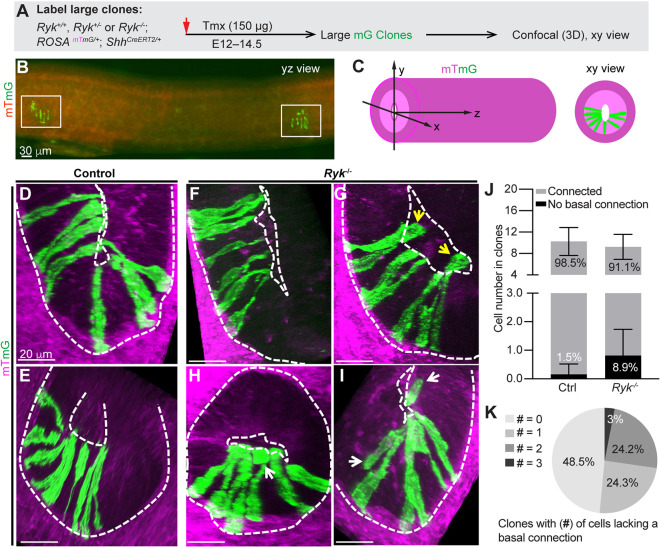
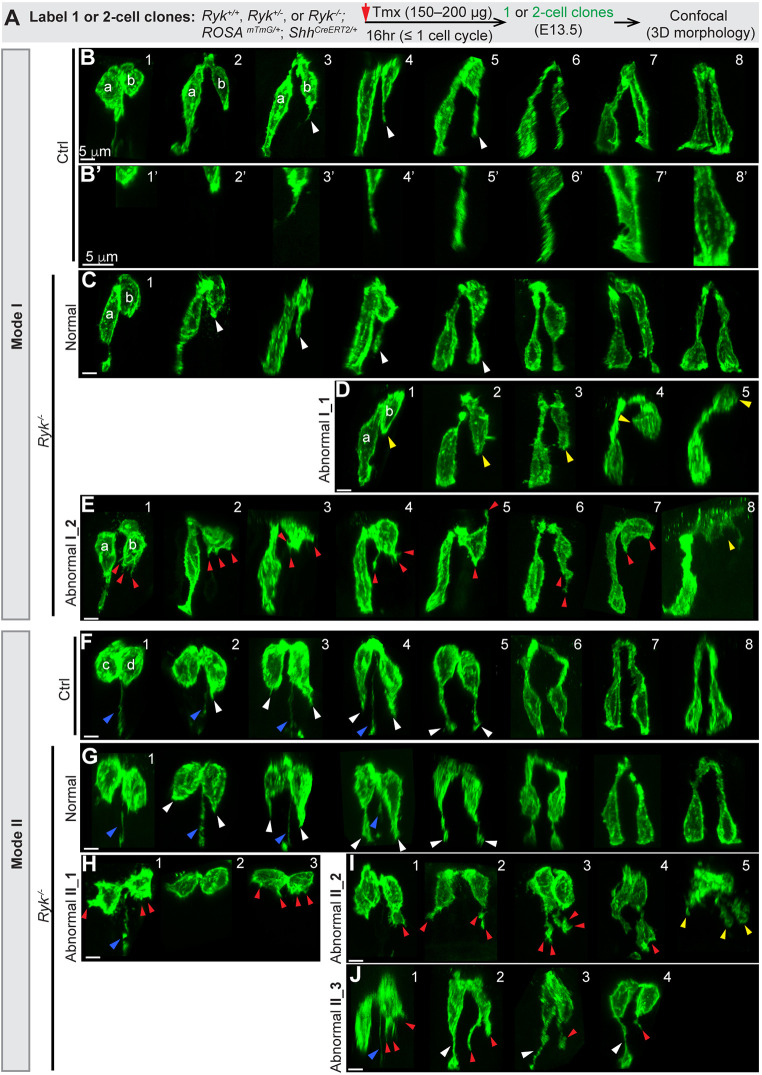
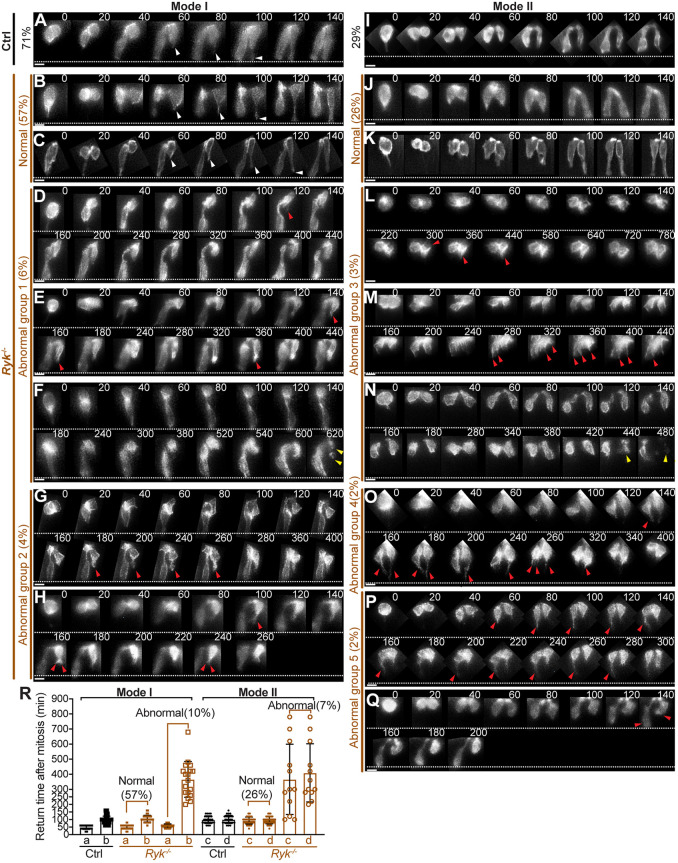
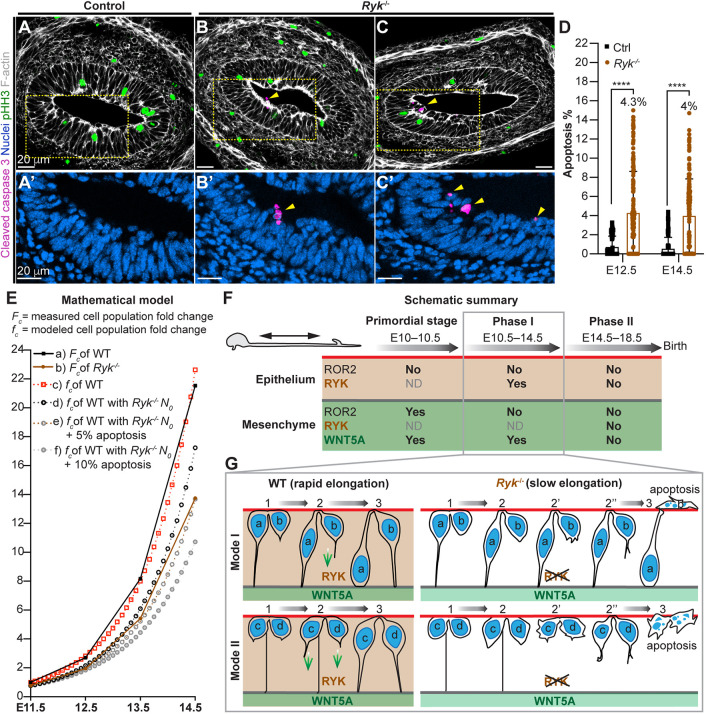
Between embryonic days 10.5 and 14.5, active proliferation drives rapid elongation of the murine midgut epithelial tube. Within this pseudostratified epithelium, nuclei synthesize DNA near the basal surface and move apically to divide. After mitosis, the majority of daughter cells extend a long, basally oriented filopodial protrusion, building a de novo path along which their nuclei can return to the basal side. WNT5A, which is secreted by surrounding mesenchymal cells, acts as a guidance cue to orchestrate this epithelial pathfinding behavior, but how this signal is received by epithelial cells is unknown. Here, we have investigated two known WNT5A receptors: ROR2 and RYK. We found that epithelial ROR2 is dispensable for midgut elongation. However, loss of Ryk phenocopies the Wnt5a-/- phenotype, perturbing post-mitotic pathfinding and leading to apoptosis. These studies reveal that the ligand-receptor pair WNT5A-RYK acts as a navigation system to instruct filopodial pathfinding, a process that is crucial for continuous cell cycling to fuel rapid midgut elongation.

Keywords: Gut elongation; Interkinetic nuclear migration; Pseudostratified; ROR2; RYK; WNT5A.


Conflict of interest statement

Competing interestsThe authors declare no competing or financial interests.

Figures

Fig. 1.
Fig. 1.
Ror2 is expressed in both midgut epithelium and mesenchyme, but epithelial Ror2 is dispensable for gut elongation. (A-E) Immunostaining of ROR2 (white) on cross-sections of the central wild-type midgut at E10.5-E14.5. Scale bars: 20 µm. (F-H′) Immunostaining of ROR2 (white) and fluorescence of membrane tdTomato (magenta) on E14.5 midgut sections. (G-H′) Higher magnifications of boxed epithelial (G,G′) and mesenchymal (H,H′) regions in F. In G′, the yellow dashed line outlines the apical surface. Scale bars: 20 µm. (I-K″) RNAscope in situ hybridization with probes for Ror2 on cross-sections of the central midgut at E10.5, E12.5 and E14.5. (K′,K″) Higher magnifications of the boxed epithelial (K′) and mesenchymal (K″) regions in K. The epithelial-mesenchymal interface is outlined by dashed white lines. Scale bars: 20 µm. (L-O) E14.5 embryos and isolated gastrointestinal (GI) tracts of the control (L,M) and epithelial Ror2 knockout (N,O). Scale bars: 1 mm. (P-S) Immunostaining of ROR2 (white) and fluorescence of membrane tdTomato (magenta) and membrane eGFP (mG, green) on cross-sections of control (P,Q) and epithelial Ror2 knockout (R,S) midgut at E14.5. Scale bars: 20 µm. (T,U) Quantitation of midgut length (from the pylorus to the cecum) and crown-rump length of embryos at E14.5 (T) and E18.5 (U) with (gray) or without (green) epithelial ROR2. At E14.5, Ror2flox/+; ShhCre/+, n=3; Ror2flox/flox and Ror2flox/+, n=6; Ror2flox/flox; ShhCre/+, n=4. At E18.5, Ror2flox/+; ShhCre/+, n=4; Ror2flox/flox and Ror2flox/+, n=12; Ror2flox/flox; ShhCre/+, n=4. (V-X) Quantitation of basal circumference, epithelial height and nuclei number on cross-sections of the central midgut epithelial tubes with or without epithelial ROR2. Quantification was performed on 25 sections of five control samples and 20 sections of four Ror2flox/flox; ShhCre/+ samples. For the basal circumference and nuclei number, one measurement was taken per section; for the epithelial height, three or four measurements were taken per section. Data are mean±s.e.m. Analyses were performed using unpaired nonparametric tests (Mann–Whitney test). n.s., not significant.
Fig. 2.
Fig. 2.
Mesenchymal ROR2 is required for midgut elongation before Phase I. (A-D) E14.5 embryos and GI tracts of control (A,B) and mesenchymal Ror2 knockout (C,D). Scale bars: 1 mm. (E-F′) Immunostaining of ROR2 (white) and fluorescence of mT (magenta) and mG (green) on cross-sections of control (E,E′) and mesenchymal Ror2 knockout (F,F′) midguts at E14.5. Scale bars: 20 µm. (G) Quantitation of midgut length and embryo length of control (black) and mesenchymal Ror2 knockout (blue) at E14.5. Ror2flox/+ ;Twist2Cre/+, n=5; Ror2flox/flox and Ror2flox/+, n=8; Ror2flox/flox; Twist2Cre/+, n=8. (N) Experimental approach for temporal ROR2 depletion by tamoxifen administration to mouse dams starting at E9 or at E10.5. (H-K,O-R) E14.5 embryos and GI tracts with tamoxifen treatment starting at E9 (H-K) or E10.5 (O-R). Scale bars: 1 mm. (L-M′,S-T′) Immunostaining of ROR2 (white) and fluorescence of mT (magenta) and mG (green) on E14.5 midgut sections of the control (L,L′,S,S′) and ROR2 depletion beginning at E9 (M,M′) or E10.5 (T,T′). Scale bars: 20 µm. (U) Quantitation of midgut length in control embryos (black) and embryos with ROR2 depletion starting at E9 or E10.5 (purple). For tamoxifen treatment from E9, Ror2flox/flox, n=9; Ror2flox/flox; UbcCreERT2/+, n=5. For tamoxifen treatment from E10.5, Ror2flox/flox, n=9; Ror2flox/flox; UbcCreERT2/+, n=7. Data are mean±s.e.m. Analyses were performed using unpaired nonparametric tests (Mann–Whitney test). *P<0.05, **P<0.01, ***P<0.001, n.s., not significant.
Fig. 3.
Fig. 3.
RYK is required for midgut elongation throughout Phase I. (A-E′) RNAscope of Ryk on sections of wild-type midguts at E10.5-E14.5. (A′-E′) Higher magnifications of A-E. The epithelial-mesenchymal interface is outlined by white dashed lines. Epi, epithelium; Mes, mesenchyme. Scale bars: 20 µm. (F-Q) Embryos and GI tracts of the wild-type (F,H,J,L,N,P) and Ryk null (G,I,K,M,O,Q) at E10.5, E12.5 and E14.5. Scale bars: 1 mm. (R) Quantitation of midgut length and embryo length of Ryk+/+ (black), Ryk+/− (gray) and Ryk−/− (brown) at E12.5 and E14.5. At E12.5, Ryk+/+, n=3; Ryk+/−, n=5; Ryk−/−, n=3. At E14.5, Ryk+/+, n=8; Ryk+/−, n=14, Ryk−/−, n=5. (S) Dynamics of midgut lengthening in Ryk+/+ (black), Ryk+/− (gray) and Ryk−/− (brown) embryos from E10.5 to E14.5. Ryk+/+: n=5 (E10.5), n=4 (E11.5), n=3 (E12.5), n=7 (E13.5), n=8 (E14.5); Ryk+/−: n=7 (E10.5), n=6 (E11.5), n=5 (E12.5), n=12 (E13.5), n=15 (E14.5); Ryk−/−: n=3 (E10.5), n=3 (E11.5), n=3 (E12.5), n=5 (E13.5), n=5 (E14.5). (T-W′) Immunostaining for Ki67 (T-U′) and pHH3 (V-W′) on cross-sections of the central Ryk+/+ and Ryk−/− midgut at E14.5. (T′,U′,V′,W′) Higher magnification of boxed areas in T,U,V,W, respectively. Scale bars: 20 µm. (X) Quantitation of mitosis rate (% pHH3 cells) in the epithelium of control and Ryk−/− midguts. Measurements were performed on 20 sections of five control samples and 16 sections of four Ryk−/− samples at E10.5; 30 sections of three control samples and three Ryk−/− samples at E12.5; 40 sections of five control samples and five Ryk−/− samples at E14.5. Data are mean±s.e.m. Analyses were performed using unpaired nonparametric tests (Mann–Whitney test). *P<0.05, **P<0.01; n.s., not significant.
Fig. 4.
Fig. 4.
RYK is essential for the proper basal connection of epithelial cells during Phase I midgut elongation. (A) Experimental approach for labeling large epithelial mG clones in control and Ryk−/− midgut for 3D confocal imaging. (B) 2D lateral (yz) view of a segment of midgut containing two separate, large clones (white boxes). Scale bar: 30 µm. (C) Definition of xyz dimensions of the midgut tube. (D-I) 3D confocal z-stacks (xy view) of large clones in control (D,E) and Ryk−/− (F-I) midguts. Apical and basal surfaces are outlined by white dashed lines. White arrows indicate cells lacking a basal connection in the epithelium; yellow arrows indicate epithelial cells in the lumen. Scale bars: 20 µm. (J) Quantitation of the number of cells with or without a basal connection in control and Ryk−/− large clones. Control, 45 clones from six midguts; Ryk−/−, 33 clones from five midguts. Data are mean±s.e.m. (K) Distribution of clones containing 0, 1, 2 or 3 cells that are unconnected to the basal surface. Thirty-three clones from five Ryk−/− midguts were analyzed.
Fig. 5.
Fig. 5.
In the absence of RYK, some ‘pathfinding’ daughter cells fail to grow a basally directed filopodial protrusion to make a basal connection. (A) Strategy for generating one- or two-cell clones in control and Ryk−/− midgut epithelial tubes at E13.5 for confocal imaging. (B-E) 3D reconstructions of Mode I daughter pairs in control (B,B′) and Ryk−/− (C-E) midguts. Normal basally oriented filopodial protrusions (B,C) are indicated by white arrowheads. B′ shows higher magnifications of the bottom regions of pathfinding cells shown in B: the basal tip of recently divided cells (1′,2′); early filopodial projection (3′,4′); filopodial thickening and basal connection (5′-8′). In D, cells with no filopodial protrusion are indicated by yellow arrowheads. In E, abnormal protrusions are indicated by red arrowheads; the yellow arrowhead in E8 indicates a pre-apoptotic cell. Scale bars: 5 µm. (F-J) 3D reconstructions of Mode II pairs in control (F) and Ryk−/− (G-J) midguts. Normal basally oriented filopodial protrusions are indicated by white arrowheads in F,G,J; abnormal protrusions are indicated by red arrowheads in H-J; the inherited basal processes are indicated by blue arrowheads in F-H,J. The yellow arrowheads in I5 indicate a fragmented cell. Scale bars: 5 µm.
Fig. 6.
Fig. 6.
RYK facilitates efficient basal tethering of ‘pathfinding’ cells, which is essential for a timely nuclear return. (A-Q) Live imaging of the basal return of Mode I (A-H) and Mode II pairs (I-Q) in control (A,I) and Ryk−/− midguts (B-H; J-Q). Sequential 2D images taken at labeled time points (minutes) are displayed; time 0 marks the mitosis. White arrowheads indicate normal filopodial protrusions; red arrowheads indicate abnormal protrusions; yellow arrowheads indicate apoptotic cells. White dotted lines mark the basal surface. Scale bars: 10 µm. (R) Quantitation of nuclear return time for Mode I daughter a and b, and Mode II daughter c and d in control (black) and Ryk−/− (brown) midguts. Solid squares and circles reflect the actual returning time. Open squares and circles reflect the time that nuclei stay at the apical side during the recording. Ninety-one daughter pairs from five control midguts and 176 pairs from six Ryk−/− midguts were analyzed. Data are mean±s.e.m.
Fig. 7.
Fig. 7.
Increased apoptosis contributes to the length deficit of the Ryk−/− midgut epithelial tube. (A-C′) Immunostaining of cleaved caspase 3 (magenta), pHH3 (green), F-actin (white) and nuclei (blue) on cross-sections of control (A,A′) and Ryk−/− (B-C′) midguts at E14.5. (A′,B′,C′) Higher magnifications of boxed regions. Scale bars: 20 µm. (D) Quantitation of apoptotic ratio (cleaved caspase 3 fragment number/total epithelial cell number) on cross-sections of control and Ryk−/− midguts. Analyses were performed on 55 sections of five control samples and 125 sections of five Ryk−/− samples at E12.5, 110 sections of five control samples and 140 sections of seven Ryk−/− samples at E14.5. Data are mean±s.e.m. Analyses were performed using unpaired nonparametric tests (Mann–Whitney test), ****P<0.0001. (E) Mathematical model (see details in Materials and Methods). Solid lines reflect the fold changes in wild-type (a, black) and Ryk−/− (b, brown) epithelial cell population based on experimental measurements (Fc); dotted lines (c-f) reflect the fold changes in epithelial cell population based on mathematical modeling (fc). (c) The idealized growth curve, with a starting cell population (N0) that equals the wild-type cell population at E11.5; (d) the idealized growth curve with N0 adjusted to the Ryk−/− cell population at E11.5. Gray dotted lines are modeled growth curves after introducing 5% (e) or 10% (f) apoptosis to (d). (F) Summary of when and where WNT5A, ROR2 and RYK contribute to midgut elongation. The fetal SI elongation can be divided into three stages: primordial stage, Phase I and Phase II. WNT5A is expressed in the midgut mesenchyme, while the WNT5A receptors ROR2 and RYK are expressed in both epithelium and mesenchyme. WNT5A and RYK are required for midgut elongation before and during Phase I. In contrast, ROR2 acts in the mesenchymal compartment to drive midgut elongation only in the primordial stage. ND, not determined. (G) Schematic illustration of pathfinding defects in Ryk−/− midgut epithelium. During Phase I, without RYK, some pathfinding cells (b, c, d) do not grow filopodia (2), form short protrusions in a random direction (2′) or odd-shaped protrusions (2″). These cells eventually fail to make a basal connection, leading to increased apoptosis and a shortened gut.

Similar articles

Cited by

References

    1. Al-Shawi R., Ashton S. V., Underwood C. and Simons J. P. (2001). Expression of the Ror1 and Ror2 receptor tyrosine kinase genes during mouse development. Dev. Genes Evol. 211, 161-171. 10.1007/s004270100140 - DOI - PubMed
    1. Andre P., Wang Q., Wang N., Gao B., Schilit A., Halford M. M., Stacker S. A., Zhang X. and Yang Y. (2012). The Wnt coreceptor Ryk regulates Wnt/planar cell polarity by modulating the degradation of the core planar cell polarity component Vangl2. J. Biol. Chem. 287, 44518-44525. 10.1074/jbc.M112.414441 - DOI - PMC - PubMed
    1. Bitgood M. J. and Mcmahon A. P. (1995). Hedgehog and Bmp Genes Are Coexpressed at Many Diverse Sites of Cell-Cell Interaction in the Mouse Embryo. Dev. Biol. 172, 126-138. 10.1006/dbio.1995.0010 - DOI - PubMed
    1. Cervantes S., Yamaguchi T. P. and Hebrok M. (2009). Wnt5a is essential for intestinal elongation in mice. Dev. Biol. 326, 285-294. 10.1016/j.ydbio.2008.11.020 - DOI - PMC - PubMed
    1. Chiang T.-S., Wu H.-F. and Lee F.-S. (2017). ADP-ribosylation factor-like 4C binding to filamin-A modulates filopodium formation and cell migration. Mol. Biol. Cell 28, 3013-3028. 10.1091/mbc.e17-01-0059 - DOI - PMC - PubMed

Publication types

Substances