. 2020 Dec;19(12):2068-2090.
doi: 10.1074/mcp.RA120.002012. Epub 2020 Sep 29.

Kinome Profiling of Primary Endometrial Tumors Using Multiplexed Inhibitor Beads and Mass Spectrometry Identifies SRPK1 as Candidate Therapeutic Target

Affiliations

Kinome Profiling of Primary Endometrial Tumors Using Multiplexed Inhibitor Beads and Mass Spectrometry Identifies SRPK1 as Candidate Therapeutic Target

Alison M Kurimchak et al. Mol Cell Proteomics. 2020 Dec.

Abstract

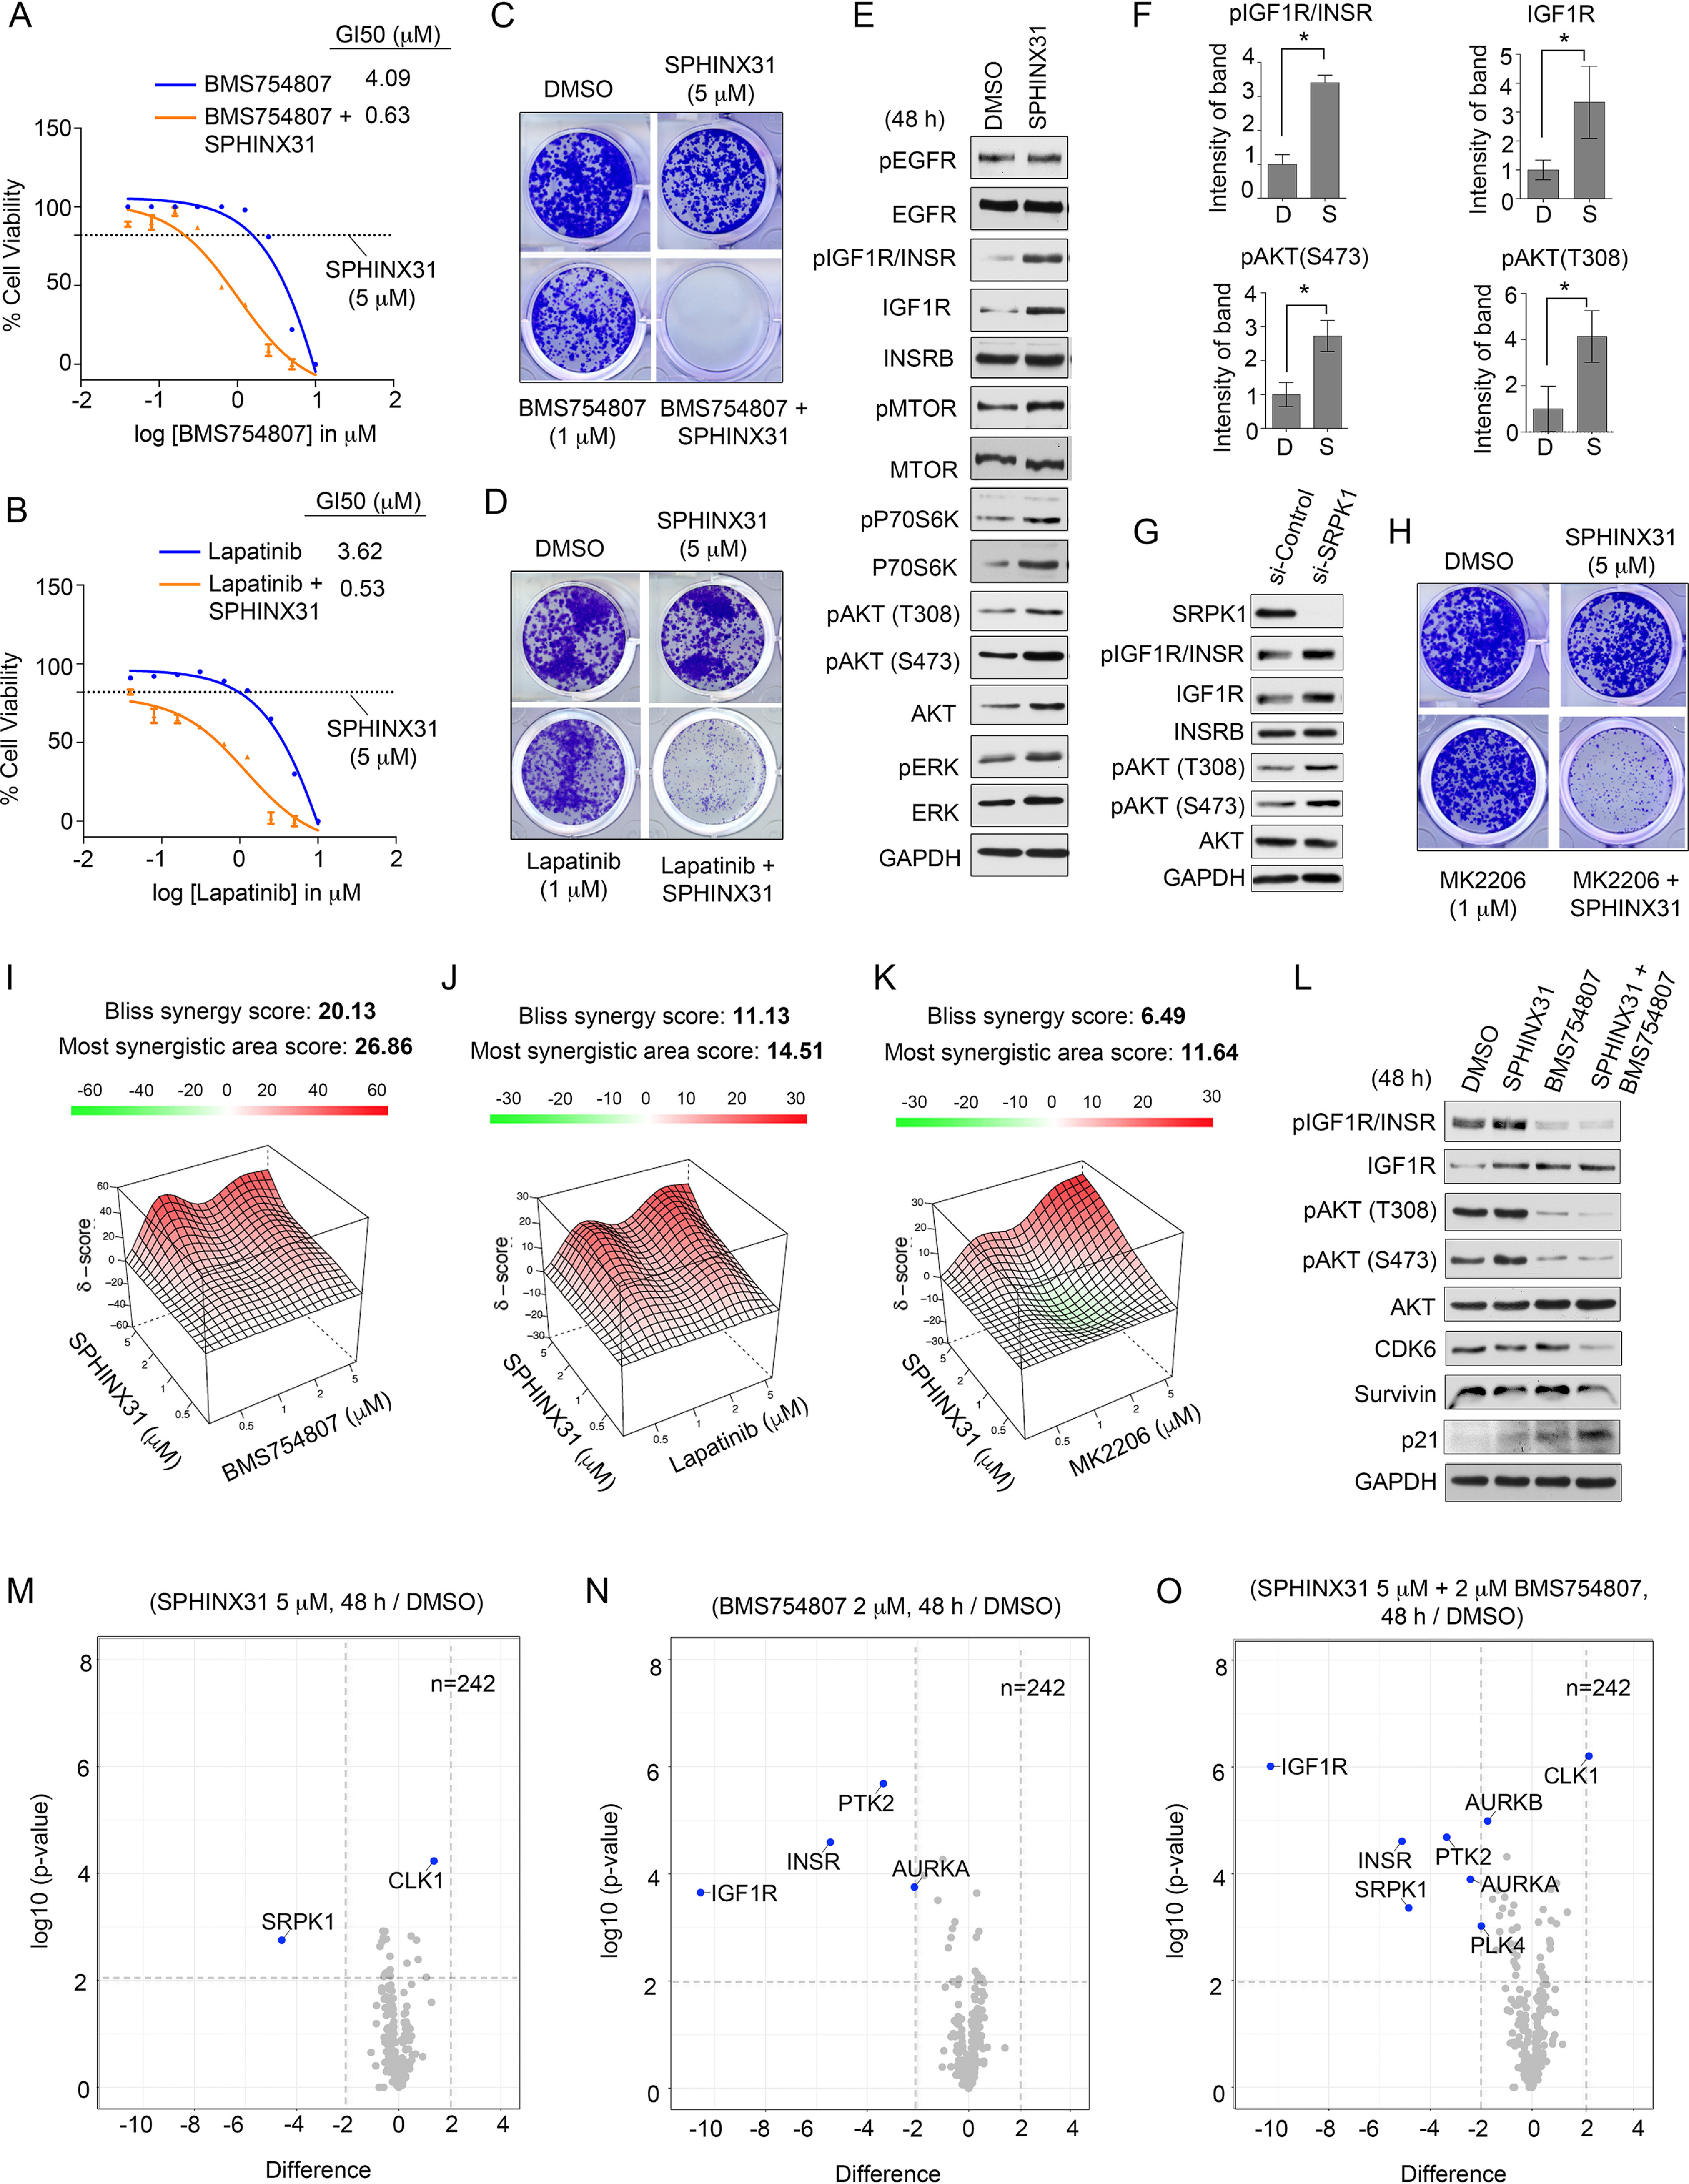
Endometrial carcinoma (EC) is the most common gynecologic malignancy in the United States, with limited effective targeted therapies. Endometrial tumors exhibit frequent alterations in protein kinases, yet only a small fraction of the kinome has been therapeutically explored. To identify kinase therapeutic avenues for EC, we profiled the kinome of endometrial tumors and normal endometrial tissues using Multiplexed Inhibitor Beads and Mass Spectrometry (MIB-MS). Our proteomics analysis identified a network of kinases overexpressed in tumors, including Serine/Arginine-Rich Splicing Factor Kinase 1 (SRPK1). Immunohistochemical (IHC) analysis of endometrial tumors confirmed MIB-MS findings and showed SRPK1 protein levels were highly expressed in endometrioid and uterine serous cancer (USC) histological subtypes. Moreover, querying large-scale genomics studies of EC tumors revealed high expression of SRPK1 correlated with poor survival. Loss-of-function studies targeting SRPK1 in an established USC cell line demonstrated SRPK1 was integral for RNA splicing, as well as cell cycle progression and survival under nutrient deficient conditions. Profiling of USC cells identified a compensatory response to SRPK1 inhibition that involved EGFR and the up-regulation of IGF1R and downstream AKT signaling. Co-targeting SRPK1 and EGFR or IGF1R synergistically enhanced growth inhibition in serous and endometrioid cell lines, representing a promising combination therapy for EC.

Keywords: affinity proteomics; cancer biomarker(s); combination therapies; endometrial carcinoma; kinases; kinome; pathway analysis; splicing; therapeutic targets; tissue proteomics.


Conflict of interest statement

Conflict of interest—The authors declare that they have no conflicts of interest with the contents of this article.

Figures

None
Graphical abstract
Fig. 1.
Fig. 1.
Profiling the Endometrial Cancer Kinome Using Quantitative MIB-MS. A, Workflow of kinome profiling of endometrial tumors and normal endometrial tissues using MIB-MS with kinases quantitated using LFQ and super-SILAC. B, Kinome tree depicts coverage of kinases measured by LFQ, s-SILAC or both LFQ and s-SILAC in endometrial tissues. The kinome tree was generated in KinMap and was reproduced courtesy of Cell Signaling Technology. Data are from one independent assay per sample in 20 tumor tissues and 16 normal tissues. C, Box plots depict the average number of kinases measured by LFQ or s-SILAC per individual MIB-run. D, Bar graph shows the number of kinases measured by LFQ or s-SILAC at >90% frequency across all tissue MIB-MS runs. The frequency of kinases across datasets was determined using Perseus software. E, Hierarchical clustering of kinase log2 LFQ z-scores of endometrial tumors (n = 20) and normal tissues (n = 16), as determined by MIB-MS. F, PCA analysis, including PC1 versus PC2 of kinase log2 LFQ intensities of endometrial tumors (n = 20) and normal tissues (n = 16), as determined by MIB-MS.
Fig. 2.
Fig. 2.
Identification of Kinases Overexpressed in Endometrial Tumors Relative to Normal Tissues. A, Volcano plot depicts kinases elevated or reduced in endometrial tumors (n = 20) relative to normal endometrial tissues (n = 16). Differences in kinase log2 LFQ intensities among tumors and normal tissues determined by paired t test Benjamini-Hochberg adjusted P values at FDR of <0.05 using Perseus software. Each tissue sample was run in biological duplicate (n = 2) and kinase log2 LFQ intensities averaged. Kinases exhibiting a ≥2-fold difference and P value ≤0.01 among tumors versus normal are depicted in volcano plot. B, Scatterplot depicts the overlap in kinases elevated or reduced determined by LFQ or s-SILAC. Regression analysis (R2) among quantitative methods was performed in Perseus Software. Differential expressed kinases identified by LFQ and s-SILAC quantitation (FDR <0.05) are labeled. C, Bar graph depicts high-confident kinase log2 LFQ intensities overexpressed in endometrial tumors determined by LFQ and s-SILAC quantitation (FDR <0.05). D, Bar graph depicts medium-confident kinase log2 LFQ intensities overexpressed in endometrial tumors identified by either LFQ or s-SILAC quantitation (FDR <0.05) but exhibiting a similar trend in expression difference. E, Associated pathways of kinases overexpressed in endometrial tumors relative to normal endometrial tissues determined by quantitative MIB-MS profiling. Pathway analysis was performed using Metascape. Kinases previously investigated as a target or identified as a biomarker of endometrial cancer are depicted with asterisks.
Fig. 3.
Fig. 3.
SRPK1 Is Overexpressed in Endometrial Tumors and Associated with Poor Survival. A, Plot depicts relative protein abundance of SRPK1 in endometrial tumors (n = 95) relative to normal endometrial tissues (n = 45) queried from CPTAC analysis of endometrial cancer (32). Data represent log2 transformed relative abundance values of SRPK1 across tissues determined by TMT-based quantitation. Statistical differences in SRPK1 log2 relative abundance values comparing tumors versus normal tissues was determined by paired t test Benjamini-Hochberg adjusted P values at FDR of <0.05. B, Analysis of SRPK1 copy number analysis (CNA), mRNA and mutation changes in EC tumors from Uterine (TCGA PanCancer Atlas 2018) studies (39). mRNA levels were determined by U133 microarray and change in SRPK1 abundance among tumors determined at z-score > 1 or < −1. C, Survival plot of HGSOC patients with SRPK1 expression segregated into lower (low - blue), middle (no change - gray) and upper quartiles (up - orange) show statistically significant difference in overall survival. Survival data were obtained from TCGA data (39). D, IHC analysis of SRPK1 in endometrial tumor TMAs. A pathologist evaluated immunoreactivity of SRPK1 protein and IHC score was given based on the intensity of protein stain. Data are from duplicate analysis of 57 endometrial tumors (39 serous and 18 endometrioid) and 12 normal tissues. E, Box plots shows elevated SRPK1 protein abundance determined by IHC in endometrioid and serous subtypes of endometrial tumors relative to normal tissues. Differences in SRPK1 IHC scores comparing endometrial tumors versus normal tissues determined by paired t test Benjamini-Hochberg adjusted P values at FDR of <0.05 using Perseus software. F, Immunoblot of SRPK1 in matched patient endometrial tumors and normal tissues. G, Box plot shows elevated SRPK1 protein levels in endometrial tumors (n = 18) relative to matched normal tissues (n = 18) determined by SRPK1 immunoblot. Densitometric analysis of immunoblots presented in (F and supplemental Fig. S3D). Values indicate the optical density of total protein levels from an immunoblot normalized to total protein content (loading control, GAPDH). Quantitation of immunoblot bands was performed in ImageJ. Differences in SRPK1 protein abundance among endometrial tumors versus normal tissues was determined by paired t test Benjamini-Hochberg adjusted P values at FDR of <0.05.
Fig. 4.
Fig. 4.
Inhibition of SRPK1 Reduces Viability of USC Cells and Induces Apoptosis Under Nutrient-deprived Conditions. A, Immunoblot for SRPK1 confirms sufficient knockdown by SRPK1 siRNAs. SPEC-2 cells were transfected with siRNAs targeting SRPK1 or with control siRNA, cultured for 72 h, lysed, and immunoblotted for SRPK1 protein abundance. B, CellTiter-Glo assay for cell viability of established USC cell line SPEC-2 transfected with siRNAs targeting SRPK1 or with control siRNA and cultured for 120 h. Data were analyzed as % cell viability presented as means ± S.D. of 3 independent assays. *P ≤ 0.05 by Student's t test. C, Volcano plot depicts MIB-MS kinome profile of SPEC-2 cells treated with SPHINX31 for 4 h. SPEC-2 cells were treated with 5 μm SPHINX31 or DMSO for 4 h and lysates incubated with MIB-beads. Volcano plot shows difference in kinase log2 LFQ intensities in SPHINX31 treated versus control-treated SPEC-2 cells. Biological triplicates SPHINX31 (n = 3) and DMSO (n = 3) were MIB-profiled. D, CellTiter-Glo assay for cell viability of SPEC-2 cell lines treated with increasing concentrations of SPHINX31 or DMSO and cultured for 120 h. Data were analyzed as % cell viability of DMSO control presented as means of 3 independent assays. E, Long-term 12-day colony formation assay of SPEC-2 cells treated with SPHINX31 or DMSO. Colony formation was assessed by crystal violet staining. Representative images of 3 biological replicates. F, Crystal violet absorbance assays for cell viability of SPEC-2 cell lines cultured in the presence (+FBS) or absence (-FBS) of serum and treated with 5 μm SPHINX31 or DMSO for 24 h. Data were analyzed as % absorbance of DMSO control presented as means of 3 biological replicates. G, Apoptosis assessed by immunoblotting for cleaved-PARP abundance in serum-competent (+FBS) or serum-starved (-FBS) SPEC-2 cells treated with DMSO or 5 μm of SPHINX31 for 24 h. Blots are representative of 3 independent experiments.
Fig. 5.
Fig. 5.
Proteogenomics Characterization of SRPK1 Inhibition in SPEC-2 Cells. A. Proteomics workflow for exploring the function of SRPK1 in SPEC-2 cells. Serum-competent (+FBS) or serum-starved (-FBS) SPEC-2 cells were treated with 5 μm SPHINX31 for 24 h, subjected to single-run proteome analysis and differences in protein abundance determined by LFQ. BC, Volcano plots depict proteins induced or repressed by SPHINX31 treatment in +FBS (B) or –FBS (C) SPEC-2 cells. Differences in protein log2 LFQ intensities among SPHINX31 or DMSO treated SPEC-2 cells was determined by paired t test Benjamini-Hochberg adjusted P values at FDR of <0.05 using Perseus software. Proteins induced by SPHINX31 treatment are labeled red whereas those reduced by SRPK1 inhibition are labeled blue. D–E, Hierarchical clustering of pathways up-regulated (D) or down-regulated (E) by SPHINX31 treatment in serum-competent (+FBS) or serum-starved (-FBS) SPEC-2 cells. Proteins induced or repressed by SPHINX31 treatment (FDR < 0.05) were imported into Metascape pathway analysis. Heat map color depicts P values for pathway enrichment. gray colors indicate the lack of pathway enrichment for that term in the protein list. F, Schematic illustrating the type and number of alternative splicing events identified by RNA-seq in SPHINX31 treated (5 μm) SPEC-2 cells. G, Immunoblot shows increased protein levels of the VEGF165b isoform in response to SPHINX31 treatment for 24 h. H, Bar graph depicts the optical density levels of total VEGF165b isoform from an immunoblot normalized to total protein content expressed as a percent change (SPHINX31/DMSO). Quantitation of immunoblot bands was performed in ImageJ using 3 independent biological replicates. *P ≤ 0.05 by Student's t test. I, Immunoblot for VEGF165b in SPEC-2 cells following knockdown by SRPK1 siRNAs. SPEC-2 cells were transfected with siRNAs targeting SRPK1 or with control siRNA, cultured for 72 h, lysed, and immunoblotted for VEGF165b protein abundance. J, Circos plot shows overlap in pathway enrichment analysis among splice targets (splicing analysis), proteins (proteomics) or mRNAs (RNA-seq) down-regulated by SPHINX31 treatment in serum-starved SPEC-2 cells. K, Hierarchical clustering of pathways commonly enriched in alternatively spliced targets, and those proteins or mRNAs down-regulated by SPHINX31 treatment in serum-starved SPEC-2 cells. Alternatively spliced genes, proteins, or mRNA repressed by SPHINX31 treatment (FDR < 0.05) were imported into Metascape pathway analysis. Heat map color depicts P values for pathway enrichment. Grey colors indicate the lack of pathway enrichment for that term in the protein list. L, Apoptosis and cell cycle markers assessed by immunoblotting for cleaved PARP and p21 abundance in serum-starved (-FBS) SPEC-2 cells treated with DMSO or 5 μm SPHINX31 for 24 h. Blots are representative of 3 independent experiments.
Fig. 6.
Fig. 6.
EGF and IGF-1 Receptor Signaling Promotes Resistance to SPHINX31 in SPEC-2 Cells. AB, CellTiter-Glo assay for cell viability of serum-competent SPEC-2 cell lines treated with increasing concentrations of (A) BMS754807, BMS754807 + 5 μm SPHINX31, 5 μm SPHINX31 or DMSO, or (B) lapatinib, lapatinib + 5 μm SPHINX31, 5 μm SPHINX31 or DMSO and cultured for 120 h. Data were analyzed as % cell viability of DMSO control; presented as means of 3 independent assays. GI50 values were generated in Prism. CD, Long-term 12-day colony formation assay of SPEC-2 cells treated with (C) DMSO, 1 μm BMS754807, 5 μm SPHINX31 or 1 μm BMS754807 + 5 μm SPHINX31 or (D) DMSO, 1 μm lapatinib, 5 μm SPHINX31 or 1 μm lapatinib + 5 μm SPHINX31. Colony formation was assessed by crystal violet staining. Representative images of 3 biological replicates. E, Immunoblot analysis of the consequence of SPHINX31 treatment on EGF and IGF-1 receptors and downstream signaling in SPEC-2 cells. SPEC-2 cells were treated with 5 μm SPHINX31 for 24 h and total protein abundance and activating phosphorylation of signaling components determined by immunoblot. Blots are representative of 3 independent experiments. F, Values indicate the optical density levels of total and phosphorylated IGF1R (Y1135/1136) or phosphorylated AKT (S473) or (T308) from an immunoblot normalized to total protein content expressed as a percent change (SPHINX31/DMSO). Phosphorylated proteins were normalized to loading control, then normalized to total abundance of the respective protein. Quantitation of immunoblot bands was performed in ImageJ using 3 independent biological replicates. *P ≤ 0.05 by Student's t test. G, Immunoblot analysis IGF1R/AKT axis in SPEC-2 cells transfected with SRPK1 or control siRNAs and cultured for 72 h. H, Long-term 12-day colony formation assay of SPEC-2 cells treated with (C) DMSO, 1 μm MK2206, 5 μm SPHINX31 or 1 μm MK2206 + 5 μm SPHINX31. Colony formation was assessed by crystal violet staining. Representative images of 3 biological replicates. I–K, Drug synergy analysis of (I) BMS754807, (J) lapatinib, (K) MK2206 in combination with SPHINX31 in SPEC-2 cells (n = 3). L, Immunoblot analysis of SPHINX31 and BMS754807 combination in SPEC-2 cells. SPEC-2 cells were treated with DMSO, 2 μm BMS754807, 5 μm SPHINX31 or 2 μm BMS754807 + 5 μm SPHINX31 and IGF1R/AKT signaling axis assessed by immunoblot. Blots are representative of 3 independent experiments. M-O, Volcano plot depicts MIB-MS kinome profile of SPEC-2 cells treated with (M) SPHINX31, (N) BMS754807 or (O) SPHINX31 + BMS754807. SPEC-2 cells were treated with DMSO, 2 μm BMS754807, 5 μm SPHINX31 or 2 μm BMS754807 + 5 μm SPHINX31 for 48 h and lysates incubated with MIB-beads. Volcano plot shows difference in kinase log2 LFQ intensities in drug-treated versus control-treated SPEC-2 cells. Biological triplicates for each condition were used for MIB-profiling.
Fig. 7.
Fig. 7.
Combined Inhibition of SRPK1 and EGFR or IGF1R Enhances Growth Inhibition of Endometrial Cancer Cell Lines. A, CellTiter-Glo assay for cell viability of serum-competent endometrioid endometrial cancer cell lines treated with increasing concentrations of SPHINX31 or DMSO and cultured for 120 h. Data were analyzed as % cell viability of DMSO control presented as means of 3 independent assays. BD, Crystal violet absorbance assays for cell viability of ANC3A, KLE, or RL95-2 cell lines cultured in the presence (+FBS) or absence (-FBS) of serum and treated with 5 μm SPHINX31 or DMSO for 24 h. Data were analyzed as % cell viability of DMSO control presented as means of 3 biological replicates. E, Apoptosis and cell cycle markers assessed by immunoblotting for cleaved-PARP abundance in serum-competent (+FBS) or serum-starved (-FBS) RL95-2 cells treated with DMSO or 5 μm SPHINX31 for 24 h. Blots are representative of 3 independent experiments. F, CellTiter-Glo assay for cell viability of endometrioid cancer cells treated with DMSO, 5 μm SPHINX31, 1 μm lapatinib or 1 μm lapatinib + 5 μm SPHINX31 and cultured for 120 h. Data were analyzed as % cell viability of DMSO control presented as means of 3 independent assays. G, CellTiter-Glo assay for cell viability of endometrioid cancer cells treated with DMSO, 5 μm SPHINX31, 0.5 μm BMS754807 or 0.5 μm BMS754807 + 5 μm SPHINX31 and cultured for 120 h. Data were analyzed as % cell viability of DMSO control presented as means of 3 independent assays. HJ, Drug synergy analysis of SPHINX31 and BMS754807 in (H) RL95-2, (I) AN3CA or (J) KLE cells (n = 3). K, Immunoblot analysis of the consequence of SPHINX31 treatment on EGF and IGF-1 receptors and downstream signaling in RL95-2 cells. RL95-2 cells were treated with 5 μm SPHINX31 for 24 h and total protein abundance and activating phosphorylation of signaling components determined by immunoblot. Blots are representative of 3 independent experiments. L, CellTiter-Glo assay for cell viability of RL95-2 cells treated with DMSO, 5 μm SPHINX31, 1 μm MK2206 or 1 μm MK2206 + 5 μm SPHINX31 and cultured for 120 h. Data were analyzed as % cell viability of DMSO control; presented as means of 3 independent assays. M, Model for resistance to single agent SRPK1 inhibitors predicts combination therapies co-targeting EGF or IGF-1 receptor signaling to achieve durable growth repression of endometrial cancer cells.

References

    1. Siegel R. L., Miller K. D., and Jemal A. (2016) Cancer statistics, 2016. CA Cancer J. Clin. 66, 7–30 - PubMed
    1. Remmerie M., and Janssens V. (2018) Targeted Therapies in Type II Endometrial Cancers: Too Little, but Not Too Late. Int. J. Mol. Sci. 19 - PMC - PubMed
    1. Black J. D., English D. P., Roque D. M., and Santin A. D. (2014) Targeted therapy in uterine serous carcinoma: an aggressive variant of endometrial cancer. Womens Health (Lond) 10, 45–57 - PMC - PubMed
    1. Ueda S. M., Kapp D. S., Cheung M. K., Shin J. Y., Osann K., Husain A., Teng N. N., Berek J. S., and Chan J. K. (2008) Trends in demographic and clinical characteristics in women diagnosed with corpus cancer and their potential impact on the increasing number of deaths. Am. J. Obstet. Gynecol. 198, 218, e211–e216 - PubMed
    1. Hecht J. L., and Mutter G. L. (2006) Molecular and pathologic aspects of endometrial carcinogenesis. J. Clin. Oncol. 24, 4783–4791 - PubMed

Publication types

MeSH terms