. 2020 Nov 27;370(6520):eabd4250.
doi: 10.1126/science.abd4250. Epub 2020 Sep 29.

Viral epitope profiling of COVID-19 patients reveals cross-reactivity and correlates of severity

Collaborators, Affiliations

Viral epitope profiling of COVID-19 patients reveals cross-reactivity and correlates of severity

Ellen Shrock et al. Science. .

Abstract

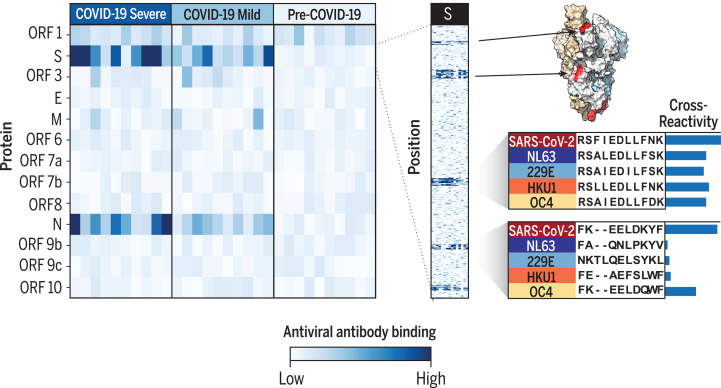
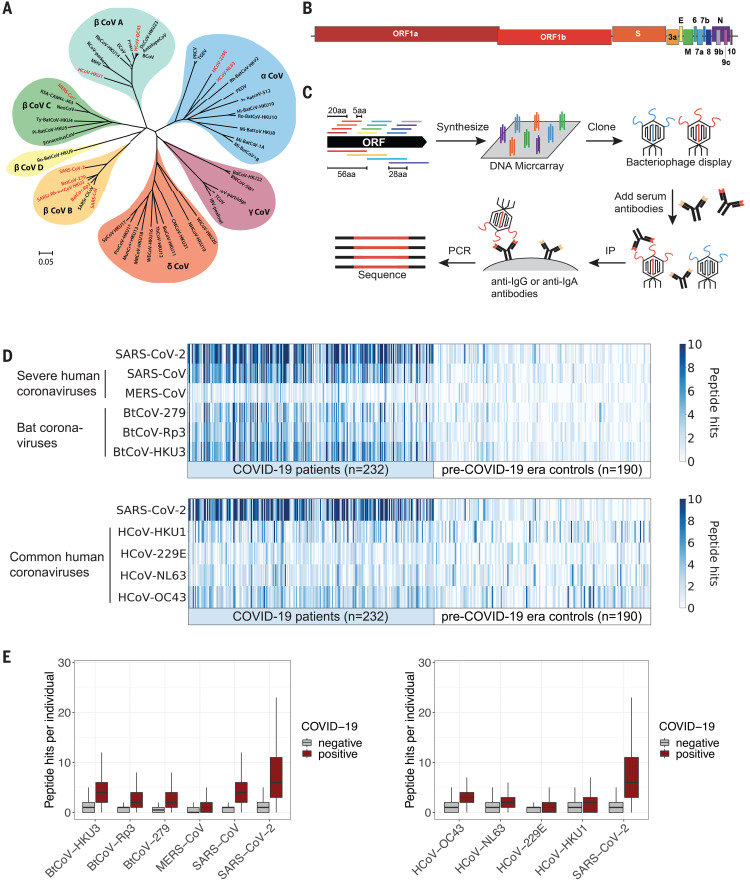
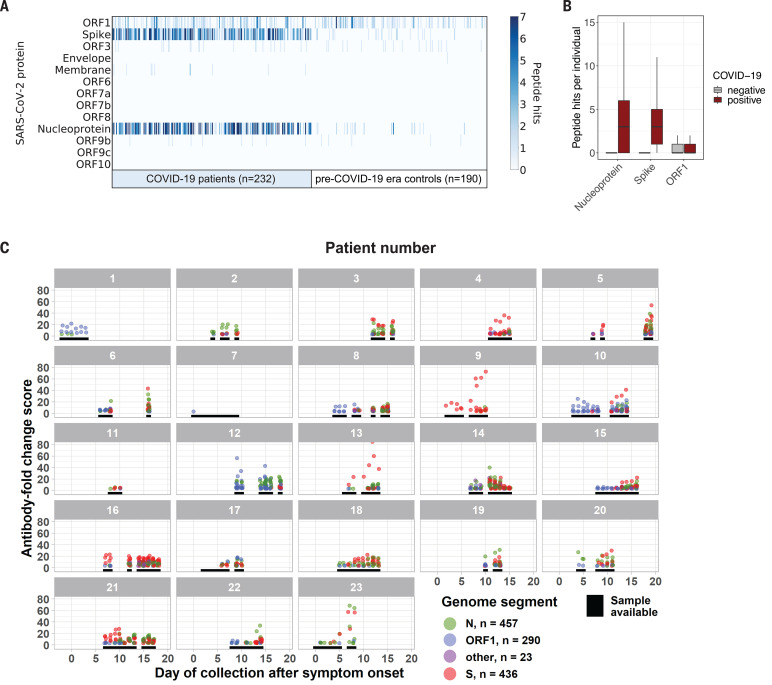
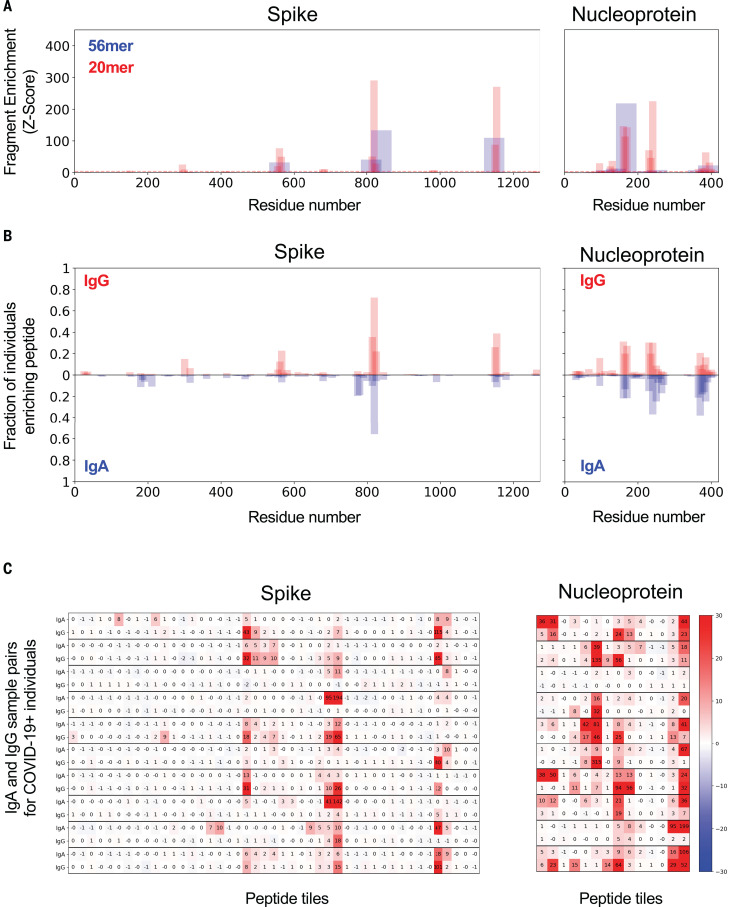
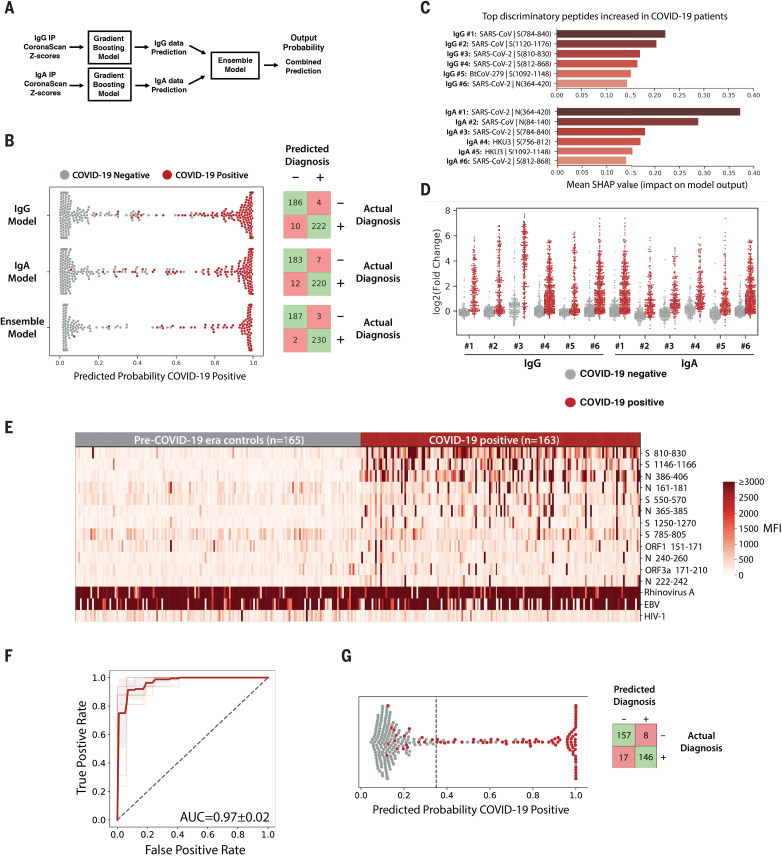
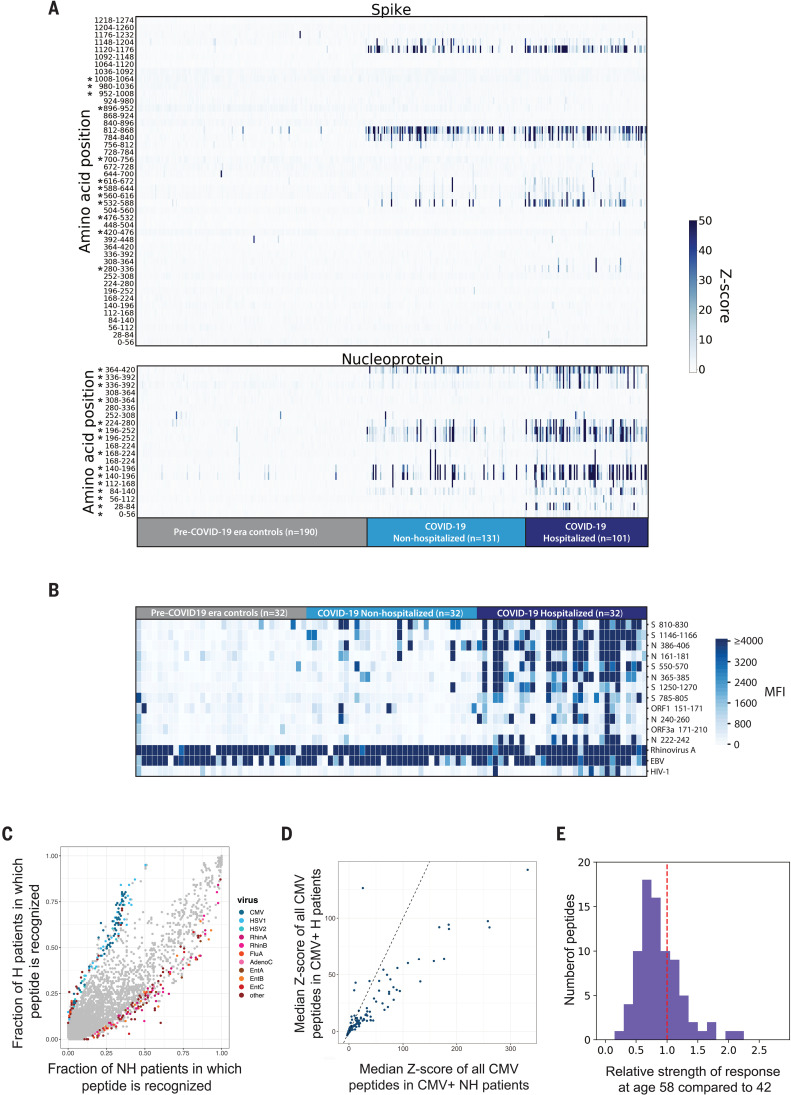
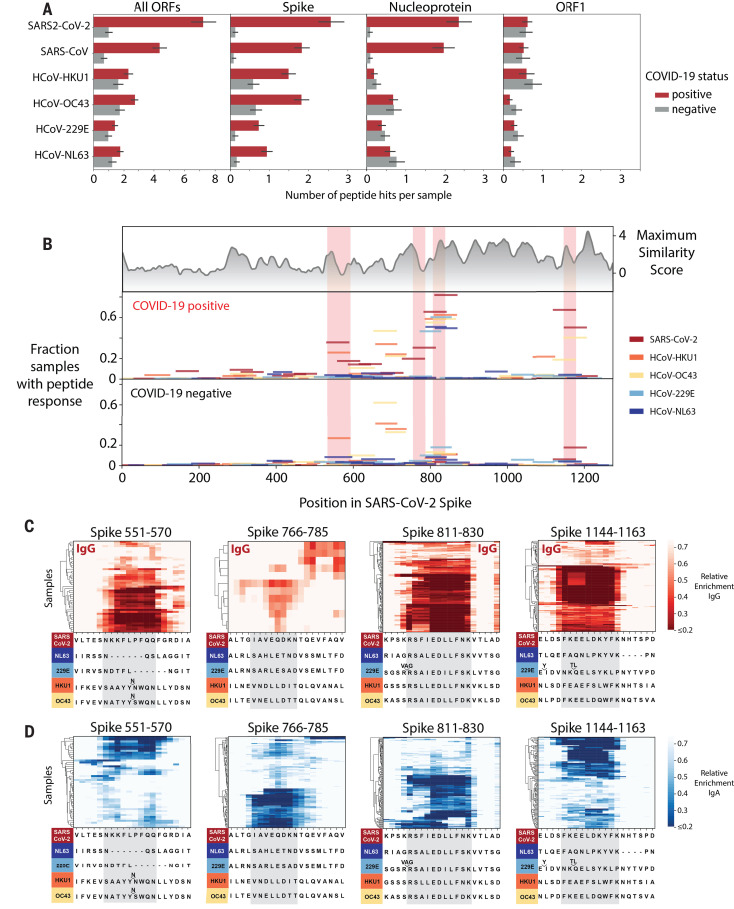
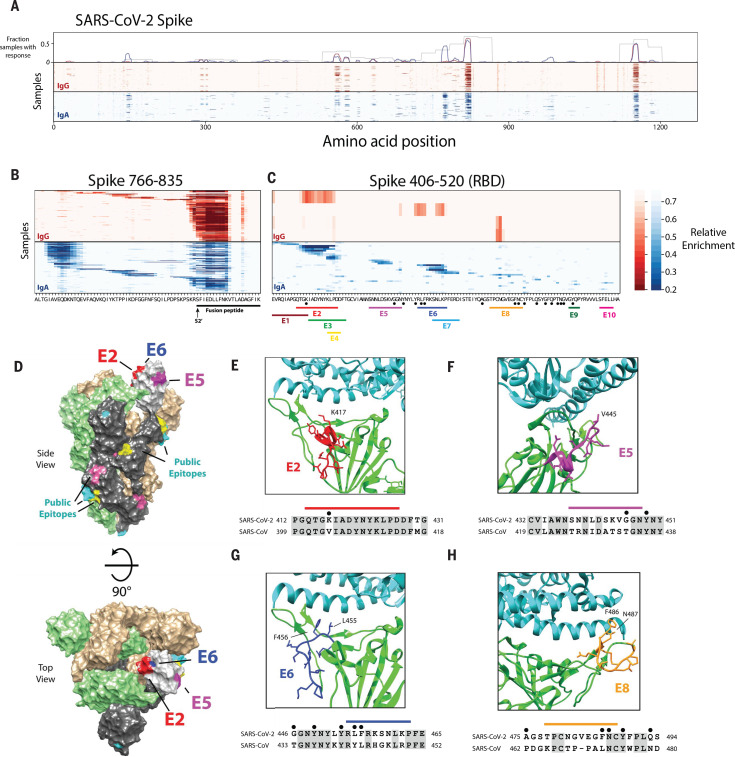
Understanding humoral responses to severe acute respiratory syndrome coronavirus 2 (SARS-CoV-2) is critical for improving diagnostics, therapeutics, and vaccines. Deep serological profiling of 232 coronavirus disease 2019 (COVID-19) patients and 190 pre-COVID-19 era controls using VirScan revealed more than 800 epitopes in the SARS-CoV-2 proteome, including 10 epitopes likely recognized by neutralizing antibodies. Preexisting antibodies in controls recognized SARS-CoV-2 ORF1, whereas only COVID-19 patient antibodies primarily recognized spike protein and nucleoprotein. A machine learning model trained on VirScan data predicted SARS-CoV-2 exposure history with 99% sensitivity and 98% specificity; a rapid Luminex-based diagnostic was developed from the most discriminatory SARS-CoV-2 peptides. Individuals with more severe COVID-19 exhibited stronger and broader SARS-CoV-2 responses, weaker antibody responses to prior infections, and higher incidence of cytomegalovirus and herpes simplex virus 1, possibly influenced by demographic covariates. Among hospitalized patients, males produce stronger SARS-CoV-2 antibody responses than females.


Figures

None
SARS-CoV-2 epitope mapping.
VirScan detects antibodies against SARS-CoV-2 in COVID-19 patients with severe and mild disease. Heatmap color represents the strength of the antibody response in each sample (columns) to each protein (rows, left) or peptide (rows, right). VirScan reveals the precise positions of epitopes, which can be mapped onto the structure of the spike protein (S). Examination of SARS-CoV-2 and seasonal coronavirus sequence conservation explains epitope cross-reactivity. A, Ala; D, Asp; E, Glu; F, Phe; I, Ile; K, Lys; L, Leu; N, Asn; P, Pro; Q, Gln; R, Arg; S, Ser; T, Thr; V, Val; W, Trp; Y, Tyr.
Fig. 1
Fig. 1. VirScan detects the humoral response to SARS-CoV-2 in sera from COVID-19 patients.
(A) Phylogeny tree of 50 coronavirus sequences (32) constructed using MEGA X (33, 34). The scale bar indicates the estimated number of base substitutions per site (35). Coronaviruses included in the updated VirScan library are indicated in red. (B) Schematic representation of the ORFs encoded by the SARS-CoV-2 genome (10, 36). (C) Overview of the VirScan procedure (–8). The coronavirus oligonucleotide library includes 56-mer peptides tiling every 28 amino acids (aa) across the proteomes of 10 coronavirus strains and 20-mer peptides tiling every 5 amino acids across the SARS-CoV-2 proteome. Oligonucleotides were cloned into a T7 bacteriophage display vector and packaged into phage particles displaying the encoded peptides on their surface. The phage library was mixed with sera containing antibodies that bind to their cognate epitopes on the phage surface; bound phage were isolated by IP with either anti-IgG– or anti-IgA–coated magnetic beads. Lastly, PCR amplification and Illumina sequencing from the DNA of the bound phage revealed the peptides targeted by the serum antibodies. (D) Detection of antibodies targeting coronavirus epitopes by VirScan. Heatmaps depict the humoral response from COVID-19 patients (n = 232) and pre–COVID-19 era control samples (n = 190). Each column represents a sample from a distinct individual. The color intensity indicates the number of 56-mer peptides from the indicated coronaviruses significantly enriched by IgG antibodies in the serum sample. (E) Box plots illustrate the number of peptide hits from the indicated coronaviruses in COVID-19 patients and pre–COVID-19 era controls. The box indicates the interquartile range, with a line at the median. The whiskers span 1.5 times the interquartile range.
Fig. 2
Fig. 2. SARS-CoV-2 protein recognition in COVID-19 patient versus control sera.
(A) Antibodies targeting SARS-CoV-2 proteins. Each column represents a distinct patient sample, and each row represents a SARS-CoV-2 protein. The color intensity in each cell of the heatmap indicates the number of 56-mer peptides, as in Fig. 1D. (B) Box plots (as in Fig. 1E) illustrate the number of peptide hits from each of the indicated SARS-CoV-2 proteins detected in the IgG antibody response of COVID-19 patients and controls. (C) Longitudinal analysis of the antibody response to SARS-CoV-2 for 23 patients with confirmed COVID-19. Black lines indicate days when a sample was available for analysis. Each point represents the maximum antibody fold-change score per SARS-CoV-2 peptide in each sample, colored by protein target.
Fig. 3
Fig. 3. IgG and IgA recognition of immunodominant regions in SARS-CoV-2 spike and nucleoprotein.
(A) Example response to S and N proteins from a single COVID-19 patient. The y axis indicates the strength of enrichment (z-score; see Materials and methods) of each 56-mer (blue) or 20-mer (red) peptide recognized by the IgG antibodies present in the serum sample. (B) Common responses to S and N proteins across COVID-19 patients. The y axis indicates the fraction of COVID-19 patient samples (n = 348) enriching each 20-mer peptide with either IgG (top) or IgA (bottom) antibodies. (C) Comparison of the IgA and IgG responses in individual COVID-19 patients. Each set of two rows represents the IgG and IgA antibody specificities of a single patient, with data displayed for 10 representative COVID-19 patients. Numeric values indicate the degree of enrichment (z-score) of each peptide tiling across the S and N proteins.
Fig. 4
Fig. 4. Machine learning models trained on VirScan data discriminate COVID-19–positive and –negative individuals with very high sensitivity and specificity.
(A) Gradient-boosting machine learning models were trained on IgG and IgA VirScan data from 232 COVID-19 patients and 190 pre–COVID-19 era controls. Separate models were created for the IgG and IgA data, and then a third model (Ensemble) was trained to combine the outputs of the first two. (B) The plot shows the predicted probability that each sample is positive for COVID-19. True COVID-19–positive samples are shown as red dots; true COVID-19–negative samples are shown as gray dots. The corresponding confusion matrix for each model is shown on the right. (C and D) SHAP analysis to identify the most discriminatory peptides informing the models in (B). The chart in (C) summarizes the relative importance of the most discriminatory peptides increased among COVID-19 patients identified by the IgG and IgA gradient-boosting models. The enrichment [log2(fold change) of the normalized read counts in the sample IP versus in no-serum control reactions] of each of these peptides across all samples is shown in (D). (E) Luminex assay using highly discriminatory SARS-CoV-2 peptides identifies IgG antibody responses in COVID-19 patients but rarely in pre–COVID-19 era controls. Each column represents a COVID-19 patient (n = 163) or pre–COVID-19 era control (n = 165); each row is a SARS-CoV-2–specific peptide. Peptides containing public epitopes from rhinovirus A, EBV, and HIV-1 served as positive and negative controls. The color scale indicates the median fluorescence intensity (MFI) signals after background subtraction. (F) Receiver operating characteristic (ROC) curve for the Luminex assay predicting SARS-CoV-2 infection history, evaluated by 10× cross-validation. The light red lines indicate the ROC curve for each test set, the dark line indicates the average, and the gray region represents ±1 SD. The average area under the curve (AUC) is shown. (G) (Left) Predicted probability that each sample is positive for COVID-19, using the Luminex model, as in (B). The dashed line indicates the model threshold. (Right) Confusion matrix for the Luminex model.
Fig. 5
Fig. 5. Correlates of COVID-19 severity.
(A) Differential recognition of peptides from SARS-CoV-2 N and S between COVID-19 nonhospitalized patients (n = 131), hospitalized patients (n = 101), and pre–COVID-19 era negative controls (n = 190). Each column represents a specific patient and each row represents a peptide tile; tiles are labeled by amino acid start and end position and may be duplicated for intervals for which amino acid sequence diversity is represented in the library. Color intensity represents the degree of enrichment (z-score) of each peptide in IgG samples. Asterisks indicate peptides that exhibit a significant increase in recognition by sera from hospitalized versus nonhospitalized patients (Kolmogorov-Smirnov test, Bonferroni-corrected P value thresholds of 0.001 for S and 0.0025 for N). (B) SARS-CoV-2 Luminex assay identifies stronger IgG responses in hospitalized COVID-19 patients than in nonhospitalized COVID-19 patients. Each column represents either a nonhospitalized (n = 32) or hospitalized (n = 32) COVID-19+ patient or a pre–COVID-19 era control (n = 32); each row represents a peptide in the Luminex assay. The color scale indicates the MFI signals after background subtraction. (C) All peptides in the VirScan library are plotted by the fraction of nonhospitalized (x axis) and hospitalized COVID-19 patient IgG samples (y axis) in which they are recognized. A z-score threshold of 3.5 was used as an enrichment cutoff to count a peptide as positive. Peptides that exhibit statistically significant associations with hospitalization status are colored by virus of origin (Fisher’s exact test, Bonferroni-corrected P value threshold of 8.52 × 10⁻⁷). All peptides that do not exhibit significant association with hospitalization status are shown in gray. The significant peptides shown are collapsed for high sequence identity. (D) All peptides derived from CMV that are present in the VirScan library are plotted by median z-score for the nonhospitalized (x axis) and hospitalized COVID-19 patients (y axis). The line y = x is shown as a dashed line. (E) Reduced recognition of mild disease–associated antigens with age. The histogram shows the relative recognition in healthy donors at age 58 compared with age 42 for each distinct antigen that was more strongly recognized by antibodies in nonhospitalized than hospitalized COVID-19 patients.
Fig. 6
Fig. 6. Cross-reactive epitopes among human coronaviruses.
(A) Bar graphs depict the average number of 56-mer peptides derived from SARS-CoV-2, SARS-CoV, and each of the four common HCoVs that are significantly enriched per sample (IgG IP). Error bars represent 95% confidence intervals. (B) Analysis of cross-reactive epitopes for HCoV S proteins. The upper plot shows the similarity of each region of the SARS-CoV-2 S protein to the corresponding region in the four common HCoVs (see Materials and methods). The frequency of peptide recognition is shown in the bottom two plots. Peptides from each virus are indicated by colored lines: The length of each line along the x axis indicates the corresponding region of the SARS-CoV-2 S protein covered by each peptide according to a pairwise protein alignment; the height of each line corresponds to the fraction of samples in which that peptide scored in either the IgG or IgA IPs. The epitopes mapped in (C) and (D) are highlighted in pink. (C and D) Mapping of recurrently recognized SARS-CoV-2 S IgG (C) and IgA (D) epitopes by triple-alanine scanning mutagenesis. Each plot represents a 20–amino acid region of the SARS-CoV-2 S protein within the regions highlighted in (B). Each column of the heatmap corresponds to an amino acid position, and each row represents a sample. The color intensity indicates the average enrichment of 56-mer peptides containing an alanine mutation at that site relative to the median enrichment of all mutants of that 56-mer in each sample. COVID-19 patients with a minimum relative enrichment below 0.6 in the specified window are shown. The amino acid sequence across each region of SARS-CoV-2 S, as well as an alignment of the corresponding sequences in the common HCoVs, is shown below each heatmap. Single-letter abbreviations for the amino acid residues are as follows: A, Ala; C, Cys; D, Asp; E, Glu; F, Phe; G, Gly; H, His; I, Ile; K, Lys; L, Leu; M, Met; N, Asn; P, Pro; Q, Gln; R, Arg; S, Ser; T, Thr; V, Val; W, Trp; and Y, Tyr.
Fig. 7
Fig. 7. High-resolution mapping of SARS-CoV-2 epitopes.
(A) Mapping of antibody epitopes in the SARS-CoV-2 S protein using triple-alanine scanning mutagenesis. Each column of the heatmap corresponds to an amino acid position, and each row represents a COVID-19 patient. The color intensity indicates the average enrichment of three triple-alanine mutant 56-mer peptides containing an alanine mutation at that site, relative to the median enrichment of all mutants of that 56-mer. The upper panel shows the fraction of samples that recognized each region of S as mapped by the IgA 56-mer (gray) versus the IgA and IgG triple-alanine scanning data (blue and red, respectively). (B and C) Detailed plot of the triple-alanine scanning mutagenesis in (A) to show the epitope complexity within two regions: S 766-835 (B) and S 406-520 (C). The amino acid sequence at each position is shown on the x axis. In (B), the fusion peptide and predicted S2′ cleavage site are indicated below the sequence (21, 22). In (C) the distinct IgA epitopes identified by the HMM and clustering algorithms are depicted by colored bars. Black dots correspond to ACE2 contact residues in the crystal structure of the RBD receptor complex (6M0J) (23). Epitopes in regions E9 and E10 were not picked up by the HMM classifier because of their short length; however, these regions score in multiple samples and correspond to accessible regions in the crystal structure, which suggests that they may represent true epitopes. (D) Cryo–electron microscopy (cryo-EM) structure of the partially open SARS-CoV-2 S trimer (6VSB) (24), highlighting the locations of the antibody epitopes mapped by triple-alanine scanning mutagenesis. The three S monomers are depicted in tan, green, and gray for the two closed and single open-conformation monomers, respectively. The RBD of the open monomer is show in light gray. Three of the RBD epitopes from (C) that overlap ACE2 contact residues and are resolved in the cryo-EM structure (E2, E5, and E6) are highlighted in red, purple, and blue, respectively. The locations of additional public epitopes that were mapped in at least 10 samples across the IgG and IgA experiments are depicted in yellow, pink, and cyan. (E to H) The locations of four of the epitope footprints mapped in (C) are shown in relation to the RBD-ACE2 binding interface. The upper image for each panel shows the structure (6M0J) of SARS-CoV-2 RBD (green) in complex with ACE2 (cyan). The E2, E5, E6, and E8 epitopes are highlighted in red, purple, blue, and orange, respectively. Below each structure image is the sequence alignment of the regions of the SARS-CoV-2 and the SARS-CoV S proteins encompassing each epitope. The colored bars indicate each epitope, the black dots indicate residues that directly interact with ACE2 in the crystal structure, and the shaded residues indicate conservation between SARS-CoV-2 and SARS-CoV.

Comment in

References

    1. Cui J., Li F., Shi Z.-L., Origin and evolution of pathogenic coronaviruses. Nat. Rev. Microbiol. 17, 181–192 (2019). 10.1038/s41579-018-0118-9 - DOI - PMC - PubMed
    1. Ahn D.-G., Shin H.-J., Kim M.-H., Lee S., Kim H.-S., Myoung J., Kim B.-T., Kim S.-J., Current Status of Epidemiology, Diagnosis, Therapeutics, and Vaccines for Novel Coronavirus Disease 2019 (COVID-19). J. Microbiol. Biotechnol. 30, 313–324 (2020). 10.4014/jmb.2003.03011 - DOI - PMC - PubMed
    1. COVID-19 Dashboard by the Center for Systems Science and Engineering (CSSE) at Johns Hopkins University (JHU); https://coronavirus.jhu.edu/map.html.
    1. Yuki K., Fujiogi M., Koutsogiannaki S., COVID-19 pathophysiology: A review. Clin. Immunol. 215, 108427 (2020). 10.1016/j.clim.2020.108427 - DOI - PMC - PubMed
    1. Larman H. B., Zhao Z., Laserson U., Li M. Z., Ciccia A., Gakidis M. A. M., Church G. M., Kesari S., Leproust E. M., Solimini N. L., Elledge S. J., Autoantigen discovery with a synthetic human peptidome. Nat. Biotechnol. 29, 535–541 (2011). 10.1038/nbt.1856 - DOI - PMC - PubMed

Publication types