. 2020 Sep 29;11(1):4891.
doi: 10.1038/s41467-020-18642-y.

Satellite glial cells promote regenerative growth in sensory neurons

Affiliations

Satellite glial cells promote regenerative growth in sensory neurons

Oshri Avraham et al. Nat Commun. .

Abstract

Peripheral sensory neurons regenerate their axon after nerve injury to enable functional recovery. Intrinsic mechanisms operating in sensory neurons are known to regulate nerve repair, but whether satellite glial cells (SGC), which completely envelop the neuronal soma, contribute to nerve regeneration remains unexplored. Using a single cell RNAseq approach, we reveal that SGC are distinct from Schwann cells and share similarities with astrocytes. Nerve injury elicits changes in the expression of genes related to fatty acid synthesis and peroxisome proliferator-activated receptor (PPARα) signaling. Conditional deletion of fatty acid synthase (Fasn) in SGC impairs axon regeneration. The PPARα agonist fenofibrate rescues the impaired axon regeneration in mice lacking Fasn in SGC. These results indicate that PPARα activity downstream of FASN in SGC contributes to promote axon regeneration in adult peripheral nerves and highlight that the sensory neuron and its surrounding glial coat form a functional unit that orchestrates nerve repair.


Conflict of interest statement

The authors declare no competing interests.

Figures
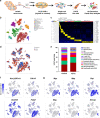
Fig. 1
Fig. 1. Characterization of cell populations in the DRG.
a Schematic of the experimental design for scRNAseq. b t-SNE plot of 6,541 cells from L4, L5 mouse dissociated DRG, with 13 distinct cell clusters (Unbiased, Graph based clustering). Classifications were assigned based on known marker genes. c Heatmap of the top five differentially expressed genes per cluster relative to all other clusters. d t-SNE plot of cells from naïve (blue) and injury (red) conditions. e Fraction of each cell type within control (2915 cells) and injury (3626 cells) conditions. n = 2 biologically independent experiments. Source data are provided as a Source Data file. f t-SNE overlaid for expression of marker genes for SGC. g t-SNE overlaid for expression of marker genes shared between Schwann cells and SGC (top panel) and marker genes for Schwann cell only (bottom panel).
Fig. 2
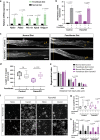
Fig. 2. Fabp7 is a specific marker for SGC.
a Representative images of immunofluorescence staining of mouse DRG sections with FABP7 (green) which labels SGC surrounding neurons marked with TUJ1 (magenta). No FABP7 expression in the axon rich area (asterisks) is observed. n = 3 biologically independent animals, Scale bar: 100 µm. b BLBPCre-ER mice crossed with RosaGFP or Sun1GFP show expression of GFP in the SGC surrounding the neurons marked with TUJ1 (magenta). RosaGFP n = 3 and Sun1GFP n = 4 biologically independent animals, Scale bar: 50 µm. c Quantification of sciatic nerves from BLBPCre-ER mice crossed with Sun1GFP. GFP positive nuclei were normalized to the total number of DAPI positive nuclei. One-way analysis of variance (ANOVA) followed by Sidak’s multiple comparisons test. Data are presented as mean values ± SEM. Source data are provided as a Source Data file. d Representative images from naive and injured nerves, ~0.5 mm proximal and distal to the injury site as shown in the scheme. n = 4 biologically independent animals. Scale bar: 50 µm.
Fig. 3
Fig. 3. SGC upregulate genes involved in lipid metabolism in response to nerve injury.
a Pathway analysis (KEGG 2016) of differentially upregulated genes in the SGC cluster. n = 2 biologically independent experiments. (FDR < 0.05, Log2Fold change >2). b t-SNE overlay for expression of Fasn gene. c DRG sections from control and FasncKO mice, immunostained for FASN (green) and the neuronal marker TUJ1 (magenta). Scale bar: 50 µm. d Nerve sections from control and FasncKO mice, immunostained for FASN (green) and the neuronal marker TUJ1 (magenta). Scale bar: 50 µm. e Western blot analysis and quantification of FASN protein expression in DRG from control and FasncKO mice with and without injury. Quantification of FASN expression normalized to GAPDH expression. ns-non significant. Source data are provided as a Source Data file. f Western blot analysis and quantification of FASN protein expression in Sciatic nerve from control and FasncKO mice with and without injury. Quantification of FASN expression normalized to GAPDH expression. ns-non significant. Source data are provided as a Source Data file. n = 3 biologically independent animals in (e, f). Data are presented as mean values ± SEM in (e, f). One way ANOVA followed by Dunnett’s multiple comparisons test in (e, f).
Fig. 4
Fig. 4. Fasn deletion in SGC does not alter neuronal morphology.
a Representative TEM images of a DRG cell body and its enveloping SGC sheath, pseudo-colored in turquoise, from control and FasncKO mice. High magnification of boxed area from top panels are showed in bottom panels. Scale bar: 5 µm. b Average SGC nuclear area. n = 20 cells examined over 3 independent experiments. c SGC nuclear circularity (ratio between major axis(X) and minor axis(Y). 1 = circular, <1=elliptic). n = 17 cells examined over 3 independent experiments. d Neuron nuclear circularity (ratio between major axis(X) and minor axis(Y). 1 = circular, 1<elliptic). n = 12 cells examined over 3 independent experiments. ns-non significant. e Representative TEM images of sciatic nerve cross sections from control and FasncKO mice. Scale bar: 5 µm. f Quantification of axon diameter distribution in sciatic nerves of FasncKO and control mice (average axon diameter Control = 3.574 µm FasncKO = 3.353 µm n = 130 axons). g Quantification of g-ratio in sciatic nerves of FasncKO and control mice. n = 110 cells in control and n = 116 cells in FasncKO examined over 3 independent experiments. Mean control = 0.6286, mean FasncKO = 0.6359. ns-non significant. Plots lines at the median (dashed) and quartiles (dotted). h Linear correlation of g-ratio versus axon diameter in sciatic nerves of FasncKO mice compared with controls. non-significant. i Quantification of the number of axons per Remak bundle in FasncKO and control nerves. n = 3 biologically independent animals from 2 independent experiments in ai. Data are presented as mean values ± SEM in (b, c, d, I). P values determined by two-tailed t test in (b, c, d, g, i). Source data are provided as a Source Data file for (b, c, d, f, g, h, i).
Fig. 5
Fig. 5. Fasn deletion in SGC does not alter neuronal functional properties.
a Quantification of cleaved caspase 3 in DRG sections from control and FasncKO mice in naïve and 3 days after sciatic nerve injury. The ratio of cleaved caspase 3 positive vs. DAPI nuclei was measured. n = 4 biologically independent animals. ns-non significant. b qPCR analysis of Atf3 expression in DRG from control and FasncKO mice in naïve and 3 days after sciatic nerve injury. n = 3 biologically independent animals. c Whole-cell recordings were performed from cultured DRG neurons associated with at least one glial cell, from FasncKO or control mice. Resting membrane potential (RMP) in control −45.3 ± 2.7 mV, n = 16 cells from 8 independent experiments; in FasncKO −46.1 ± 1.8 mV, n = 30; p = 0.79. d Membrane capacitance in control 18.3 ± 1.8 pF, n = 16 cells from 8 independent experiments; in FasncKO 16.5 ± 1.1 pF, n = 30 cells from 8 independent experiments; p = 0.36. e Input resistance in control 456 ± 43 MΩ, n = 16 cells from 8 independent experiments; in FasncKO 482 ± 24 MΩ, n = 30 cells from 8 independent experiments; p = 0.56. f Spiking properties of DRG neurons from controls and FasncKO. g Action Potential threshold in control −9.46 ± 0.94 mV, n = 13 cells from 8 independent experiments; in FasncKO −9.91 ± 0.84 mV, n = 28 cells from 8 independent experiments; p = 0.77 ns- non-significant. h Neuronal firing rate in control 11.57 ± 2.09 Hz, n = 14 cells from 8 independent experiments; in FasncKO 10.62 ± 0.86 Hz, n = 29 cells from 8 independent experiments; p = 0.62. ns- non significant. P values determined by One way ANOVA followed by Sidak’s multiple comparisons test in (a, b) and two-tailed t test in (c, d, e, g, h). Data are presented as mean values ± SEM. Source data are provided as a Source Data file for (ae, g, h).
Fig. 6
Fig. 6. Fasn deletion in SGC impairs axon regeneration.
a Representative longitudinal sections of sciatic nerve from control and FasncKO mice 3 days after sciatic nerve injury, stained for SCG10. Orange lines indicate the crush site, identified as the maximal SCG10 intensity. Arrowheads indicate longest regenerating axons. Scale bar: 500 µm. b Length of the longest 10 axons was measured in 10 sections for each nerve. c Regeneration index was measured as SGC10 intensity normalized to the crush site. d Representative images of dissociated DRG neurons from control and FasncKO, cultured for 20 h, from naïve and injured (3 days post conditioning sciatic nerve injury) and stained with the neuronal marker TUJ1. Scale bar: 200 µm. e The length of axons per neuron was measured. Automated neurite tracing analysis using Nikon Elements of about 500 neurons per replicate. f Percentage of initiating neurons normalized to the total number of neurons was measured in 8 independent animals, average of 500 neurons per replicate. Automated neurite tracing analysis using Nikon Elements. One way ANOVA. Sidak’s multiple comparisons test ns-non-significant. n = 8 biologically independent animals examined over 2 independent experiments for (af). P values determined by two tailed t test presented in (b) and One way ANOVA followed by Sidak’s multiple comparisons test in (c, e and f). Data are presented as mean values ± SEM. The boxplots in b and e extends from the 25th to 75th percentiles and the whiskers go down to the smallest value and up to the largest where the box middle line is the median. Source data are provided as a Source Data file for (b, c, e, f).
Fig. 7
Fig. 7. Activation of PPARα in SGC promotes axon regeneration in neuron-SGC cocultures.
a t-SNE overlay for expression of the genes Pparα, Pparγ, and Pparα target genes Ppargc1a, Fads2, and Pex11a. b Heat map of PPARα target genes expression after nerve injury in SGC and neurons. c Representative images of DRG sections immunostained for PPARα (green) and TUJ1 (magenta). n = 3 biologically independent animals. Scale bar: 100 µm. d Neuronal and axonal area in embryonic DRG spot co-cultures at DIV7, immunostained for FABP7 (green) and TUJ1 (magenta). n = 3 biologically independent experiments. Scale Bar: 100 µm (neuronal) and 50 µm (axonal). e Embryonic DRG spot co-cultures axotomized at DIV7 after a 24 h pre-treatment with the indicated PPARα agonists at the indicated concentration. Cultures were fixed after 24 h and stained with SCG10. Scale Bar: 50 µm. f Distance of regenerating axons was measured from the injury site from images shown in (e). g Embryonic DRG spot culture was supplement with FDU (5-deoxyfluoruridine) to eliminate dividing cells in the culture. Axotomy was performed at DIV7 after a 24 h pre-treatment with the indicated PPARα agonists. Distance of regenerating axons was measured from injury site after 24 h. ns-non significant. n = 4 biologically independent animals examined over 2 independent experiments for (f and g). P values determined by One way ANOVA followed by Dunnett’s multiple comparisons test are presented in (f and g). Data are presented as mean values ± SEM. Source data are provided as a Source Data file for (f and g).
Fig. 8
Fig. 8. Activation of PPARα in SGC promotes axon regeneration.
a qPCR analysis of PPARα target genes expression in DRG from mice fed with a normal diet vs. fenofibrate diet. b qPCR analysis of Atf3 expression in DRG from control and FasncKO mice in naïve and 3 days after sciatic nerve injury with and without fenofibrate. c Representative longitudinal sections of sciatic nerve from FasncKO mice fed with a normal diet or fenofibrate diet, stained for SCG10. Orange lines indicate the crush site, arrow heads indicate longest axons Scale Bar: 500 µm. d Length of the longest 10 axons was measured in 10 sections for each nerve. ns-non significant. e Regeneration index was measured as SGC10 intensity normalized to the crush site. f Representative images of dissociated DRG neurons from control and FasncKO mice fed with a normal diet or fenofibrate diet, cultured for 20 h and stained with TUJ1. Scale bar: 200 µm. g Length of axons per neuron was measured with average of 500 neurons per replicate. ns-non significant. h Percentage of initiating neurons out of total number of neurons was measured. Average of 500 neurons per replicate. Automated neurite tracing analysis using Nikon Elements. n = 3 biologically independent animals in (a and b) and n = 8 in (ce). n = 8 biologically independent animals examined over 2 independent experiments in (fh). P values determined by One way ANOVA followed by Sidak’s multiple comparisons test for (a, b, d, e, g, h). The box plots in (d and g) extends from the 25th to 75th percentiles and the whiskers go down to the smallest value and up to the largest where the box middle line is the median. Data are presented as mean values +/− SEM. Source data are provided as a Source Data file for (a, b, d, e, g, h).

References

    1. Mahar M, Cavalli V. Intrinsic mechanisms of neuronal axon regeneration. Nat. Rev. Neurosci. 2018;19:323–337. doi: 10.1038/s41583-018-0001-8. - DOI - PMC - PubMed
    1. He Z, Jin Y. Intrinsic control of axon regeneration. Neuron. 2016;90:437–451. doi: 10.1016/j.neuron.2016.04.022. - DOI - PubMed
    1. Chen ZL, Yu WM, Strickland S. Peripheral regeneration. Annu. Rev. Neurosci. 2007;30:209–233. doi: 10.1146/annurev.neuro.30.051606.094337. - DOI - PubMed
    1. Jessen KR, Mirsky R. The repair Schwann cell and its function in regenerating nerves. J. Physiol. 2016;594:3521–3531. doi: 10.1113/JP270874. - DOI - PMC - PubMed
    1. Hanani M. Satellite glial cells in sensory ganglia: from form to function. Brain Res. Brain Res. Rev. 2005;48:457–476. doi: 10.1016/j.brainresrev.2004.09.001. - DOI - PubMed

Publication types

MeSH terms