

Edaphic factors and plants influence denitrification in soils from a long-term arable experiment
- PMID: 32994429
- PMCID: PMC7524710
- DOI: 10.1038/s41598-020-72679-z
Edaphic factors and plants influence denitrification in soils from a long-term arable experiment
Abstract
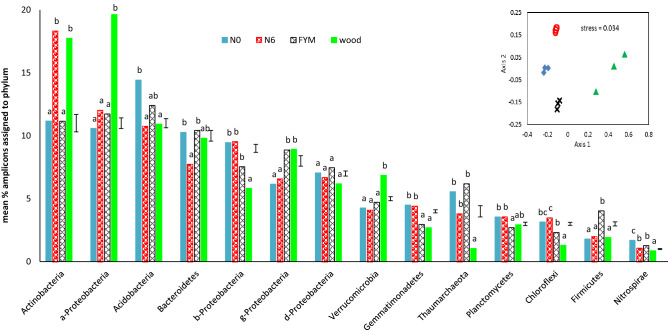
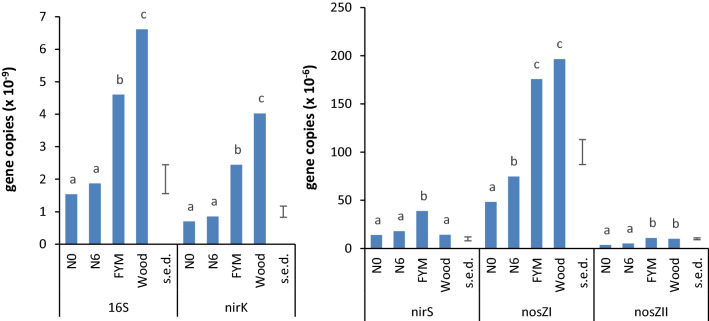
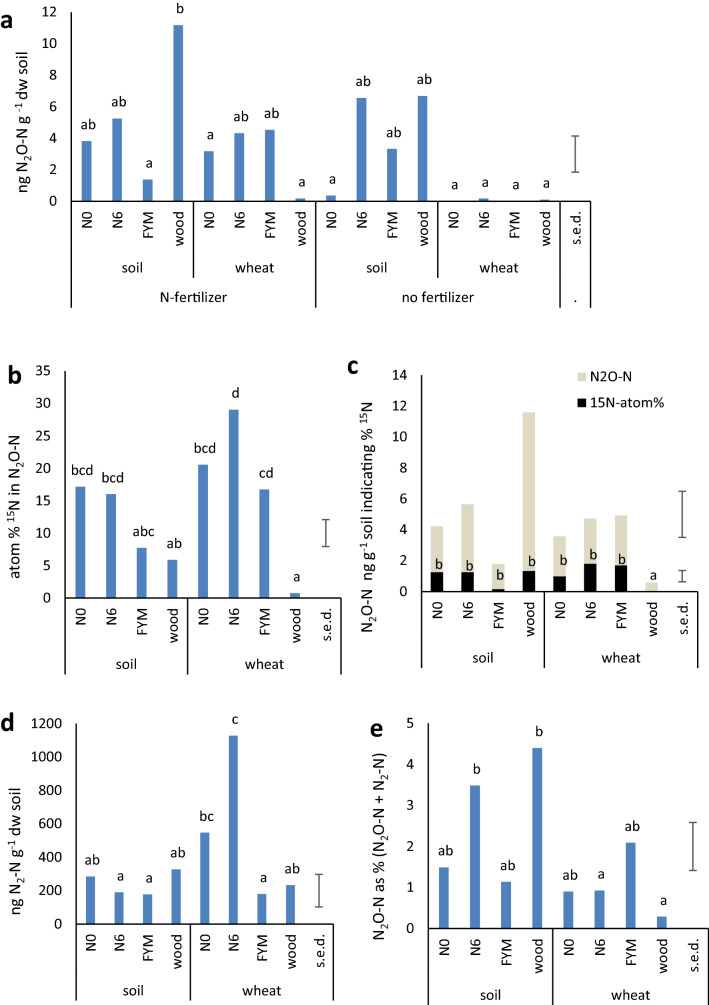
Factors influencing production of greenhouse gases nitrous oxide (N2O) and nitrogen (N2) in arable soils include high nitrate, moisture and plants; we investigate how differences in the soil microbiome due to antecedent soil treatment additionally influence denitrification. Microbial communities, denitrification gene abundance and gas production in soils from tilled arable plots with contrasting fertilizer inputs (no N, mineral N, FYM) and regenerated woodland in the long-term Broadbalk field experiment were investigated. Soil was transferred to pots, kept bare or planted with wheat and after 6 weeks, transferred to sealed chambers with or without K15NO3 fertilizer for 4 days; N2O and N2 were measured daily. Concentrations of N2O were higher when fertilizer was added, lower in the presence of plants, whilst N2 increased over time and with plants. Prior soil treatment but not exposure to N-fertiliser or plants during the experiment influenced denitrification gene (nirK, nirS, nosZI, nosZII) relative abundance. Under our experimental conditions, denitrification generated mostly N2; N2O was around 2% of total gaseous N2 + N2O. Prior long-term soil management influenced the soil microbiome and abundance of denitrification genes. The production of N2O was driven by nitrate availability and N2 generation increased in the presence of plants.
Conflict of interest statement
The authors declare no competing interests.
Figures

References
-
- Smith KA. Changing views of nitrous oxide emissions from agricultural soil: Key controlling processes and assessment at different spatial scales. Eur. J. Soil Sci. 2017;68:137–155. doi: 10.1111/ejss.12409. - DOI
-
- Philippot L, Hallin S, Schloter M. Ecology of denitrifying prokaryotes in agricultural soil. Adv. Agron. 2007;96(96):249–305. doi: 10.1016/S0065-2113(07)96003-4. - DOI
-
- Bouwman AF. Direct emission of nitrous oxide from agricultural soils. Nutr. Cycl. Agroecosyst. 1996;46:53–70. doi: 10.1007/Bf00210224. - DOI
Publication types
MeSH terms
Substances
Grants and funding
- BB/E/C/0005196/BB_/Biotechnology and Biological Sciences Research Council/United Kingdom
- BB/NO13468/1/BB_/Biotechnology and Biological Sciences Research Council/United Kingdom
- BBS/E/C/000I0310/BB_/Biotechnology and Biological Sciences Research Council/United Kingdom
- BBS/E/C/000J0300/BB_/Biotechnology and Biological Sciences Research Council/United Kingdom
LinkOut - more resources
Full Text Sources
