. 2020 Sep 29;10(1):16039.
doi: 10.1038/s41598-020-73029-9.

Breast cancer biomarker detection through the photoluminescence of epitaxial monolayer MoS2 flakes

Affiliations

Breast cancer biomarker detection through the photoluminescence of epitaxial monolayer MoS2 flakes

Sergio Catalán-Gómez et al. Sci Rep. .

Abstract

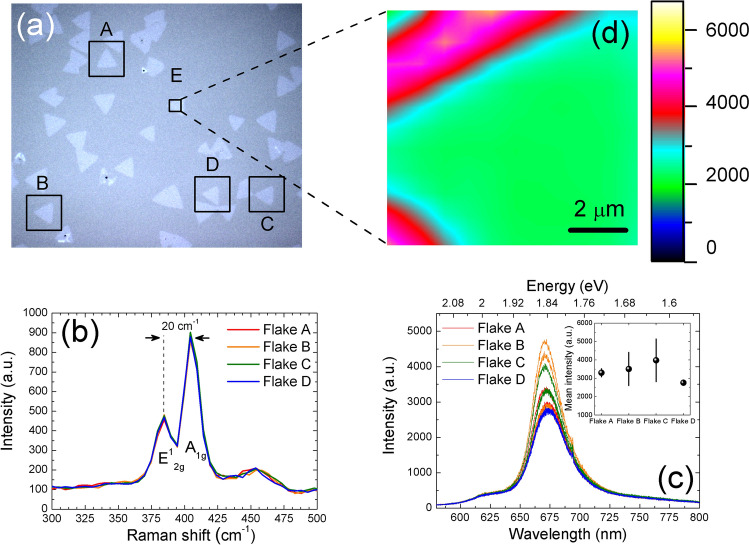
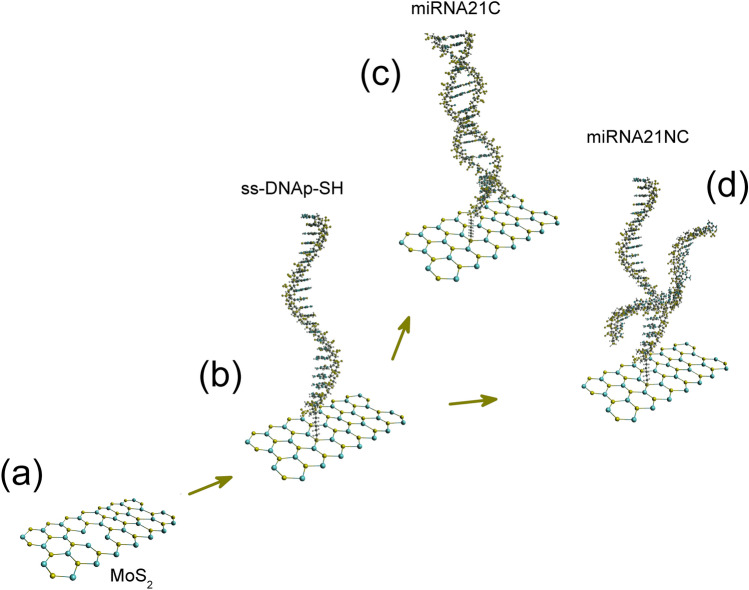
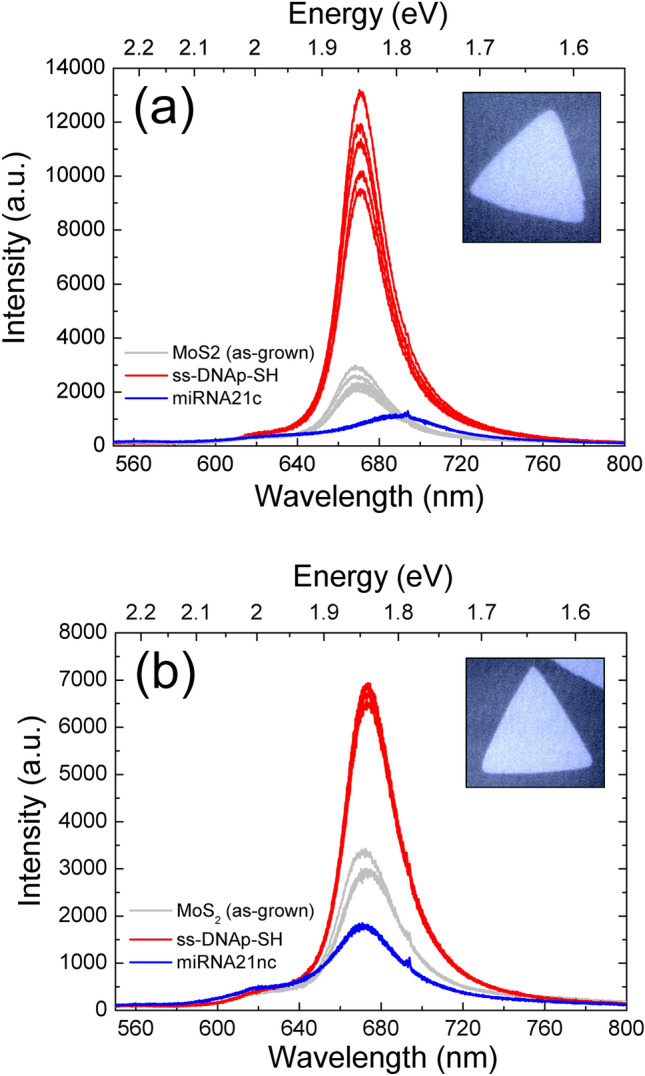
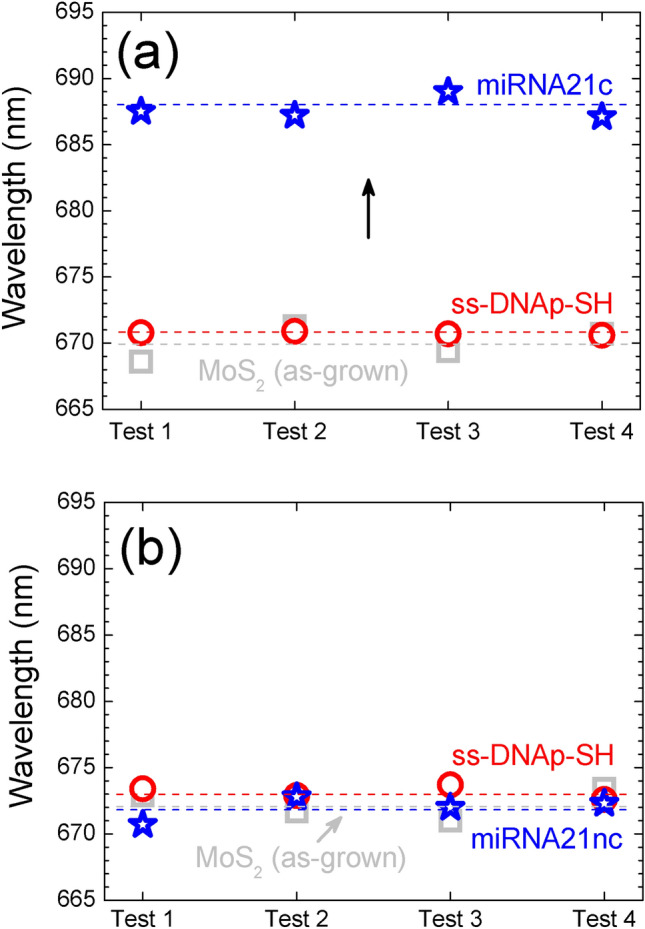
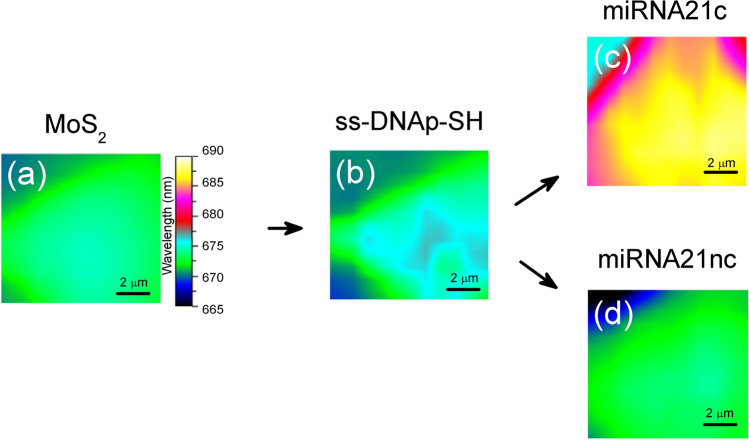
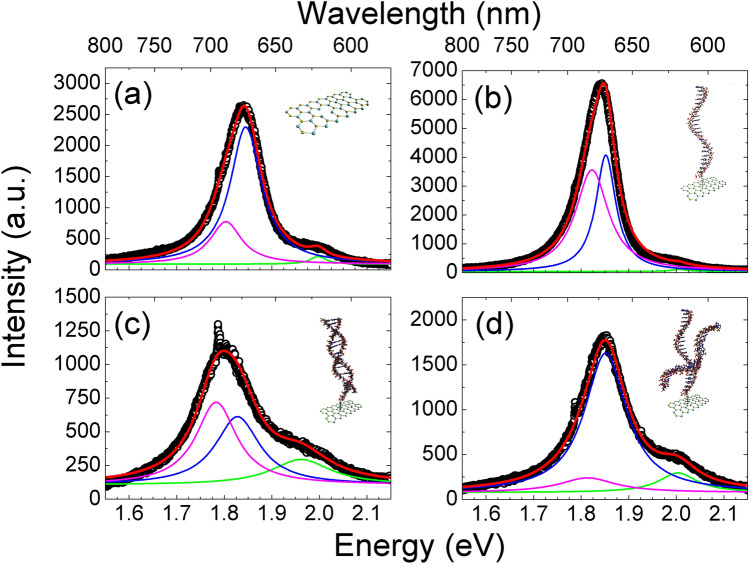
In this work we report on the characterization and biological functionalization of 2D MoS2 flakes, epitaxially grown on sapphire, to develop an optical biosensor for the breast cancer biomarker miRNA21. The MoS2 flakes were modified with a thiolated DNA probe complementary to the target biomarker. Based on the photoluminescence of MoS2, the hybridization events were analyzed for the target (miRNA21c) and the control non-complementary sequence (miRNA21nc). A specific redshift was observed for the hybridization with miRNA21c, but not for the control, demonstrating the biomarker recognition via PL. The homogeneity of these MoS2 platforms was verified with microscopic maps. The detailed spectroscopic analysis of the spectra reveals changes in the trion to excitation ratio, being the redshift after the hybridization ascribed to both peaks. The results demonstrate the benefits of optical biosensors based on MoS2 monolayer for future commercial devices.


Conflict of interest statement

The authors declare no competing interests.

Figures

Figure 1
Figure 1
(a) Image of the MoS2 flakes grown on sapphire obtained by optical microscopy with a ×20 magnification. (b) Raman spectra of flakes A–D identified in panel (a), evidencing the same vibrational modes. (c) PL spectra of flakes A–D measured at the center. The inset shows the mean intensity taking into account the statistical error of the four spots measured. (d) Map of flake E from panel (a), showing the homogeneity of the PL signal at the center, and the increase at the border. Color scale indicates the intensity in arbitrary units.
Figure 2
Figure 2
Scheme of the steps followed for the biosensing procedure. (a) Typical MoS2 surface, with the eventual presence of defects, (b) ss-DNAp-SH probe attached to the MoS2 surface. Hybridization on the MoS2 surface with (c) miRNA21c or (d) miRNA21nc.
Figure 3
Figure 3
PL spectra for two flakes processed and tested with (a) miRNA21c and (b) miRNA21nc. Several spectra were acquired in different spots of the flake for the three steps (as-grown, ss-DNAp-SH functionalization, and target test). The insets are the optical images of the flakes used in the study (magnification ×100).
Figure 4
Figure 4
Results for the biosensing test in 4 different flakes for (a) miRNA21c and (b) miRNA21nc. Values are the average of the different spectra measured in each flake. A redshift of 16 nm takes place for miRNA21c while miRNA21nc shows no change. Statistical errors lie within the points of the graph.
Figure 5
Figure 5
PL maps showing the wavelength variation in flakes (area of 10 × 10 μm2) for 4 different steps: (a) as-grown MoS2, (b) after ss-DNAp-SH functionalization, (c) after miRNA21c hybridization, (d) after miRNA21nc control test.
Figure 6
Figure 6
PL spectra for samples in a different stages: (a) pristine as-grown MoS2, (b) flake after ss-DNAp-SH functionalization, (c) after hybridization with the complementary sequence miRNA21c, and (d) with the non-complementary sequence miRNA21nc. The PL band is deconvoluted in the different contributions to fit the data.

References

    1. Harbeck N, et al. Breast cancer. Nat. Rev. Dis. Primer. 2019;5:66. doi: 10.1038/s41572-019-0111-2. - DOI - PubMed
    1. Mahfoud OK, et al. Detection of ErbB2: Nanotechnological solutions for clinical diagnostics. RSC Adv. 2014;4:3422–3442. doi: 10.1039/C3RA45401K. - DOI
    1. Mittal S, Kaur H, Gautam N, Mantha AK. Biosensors for breast cancer diagnosis: A review of bioreceptors, biotransducers and signal amplification strategies. Biosens. Bioelectron. 2017;88:217–231. doi: 10.1016/j.bios.2016.08.028. - DOI - PubMed
    1. Jazbutyte V, Thum T. MicroRNA-21: From cancer to cardiovascular disease. Curr. Drug Targets. 2010;11:926–935. doi: 10.2174/138945010791591403. - DOI - PubMed
    1. Iorio MV, Croce CM. MicroRNA dysregulation in cancer: Diagnostics, monitoring and therapeutics. A comprehensive review. EMBO Mol. Med. 2012;4:143–159. doi: 10.1002/emmm.201100209. - DOI - PMC - PubMed

Publication types