. 2020 Sep 29;10(1):16032.
doi: 10.1038/s41598-020-72622-2.

Vitamin D deficiency serves as a precursor to stunted growth and central adiposity in zebrafish

Affiliations

Vitamin D deficiency serves as a precursor to stunted growth and central adiposity in zebrafish

Megan M Knuth et al. Sci Rep. .

Abstract

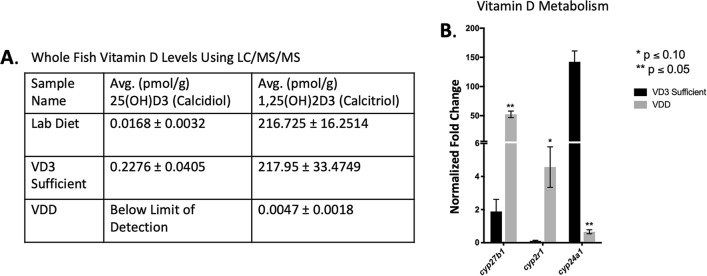
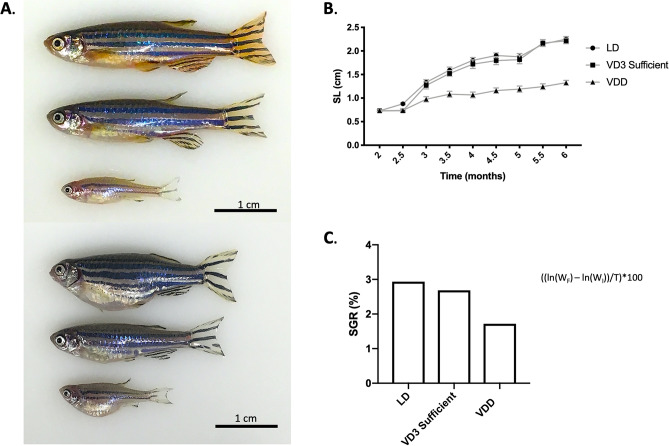
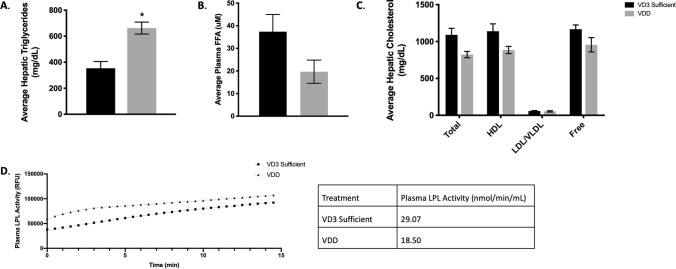
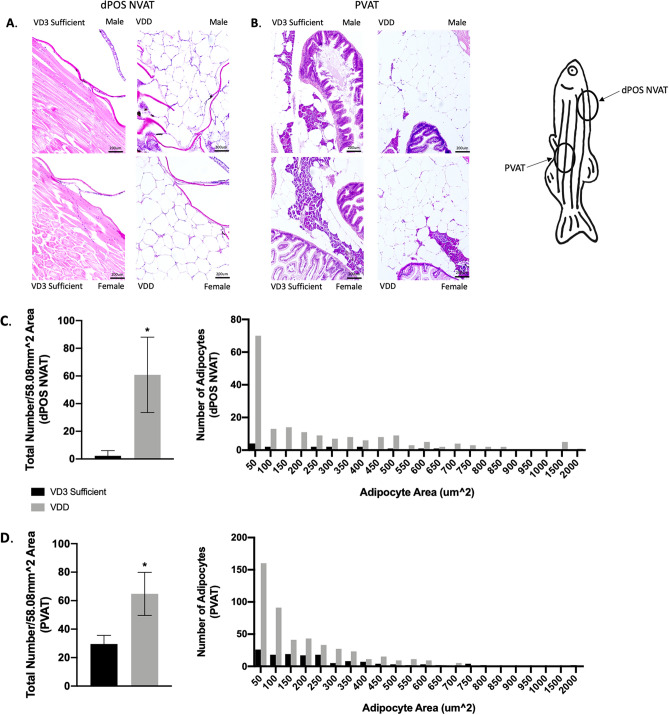
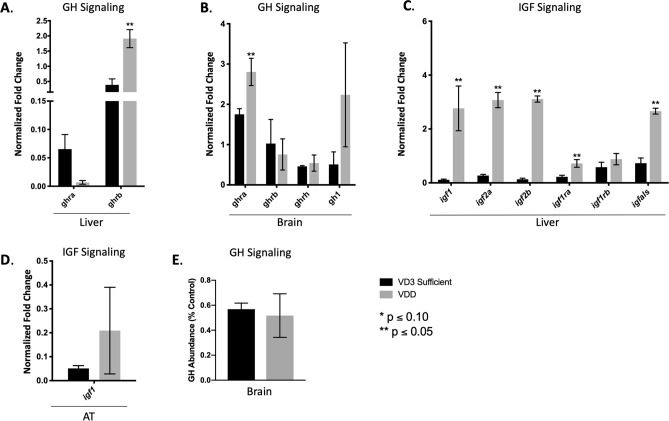
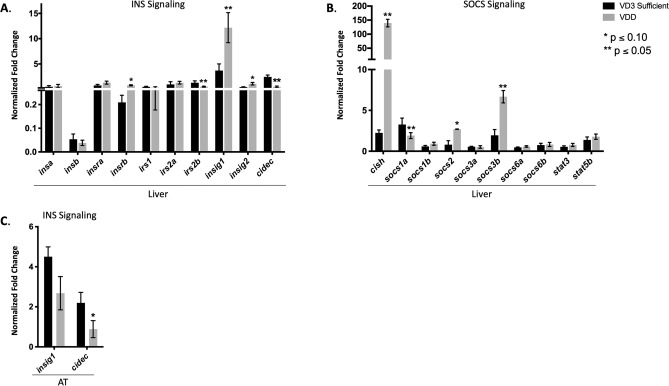
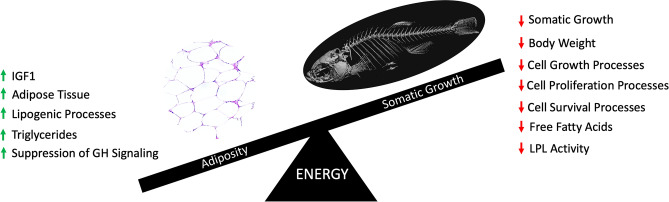
Emerging evidence demonstrates the importance of sufficient vitamin D (1α, 25-dihydroxyvitamin D3) levels during early life stage development with deficiencies associated with long-term effects into adulthood. While vitamin D has traditionally been associated with mineral ion homeostasis, accumulating evidence suggests non-calcemic roles for vitamin D including metabolic homeostasis. In this study, we examined the hypothesis that vitamin D deficiency (VDD) during early life stage development precedes metabolic disruption. Three dietary cohorts of zebrafish were placed on engineered diets including a standard laboratory control diet, a vitamin D null diet, and a vitamin D enriched diet. Zebrafish grown on a vitamin D null diet between 2-12 months post fertilization (mpf) exhibited diminished somatic growth and enhanced central adiposity associated with accumulation and enlargement of visceral and subcutaneous adipose depots indicative of both adipocyte hypertrophy and hyperplasia. VDD zebrafish exhibited elevated hepatic triglycerides, attenuated plasma free fatty acids and attenuated lipoprotein lipase activity consistent with hallmarks of dyslipidemia. VDD induced dysregulation of gene networks associated with growth hormone and insulin signaling, including induction of suppressor of cytokine signaling. These findings indicate that early developmental VDD impacts metabolic health by disrupting the balance between somatic growth and adipose accumulation.


Conflict of interest statement

The authors declare no competing interests.

Figures

Figure 1
Figure 1
VDD in male 6 mpf zebrafish fed a vitamin D null diet. (A) VDD fish had lower whole body levels of both 25(OH)D3 and 1,25(OH)2D3 than lab diet and VD3 sufficient fish. The limit of quanititation (LOQ) was 8 pmol/g and the limit of detection (LOD) was 3 pmol/g. Data are represented as mean ± SD. (B) VDD livers expressed significantly more cyp27b1 and cyp2r1, and significantly less cy24a1, than vitamin D sufficient livers. Data are represented as mean ± SE. *See also Supplementary Table 2.
Figure 2
Figure 2
Stunted growth observed in the VDD zebrafish 6 mpf. (A) Both male and female VDD zebrafish exhibited stunted growth 6 mpf. Descending order: MALE (lab diet, VD3 sufficient, VDD), FEMALE (lab diet, VD3 sufficient, VDD). (B) Growth rate was taken biweekly starting at 2 mpf and ending at 6 mpf (2 mpf, 2.5 mpf, 3 mpf, etc.). At 6 mpf, the average SL (cm) for VDD, VD3 sufficient, and LD fish was 1.33 ± 0.0 cm, 2.21 ± 0.06 cm, and 2.25 ± -0.06 cm, respectively. Data are represented as mean ± SEM. (C) The SGR (%) from 2–6 mpf for VDD, VD3 sufficient, and LD fish was 1.72%, 2.69%, and 2.93%, respectively. Data are represented as mean ± SEM. All measures are representative of a mixed gender population. *See also Supplementary Figs. 1 and 2.
Figure 3
Figure 3
Metabolic homeostasis in VDD liver. (A) VDD fish had significantly elevated levels of hepatic triglycerides (662.37 ± 46.25 mg/dL) 6 mpf. Data are represented as mean ± SEM. (BD) VDD fish had lower plasma FFA levels (19.67 ± 5.13uM), lower total, HDL, LDL/VLDL, and free hepatic cholesterol (822.7 ± 42.49 mg/dL, 884.9 ± 49.50 mg/dL, 52.7 ± 8.74 mg/dL, 956.2 ± 96.39 mg/dL, respectively) and lower plasma LPL activity (18.5 nmol/min/mL) 6 mpf. Data are represented as mean ± SEM.
Figure 4
Figure 4
VDD fish demonstrated both hypertrophy and hyperplasia of dorsal paraosseal (dPOS) non-visceral AT (NVAT) and pancreatic visceral AT (PVAT). (A) Representative images of dPOS NVAT (58.08 mm2 area). (B) Representative images of PVAT (58.08 mm2 area). (C) VDD fish had hypertrophic and hyperplastic (60.78 ± 9.09 adipocytes) dPOS NVAT compared to VD3 sufficient 6 mpf. Data are represented as mean ± SEM (n = 9). (D) VDD fish had hypertrophic and hyperplastic (64.75 ± 15.11 adipocytes) PVAT compared to VD3 sufficient 6 mpf. Data are represented as mean ± SEM (n = 9).
Figure 5
Figure 5
Metabolic dyshomeostasis in VDD AT. (A) Elevated expression of lipid transporters in VDD liver 6 mpf. Decreased expression of fabp11a in VDD AT 6 mpf. (B) Elevated expression of lypolitic factors in VDD liver 6 mpf, with a decrease in lipea and lipeb in VDD AT. (C) Greater abundance of erk1/2 protein in VDD liver 6 mpf, with a decreased in p-erk1/2. (D) Suppression of mitochondrial biogenesis in VDD AT compared to VDD liver 6 mpf. (E) Elevated expression of lipogenic factors in VDD liver 6 mpf. Elevated expression of pparg and srebf1 in VDD AT 6 mpf with a decrease in pparaa and cebpa. *See also Figure S3.
Figure 6
Figure 6
Evaluating GH signaling in VDD liver, AT, and brain. (A,B) VDD fish had significantly elevated expression of ghr in both liver and brain 6 mpf, but no difference in gh1. (C,D) VDD fish had significantly elevated expression of igf in liver 6 mpf, with only a slight increase in igf1 in the AT. (E) No difference seen in GH protein abundance in the brain.
Figure 7
Figure 7
Evaluating INS signaling in VDD liver and AT. (A,B) VDD fish had significantly elevated expression of insig1, insig2, with a significant decrease in cidec in liver 6 mpf, indicating sustained INS signaling contrary to also having significantly elevated expression of cish, socs2, and socs3b, suppressors of cytokine signaling thought to shut down the INS signaling cascade. (C) Downregulation of insig1 and cidec in VDD AT 6 mpf.
Figure 8
Figure 8
Summarizing the impact of VDD. VDD during early life stage development leads to metabolic dyshomeostasis, where there is an imbalance between somatic growth and adiposity.

References

    1. Pfotenhauer KM, Shubrook JH. Vitamin D deficiency, its role in health and disease, and current supplementation recommendations. J. Am. Osteopath. Assoc. 2017;117:301. doi: 10.7556/jaoa.2017.055. - DOI - PubMed
    1. Hossein-nezhad A, Holick MF. Vitamin D for health: a global perspective. Mayo Clin. Proc. Mayo Clin. 2013;88:720–755. doi: 10.1016/j.mayocp.2013.05.011. - DOI - PMC - PubMed
    1. Vanlint S. Vitamin D and obesity. Nutrients. 2013;5:949–956. doi: 10.3390/nu5030949. - DOI - PMC - PubMed
    1. Obesity and Overweight. https://www.who.int/news-room/fact-sheets/detail/obesity-and-overweight (2018).
    1. Nammi S, Koka S, Chinnala KM, Boini KM. Obesity: an overview on its current perspectives and treatment options. Nutr. J. 2004;3:3. doi: 10.1186/1475-2891-3-3. - DOI - PMC - PubMed

Publication types