. 2020 Sep 29;10(1):15976.
doi: 10.1038/s41598-020-72652-w.

A data-driven methodology to discover similarities between cocaine samples

Affiliations

A data-driven methodology to discover similarities between cocaine samples

Fidelia Cascini et al. Sci Rep. .

Abstract

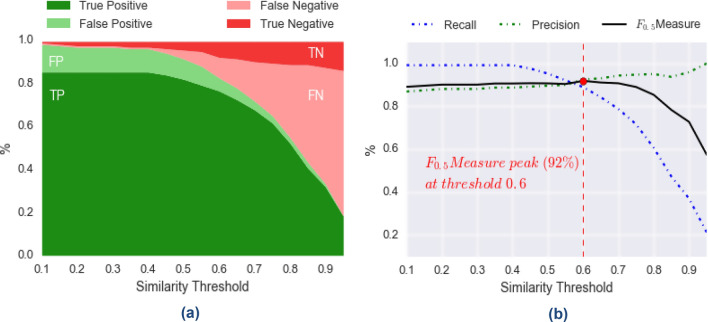
Machine learning has been used for distinct purposes in the science field but no applications on illegal drug have been done before. This study proposes a new web-based system for cocaine classification, profiling relations and comparison, that is capable of producing meaningful output based on a large amount of chemical profiling's data. In particular, the Profiling Relations In Drug trafficking in Europe (PRIDE) system, offers several advantages to intelligence actions across Europe. Thus, it provides a standardized, broad methodology which uses machine learning algorithms to classify and compare drug profiles, highlight how similar drug samples are, and how probable it is that they share a common origin, batch, or preparation process. We evaluated the proposed algorithms using precision and recall metrics and analyzed the quality of predictions performed by the algorithms, with respect to our gold standard. In our experiments, we reached a value of 88% for F0.5-measure, 91% for precision, and 78% for recall, confirming our main hypothesis: machine learning can learn and be applied to have an automatic classification of cocaine profiles.


Conflict of interest statement

The authors declare no competing interests.

Figures

Figure 1
Figure 1
The process. The process of using machine-learning to automatically detect cocaine samples. A seizure (Step 1) usually provides different samples (Step 2) extracted from different packs of a cocaine seizure. Samples are analyzed by laboratories (Step 3) in order to produce data useful to predict similarities among samples (Step 4). Our algorithm (Step 5) processes data to try and find a sample in the database which seems to have been produced by the same process (Step 6). We then report relevant data and metadata to law enforcement to support the investigation and cooperation phase (Step 7).
Figure 2
Figure 2
Similarity matrix of samples considered in our experiments. The matrix shows the similarity of samples considered in our experiments. In this graphical representation of the similarity matrix, each row and each column represents a cocaine sample, while the color of a cell (i, j) represents the similarity of the sample i with the sample j, according to the color code depicted on the right. Since similarity is symmetric, we only depict the lower triangular part of the matrix; we also avoid depicting the main diagonal, since a sample is always completely coincident to itself. In order to compute the most similar sample j to a given sample i, our algorithm considers only those candidates (blue cells) such that their similarity, s, (i, j) is sufficiently high to make us confident to predict that i and j come from the same production process. It follows that the most similar sample j to i, may not exist.
Figure 3
Figure 3
Seizure-agnostic algorithm performances. The seizure-agnostic algorithm performances and similarity thresholds show 92% precision values. In (a) we show how the distribution of True-Positives (TP), False-Positives (FP), True-Negatives (TN), False-Negatives (FN) change according to different values of the similarity threshold (within the range [0.1, 1]). Similarly, in (b) we show how the derived performance metrics (precision, recall, and F0.5-measure) change with respect to the similarity threshold. We note a peak of F0.5-measure (92%) at threshold equal to 0.6, for which we get precision equal to 92%, and recall equal to 89%.
Figure 4
Figure 4
Seizure-aware algorithm performances. The seizure-aware algorithm performances and similarity thresholds show 91% precision values. In (a) we show how the distribution of True-Positives (TP), False-Positives (FP), True-Negatives (TN), False-Negatives (FN) change according to different values of the similarity threshold (within the range [0.1, 1]). Similarly, in (b) we show how the derived performance metrics (precision, recall, and F0.5-measure) change with respect to the similarity threshold. We notice a peak of F0.5-measure (88%) at a threshold equal to 0.6, for which we get precision equal to 91%, and recall equal to 78%.
Figure 5
Figure 5
The algorithm. A diagram of the algorithm explains the input, output and the 5 steps necessary. Given a sample i, it is added to the database, and we then compute our Vector Space Model (Step 1). In this space, each dimension represents a similarity feature identified by a compound in Table 1, thus we use 35 dimensions. The value for dimension x, in a vector A representing sample i, is the concentration of compound x for sample i (Figure S1a). After this, we normalize and scale all vectors (Step 2), in order to obtain a new VSM where vectors have magnitude 1, are centered on the mean, and have component-wise unit variance (Figure S1b). We experimentally verified that such transformations have important effects on the prediction reliability of our algorithm. (To see Supplementary Figure S1, please access Supplementary Information). Once we have such a VSM, we can compute similarity values between the vector A, corresponding to the given sample i, and all other vectors (Step 3). Given two vectors A and B, representing, respectively, samples i and j, we compute their similarity as the cosine of the angle between A and B (Figure S2), i.e., their cosine similarity. In our VSM, where all of the vectors have magnitude 1, the cosine similarity can be easily computed as the dot product of A and B. After computing all of the similarity values between the given sample i and all of the other samples, we discard those samples showing a similarity less than a pre-defined threshold, th (Step 4). We remark that th has been set to 0.6, according to the experiments discussed in the text. If there are samples with a similarity value higher than equal to th, we pick the one with the highest similarity value among them (Step 4), otherwise we conclude that we found no similar sample to i. If a similar sample is found, we output on the data and metadata of the selected sample and related seizure. (To see Supplementary Figure S2 Cosine similarity, please access Supplementary Information).

References

    1. Komura D, Ishikawa S. Machine learning approaches for pathologic diagnosis. Virchows Arch. 2019;475:131–138. doi: 10.1007/s00428-019-02594-w. - DOI - PubMed
    1. Sikpa DP, et al. Automated detection and quantification of breast cancer brain metastases in an animal model using democratized machine learning tools. Sci. Rep. 2019;9:17333. doi: 10.1038/s41598-019-53911-x. - DOI - PMC - PubMed
    1. Santos FLCD, et al. Automatic classification of IgA endomysial antibody test for celiac disease: A new method deploying machine learning. Sci. Rep. 2019;9:9217. doi: 10.1038/s41598-019-45679-x. - DOI - PMC - PubMed
    1. Perveen S, Shahbaz M, Keshavjee K, Guergachi A. Prognostic modeling and prevention of diabetes using machine learning technique. Sci. Rep. 2019;9:13805. doi: 10.1038/s41598-019-49563-6. - DOI - PMC - PubMed
    1. United Nations Office on Drugs and Crime. Recommended methods for the Identification and Analysis of Cocaine in Seized Materials Manual for use by national drug analysis laboratories. United Nations. New York. https://www.unodc.org/documents/scientific/Cocaine_Manual_Rev_1.pdf (2012).

Publication types