

Bayesian approach for maize yield response to plant density from both agronomic and economic viewpoints in North America
- PMID: 32994486
- PMCID: PMC7525453
- DOI: 10.1038/s41598-020-72693-1
Bayesian approach for maize yield response to plant density from both agronomic and economic viewpoints in North America
Abstract
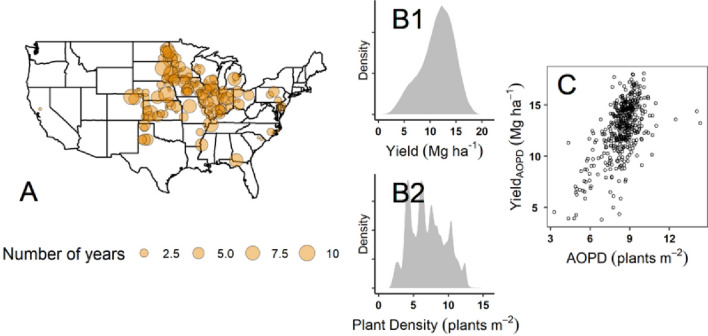
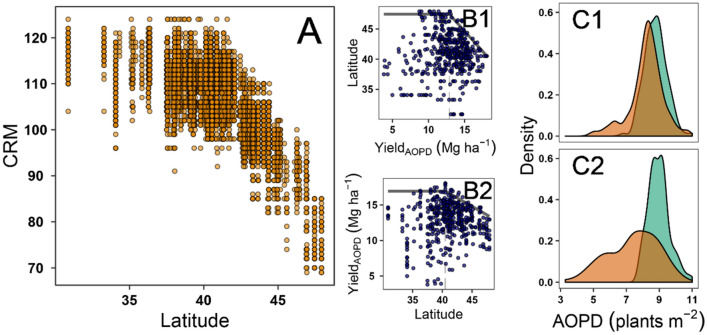
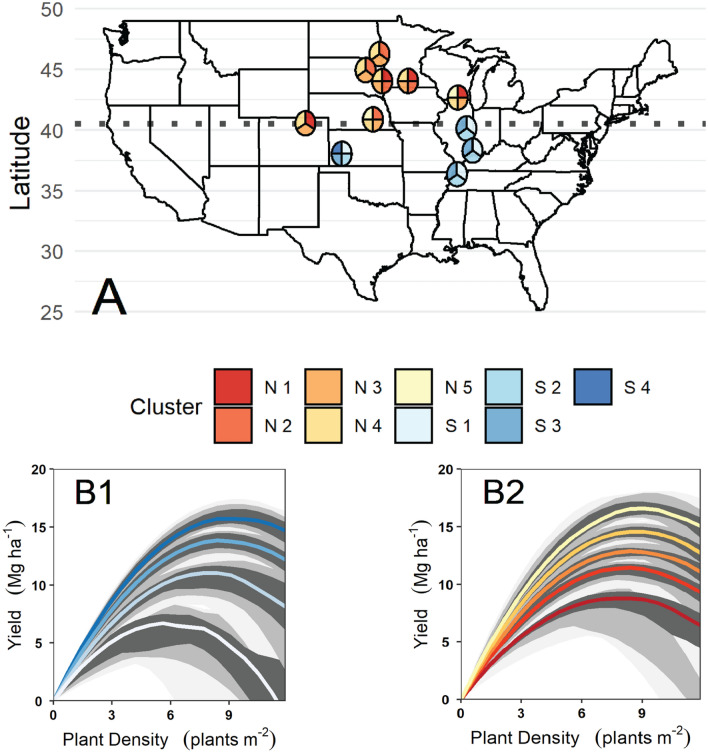
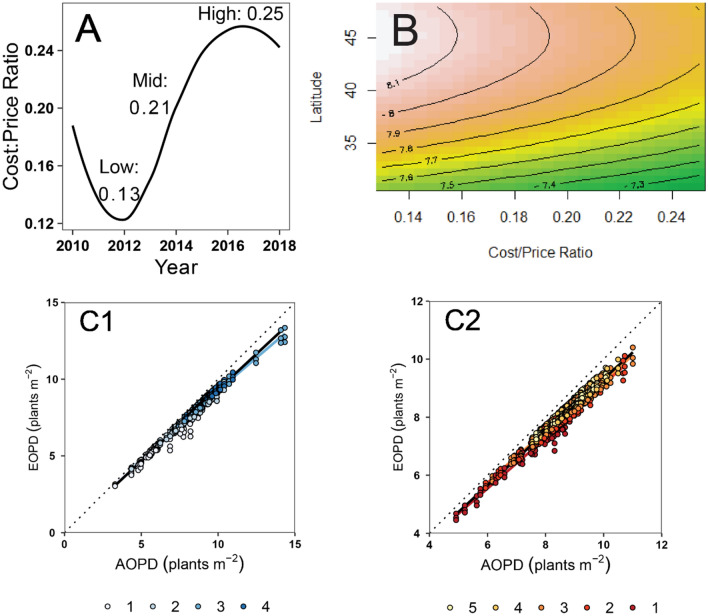
Targeting the right agronomic optimum plant density (AOPD) for maize (Zea mays L.) is a critical management decision, but even more when the seed cost and grain selling price are accounted for, i.e. economic OPD (EOPD). From the perspective of improving those estimates, past studies have focused on utilizing a Frequentist (classical) approach for obtaining single-point estimates for the yield-density models. Alternative analysis models such as Bayesian computational methods can provide more reliable estimation for AOPD, EOPD and yield at those optimal densities and better quantify the scope of uncertainty and variability that may be in the data. Thus, the aims of this research were to (i) quantify AOPD, EOPD and yield at those plant densities, (ii) obtain and compare clusters of yield-density for different attainable yields and latitudes, and (iii) characterize their influence on EOPD variability under different economic scenarios, i.e. seed cost to corn price ratios. Maize hybrid by seeding rate trials were conducted in 24 US states from 2010 to 2019, in at least one county per state. This study identified common yield-density response curves as well as plant density and yield optimums for 460 site-years. Locations below 40.5 N latitude showed a positive relationship between AOPD and maximum yield, in parallel to the high potential level of productivity. At these latitudes, EOPD depended mostly on the maximum attainable yield. For the northern latitudes, EOPD was not only dependent on the attainable yield but on the cost:price ratio, with high ratios favoring reductions in EOPD at similar yields. A significant contribution from the Bayesian method was realizing that the variability of the estimators for AOPD is sometimes greater than the adjustment accounting for seed cost. Our results point at the differential response across latitudes and commercial relative maturity, as well as the significant uncertainty in the prediction of AOPD, relative to the economic value of the crop and the seed cost adjustments.
Conflict of interest statement
The authors declare no competing interests.
Figures
References
-
- Tollenaar M, Lee EA. Yield potential, yield stability and stress tolerance in maize. F. Crop. Res. 2002;75:161–169. doi: 10.1016/S0378-4290(02)00024-2. - DOI
-
- Duvick, D. N. Genetic progress in yield of United States maize (Zea mays L.). Maydica50, 193–202 (2005).
-
- Tollenaar M, Wu J. Yield improvement in temperate maize is attributable to greater stress tolerance. Crop Sci. 1999;39:1597–1604. doi: 10.2135/cropsci1999.3961597x. - DOI
-
- Duvick, D. N. What is yield? in Developing Drought and Low N-Tolerant Maize. Proceedings of a Symposium, March 25–29 (eds. Edmeades, G. O., Banziger, B., Mickelson, H. R. & Peña-Valdivia, C. B.) 332–335 (CIMMYT, 1996).
-
- Otegui, M. E. & Andrade, F. H. New Relationships Between Light Interception, Ear Growth, and Kernel Set in Maize. Crop Sci.Physiology, 89–113 (2000).
Publication types
MeSH terms
Substances
LinkOut - more resources
Full Text Sources
Miscellaneous
