. 2021 Mar;28(3):915-931.
doi: 10.1038/s41418-020-00625-7. Epub 2020 Sep 29.

Genetic inactivation of RIP1 kinase does not ameliorate disease in a mouse model of ALS

Affiliations

Genetic inactivation of RIP1 kinase does not ameliorate disease in a mouse model of ALS

Sara Dominguez et al. Cell Death Differ. 2021 Mar.

Abstract

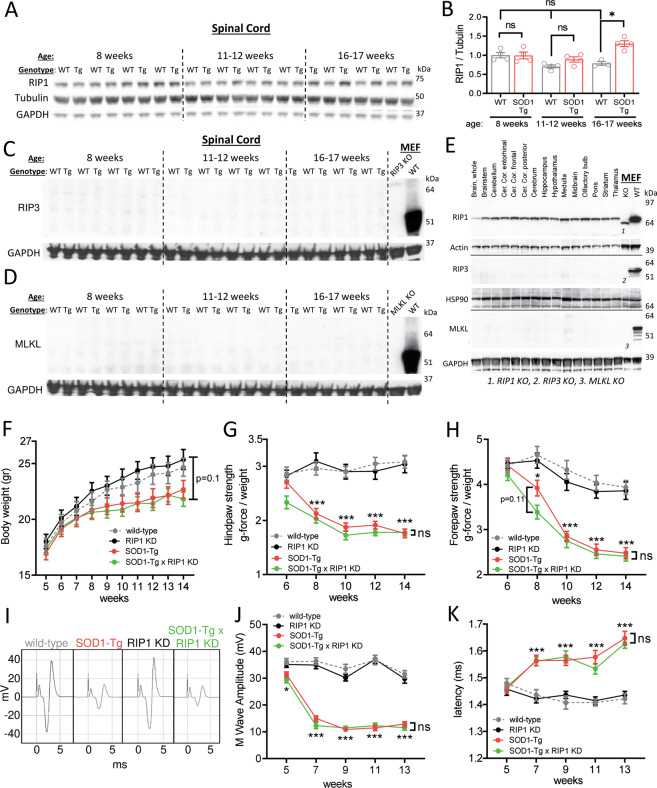
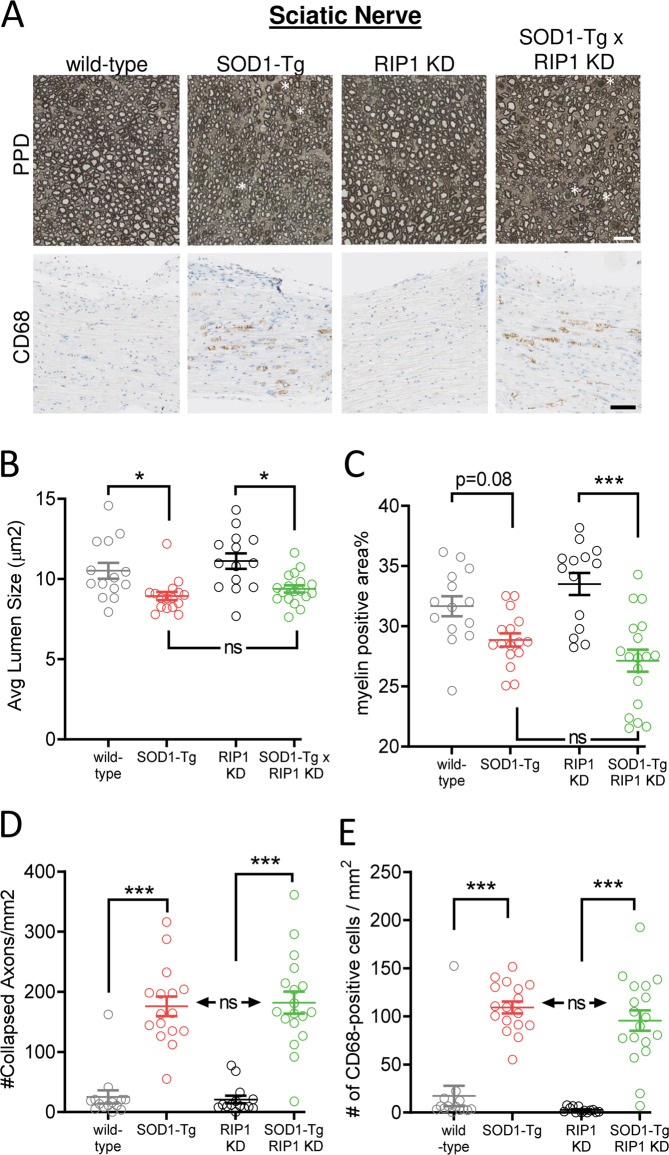
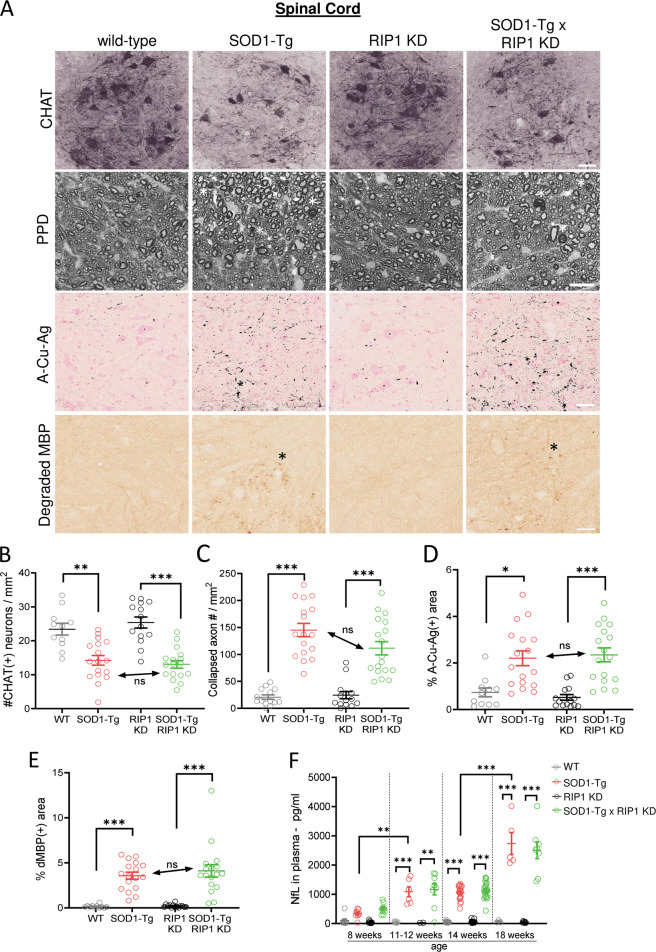
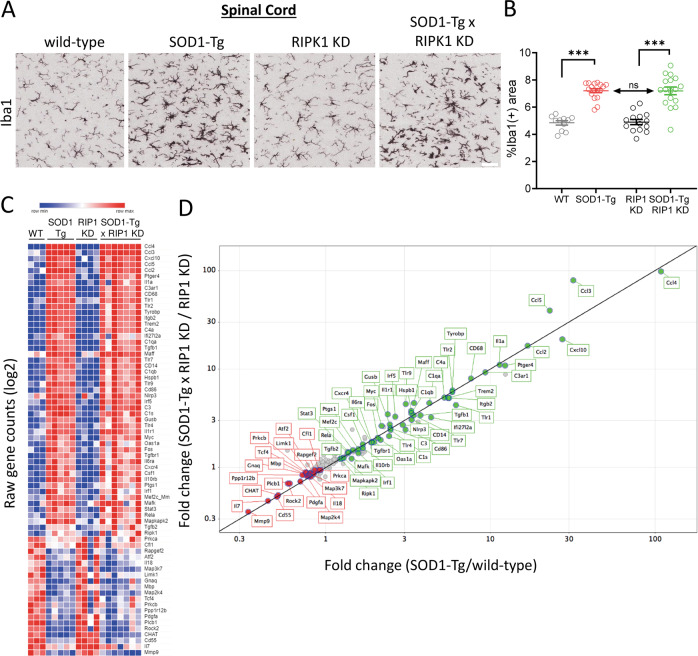
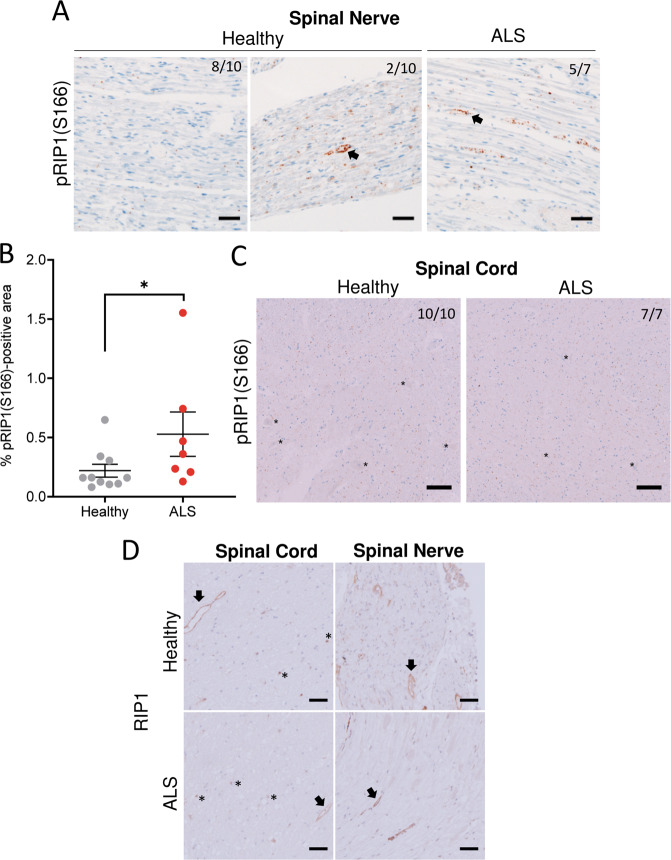
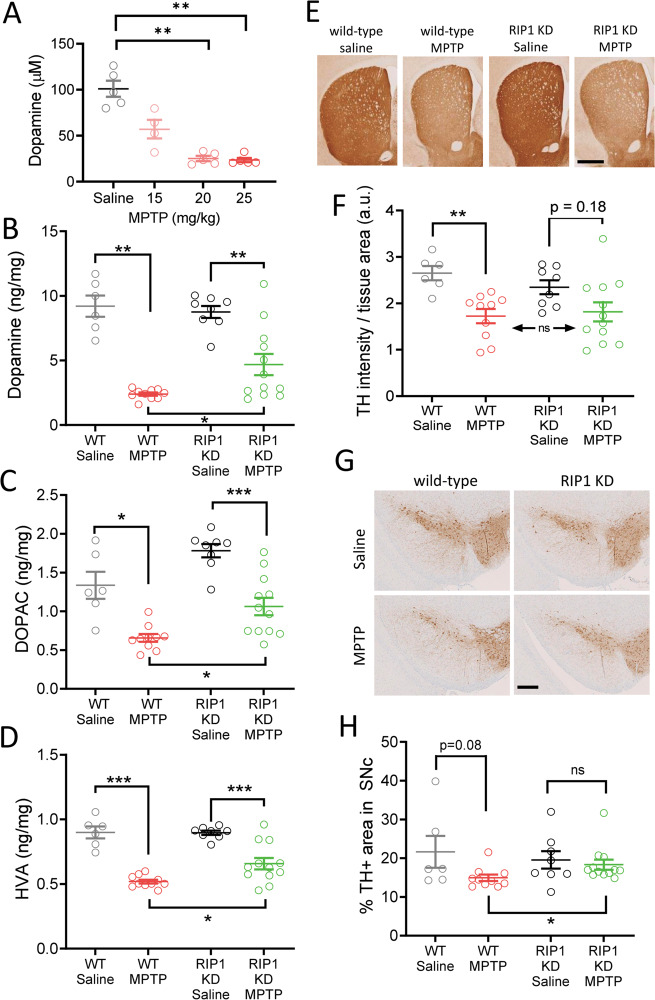
RIP1 kinase is proposed to play a critical role in driving necroptosis and inflammation in neurodegenerative disorders, including Amyotrophic Lateral Sclerosis (ALS). Preclinical studies indicated that while pharmacological inhibition of RIP1 kinase can ameliorate axonal pathology and delay disease onset in the mutant SOD1 transgenic (SOD1-Tg) mice, genetic blockade of necroptosis does not provide benefit in this mouse model. To clarify the role of RIP1 kinase activity in driving pathology in SOD1-Tg mice, we crossed SOD1-Tgs to RIP1 kinase-dead knock-in mice, and measured disease progression using functional and histopathological endpoints. Genetic inactivation of the RIP1 kinase activity in the SOD1-Tgs did not benefit the declining muscle strength or nerve function, motor neuron degeneration or neuroinflammation. In addition, we did not find evidence of phosphorylated RIP1 accumulation in the spinal cords of ALS patients. On the other hand, genetic inactivation of RIP1 kinase activity ameliorated the depletion of the neurotransmitter dopamine in a toxin model of dopaminergic neurodegeneration. These findings indicate that RIP1 kinase activity is dispensable for disease pathogenesis in the SOD1-Tg mice while inhibition of kinase activity may provide benefit in acute injury models.


Conflict of interest statement

TE and BB are former and all other authors are current employees of Genentech, Inc.

Figures

Fig. 1
Fig. 1. Increased pRIP1 in SOD1-Tg mice spinal cords in late-stage disease without detectable expression of RIP3 or MLKL. Genetic inactivation of RIP1 kinase does not provide protection against declining muscle strength and nerve physiology in the SOD1-Tg mice.
(a) Immunoblotting for RIP1, Tubulin and GAPDH in lysates from lumbar region of the spinal cords of WT and SOD1-Tg animals at the indicated ages. (b) Quantification of the immunoblot signal for RIP1 normalized to Tubulin, from (a). *p < 0.05 by One-Way ANOVA (Dunn’s). n = 3, 4 mice/age/genotype. (c, d) Immunoblotting for RIP3 (c) and MLKL (d) in lysates from lumbar region of the spinal cords of WT and SOD1-Tg animals at the indicated ages. WT and KO MEFs were used to verify the specificity of the immunoblotting signal as indicated. (e) Immunoblotting for the indicated proteins in lysates of brain regions in wild-type mice. In addition, lysates of wild-type MEFs and the corresponding RIP1, RIP3 or MLKL KO MEFs are immunoblotted to validate the immunoblotting antibodies. (f) Body weights of the mice with the indicated genotypes and ages. n = 14-18 animals/genotype. p = 0.1 by Two-Way ANOVA. (g, h) Hindpaw (g) and Forepaw (h) grip strength of mice with the indicated genotypes and ages. n = 14-18 animals/genotype. *p < 0.05 and ***p < 0.001 by Two-Way ANOVA (Tukey) between wild-type and SOD1-Tgs. (i) Representative CMAP traces recorded at the Tibialis Anterior Muscle of the mice with the indicated genotypes and ages. (j, k) Quantification of M Wave amplitude (j) and latency (k) in CMAP measurements, from (i). Wave amplitude and latency reflect the number of functional axons and speed of conductance, respectively. n = 14-18 animals/genotype. *p < 0.05 and ***p < 0.001 by Two-Way ANOVA (Tukey) between wild-type and SOD1-Tgs. All error bars represent S.E.M.
Fig. 2
Fig. 2. Genetic inactivation of RIP1 kinase activity does not alter axonal pathology in the SOD1-Tg mice.
(a) PPD and anti-CD68 staining in sciatic nerves of 14-week-old mice with the indicated genotypes. Scale bars, 10 µm for PPD staining and 90 µm for anti-CD68 staining. (b-d) Quantification of lumen size (b), myelin-positive area (c), and number of collapsed axons per mm2 (d) calculated based on PPD staining in (a). n = 14-18 animals/genotype. *p < 0.05 and ***p < 0.001 by One-Way ANOVA (Dunn’s). (e) Quantification of number of CD68-positive cells per mm2, from (a). n = 14-18 animals/genotype. ***p < 0.001 by One-Way ANOVA (Dunn’s). All error bars represent S.E.M.
Fig. 3
Fig. 3. Genetic inactivation of RIP1 kinase activity does not ameliorate neurodegeneration in the SOD1-Tg mice.
(a) Anti-CHAT, PPD, A-Cu-Ag and anti-degraded MBP staining in spinal cords of 14-week-old mice with the indicated genotypes. Scale bars: 27 µm for PPD staining and 40 µm for anti-CHAT, A-Cu-Ag and anti-degraded MBP staining. (b-e) Quantification of number of CHAT-positive neurons per mm2 (b), number of collapsed axons per mm2 (c), percent A-Cu-Ag (d) and degraded MBP (e) -positive area in ventral horn of lumbar spinal cord, from (a). (b-d) were calculated across the entire cross section of L3-L5 spinal cord. n = 11-18 animals/genotype. *p < 0.05, **p < 0.01 and ***p < 0.001 by One-Way ANOVA (Dunn’s). (f) NfL levels in plasma of mice with the indicated ages and genotypes. n = 2-23 animals/genotype/age. **p < 0.01 and ***p < 0.001 by Two-Way ANOVA (Tukey). All error bars represent S.E.M.
Fig. 4
Fig. 4. Genetic inactivation of RIP1 kinase activity does not alter inflammation in the SOD1-Tg mice spinal cords.
(a) Anti-Iba1 staining in spinal cords of 14-week-old mice with the indicated genotypes. Scale bar, 40 µm. (b) Quantification of percent of anti-Iba1-positive area, from (a). n = 11-17 animals/genotype. ***p < 0.001 by One-Way ANOVA (Dunn’s). (c) Heat map depicting gene counts measured by Nanostring analysis in spinal cords of 18-week-old mice with the indicated genotypes. Out of 262 neuroinflammation and 5 RIP pathway-associated mRNAs analyzed, 172 of them showed detectable expression (as defined by >10 counts). Each row represents a gene that displayed differential expression in SOD1-Tgs compared to wild-types among these 172 genes (FDR (Q) < 0.01). Color scale is adjusted within each row based on the highest (red) and lowest (blue) expression of a given gene across all animals. n = 3-7 mice. (d) Plot showing fold-changes in expression of genes highlighted in (C) between “wild-type vs SOD1-Tgs” (x-axis) and “RIP1-KD vs SOD1-Tg x RIP1-KDs” (y-axis) comparisons. Green symbols: upregulated, red: downregulated, gray: no change n = 3-7 mice. All error bars represent S.E.M.
Fig. 5
Fig. 5. RIP1 kinase activation in ALS is limited to endothelial cells in the spinal nerve.
(a, c) Representative images of pRIP1(S166) in spinal nerves (a) and spinal cords (c) of healthy controls and ALS patients. Numbers of samples with the indicated representative staining out of the total number of samples analyzed are indicated at the top of the images. In (a), arrows indicate positive-labeling associated with vascular endothelium. In (c), asterisks indicate the motor neuron cell bodies. Scale bars, 50 µm. (b) Quantification of percent pRIP1(S166)-positive area in spinal nerves, from (a). n = 7-10 samples. *p < 0.05 by Mann-Whitney test. (d) Representative images of total RIP1 in the spinal cords and nerves. Arrows indicate the positive-labeling associated with vascular endothelium. Asterisks indicate the positive-labeling associated with neuroparenchyma. Scale bars, 50 µm. All error bars represent S.E.M.
Fig. 6
Fig. 6. Genetic inactivation of RIP1 kinase activity is partially protective in the MPTP model.
(a) Striatal dopamine levels in MPTP-treated wild-type mice. **p < 0.01 by One-Way ANOVA (Dunn’s). n = 4-5 mice/group. (b-d) Striatal dopamine (b), DOPAC (c) and HVA (d) levels in Saline or MPTP-treated wild-type and RIP1-KD mice. The analysis was performed at 7 days post-MPTP treatment. *p < 0.05, **p < 0.01 and ***p < 0.001 by Brown-Forsythe and Welch One-Way ANOVA (Dunnett’s T3). n = 6-12 mice/group. (e, g) Immunohistochemistry for TH in striatum (e) and midbrain (g) of Saline or MPTP-treated wild-type or RIP1-KD mice. Scale bars, 700 µm (e), 300 µm (g). (f, h) Quantification of striatal TH density (f) and percent of TH+ area in the substantia nigra, from (e) and (g), respectively. *p < 0.05 and **p < 0.01 by One-Way ANOVA (Dunn’s). n = 6-12 mice/group. All error bars represent S.E.M.

References

    1. Martens S, Hofmans S, Declercq W, Augustyns K, Vandenabeele P. Inhibitors targeting RIPK1/RIPK3: old and new drugs. Trends Pharmacol Sci. 2020;41:209–24. - PubMed
    1. Degterev A, Ofengeim D, Yuan J. Targeting RIPK1 for the treatment of human diseases. Proc Natl Acad Sci USA. 2019;116:9714–22. - PMC - PubMed
    1. Degterev A, Hitomi J, Germscheid M, Ch’en IL, Korkina O, Teng X, et al. Identification of RIP1 kinase as a specific cellular target of necrostatins. Nat Chem Biol. 2008;4:313. - PMC - PubMed
    1. Polykratis A, Hermance N, Zelic M, Roderick J, Kim C, Van T-M, et al. Cutting edge: RIPK1 Kinase inactive mice are viable and protected from TNF-induced necroptosis in vivo. J Immunol. 2014;193:1539–43. - PMC - PubMed
    1. Ofengeim D, Ito Y, Najafov A, Zhang Y, Shan B, DeWitt JP, et al. Activation of necroptosis in multiple sclerosis. Cell Rep. 2015;10:1836–49. - PMC - PubMed