. 2021 Jan-Feb:72:101745.
doi: 10.1016/j.jcrimjus.2020.101745. Epub 2020 Sep 24.

Druglords don't stay at home: COVID-19 pandemic and crime patterns in Mexico City

Affiliations

Druglords don't stay at home: COVID-19 pandemic and crime patterns in Mexico City

Jose Roberto Balmori de la Miyar et al. J Crim Justice. 2021 Jan-Feb.

Abstract

Objective: To investigate the effect of the COVID-19 pandemic on conventional crime and organized crime in Mexico City, Mexico.

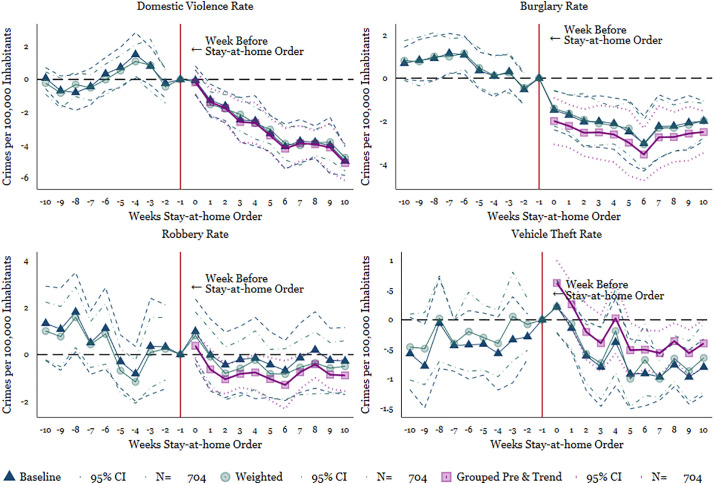
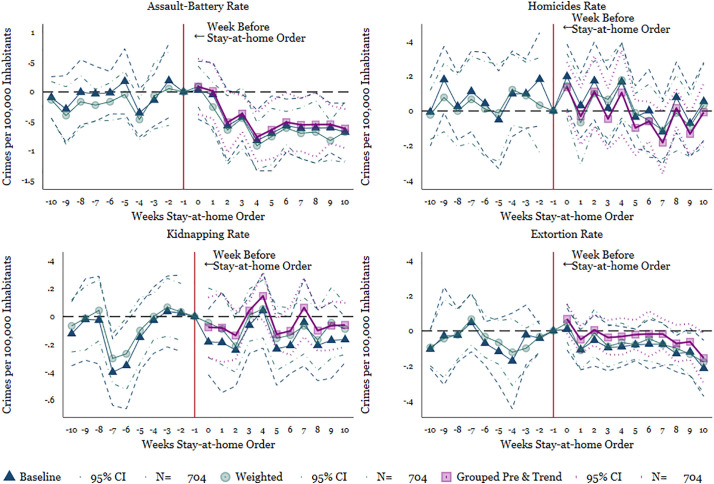
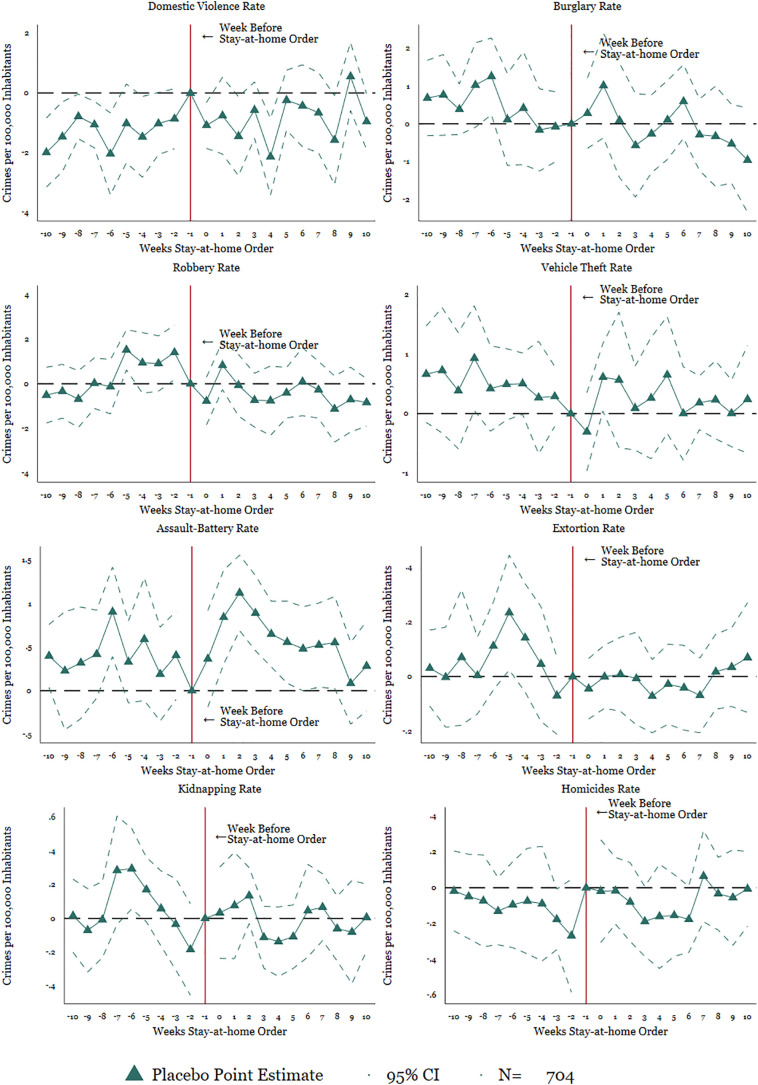
Methods: Mexico City's Attorney General's Office reported crime data, covering domestic violence, burglary, robbery, vehicle theft, assault-battery, homicides, kidnapping, and extortion. We use an event study for the intertemporal variation across the 16 districts (municipalities) in Mexico City for 2019 and 2020.

Results: We find a sharp decrease on crimes related to domestic violence, burglary, and vehicle theft; a decrease during some weeks on crimes related to assault-battery and extortion, and no effects on crimes related to robbery, kidnapping, and homicides.

Conclusions: While our results show a decline in conventional crime during the COVID- 19 pandemic, organized crime remains steady. These findings have policy implications for catastrophic events around the world, as well as possible national security issues in Mexico.

Keywords: COVID-19; Crime; Mexico; Organized crime.


Conflict of interest statement

None.

Figures

Fig. 1
Fig. 1
Mobility in Mexico city. SOURCE: Apple Mobility Trends Reports (2020)
Fig. 2
Fig. 2
Event study: main findings. SOURCE: Mexico City’s Attorney General’s Office Administrative Data. NOTES: Plotted coefficients are event-study dummy variables, βq, from Equation 1. Each plotted point represents the number of weeks before and after the lockdown, excluding the period just before adoption. Solid lines represent point estimates. Dashed and dotted lines display the 95 percent confidence intervals. Baseline fixed effects are included at the district (municipality), week, and year. Robust standard errors are clustered at the district (municipality) level. Crime rates are measured per 100,000 inhabitants.
Fig. A.1
Fig. A.1
Event study: robustness of main findings i. SOURCE: Mexico City's Attorney General's Office Administrative Data. NOTES: The blue triangles reflect the baseline specification from Equation 1. The green circles show the plotted points with district-specific weights. The purple squares show the results from the specification with the grouped pre-period and reflect the post-period: weeks zero through 10. The grouped pre-period groups all periods before week zero and includes a linear district-specific weekly trend. Plotted coefficients are event-study dummy variables, βq, from Equation 1. Each plotted point represents the number of weeks before and after the lockdown, excluding the period just before adoption. Solid lines represent point estimates. Dashed and dotted lines display the 95 percent confidence intervals. Baseline fixed effects are included at the district (municipality), week, and year. Robust standard errors are clustered at the district (municipality) level. Crime rates are measured per 100,000 inhabitants.
Fig. A.2
Fig. A.2
Event Study: Robustness of Main Findings 2. SOURCE: Mexico City’s Attorney General’s Office Administrative Data. NOTES: The blue triangles reflect the baseline specification from Equation 1. The green circles show the plotted points with district-specific weights. The purple squares show the results from the specification with the grouped pre-period and reflect the post-period: weeks zero through 10. The grouped pre-period groups all periods before week zero and includes a linear district-specific weekly trend. Plotted coefficients are event-study dummy variables, βq, from Equation 1. Each plotted point represents the number of weeks before and after the lockdown, excluding the period just before adoption. Solid lines represent point estimates. Dashed and dotted lines display the 95 percent confidence intervals. Baseline fixed effects are included at the district (municipality), week, and year. Robust standard errors are clustered at the district (municipality) level. Crime rates are measured per 100,000 inhabitants.
Fig. A.3
Fig. A.3
Robustness: event study using a placebo test. SOURCE: Mexico City’s Attorney General’s Office Administrative Data. NOTES: Plotted coefficients are event-study dummy variables, βq, from Equation 1. Each plotted point represents the number of weeks before and after the lockdown, excluding the period just before adoption. Solid lines represent point estimates. Dashed and dotted lines display the 95 percent confidence intervals. Baseline fixed effects are included at the district (municipality), week, and year. Robust standard errors are clustered at the district (municipality) level. Crime rates are measured per 100,000 inhabitants.

References

    1. Anderson M.L. Multiple Inference and Gender Differences in the Effects of Early Intervention: a reevaluation of the abecedarian, perry preschool, and early training projects. J. Am. Stat. Assoc. 2008;103:1481–1495.
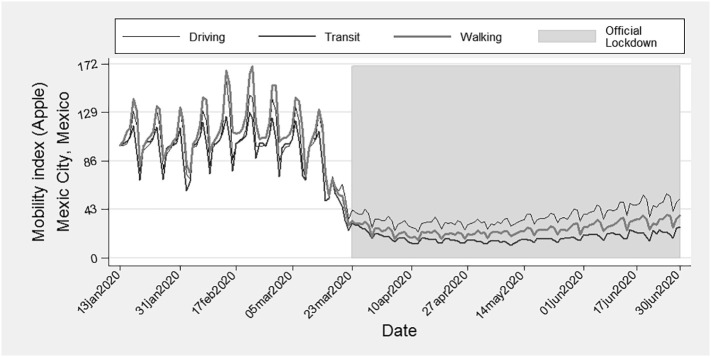
    1. Apple . 2020. Mobility Trends Reports. https://www.apple.com/covid19/mobility.
    1. Attorney General’s Office, M. C Carpetas de investigación PGJ. 2020. https://datos.cdmx.gob.mx/explore/dataset/carpetas-de-investigacion-pgj-cdmx/custom/
    1. Bergman M. 2018. Criminal Diversification and Corruption in the Drug Business; pp. 63–72.
    1. Brown R., Montalva V., Velásquez A., Thomas D. 2015. The Economic Burden of Crime. Working Paper.

LinkOut - more resources