. 2020 Sep 16;6(9):e04938.
doi: 10.1016/j.heliyon.2020.e04938. eCollection 2020 Sep.

Micellar effects and analytical applications of nitro substitution in 4-Nitro- N-alkyl-1,8-naphthalimide by cysteine derivatives

Affiliations

Micellar effects and analytical applications of nitro substitution in 4-Nitro- N-alkyl-1,8-naphthalimide by cysteine derivatives

V S Martins et al. Heliyon. .

Abstract

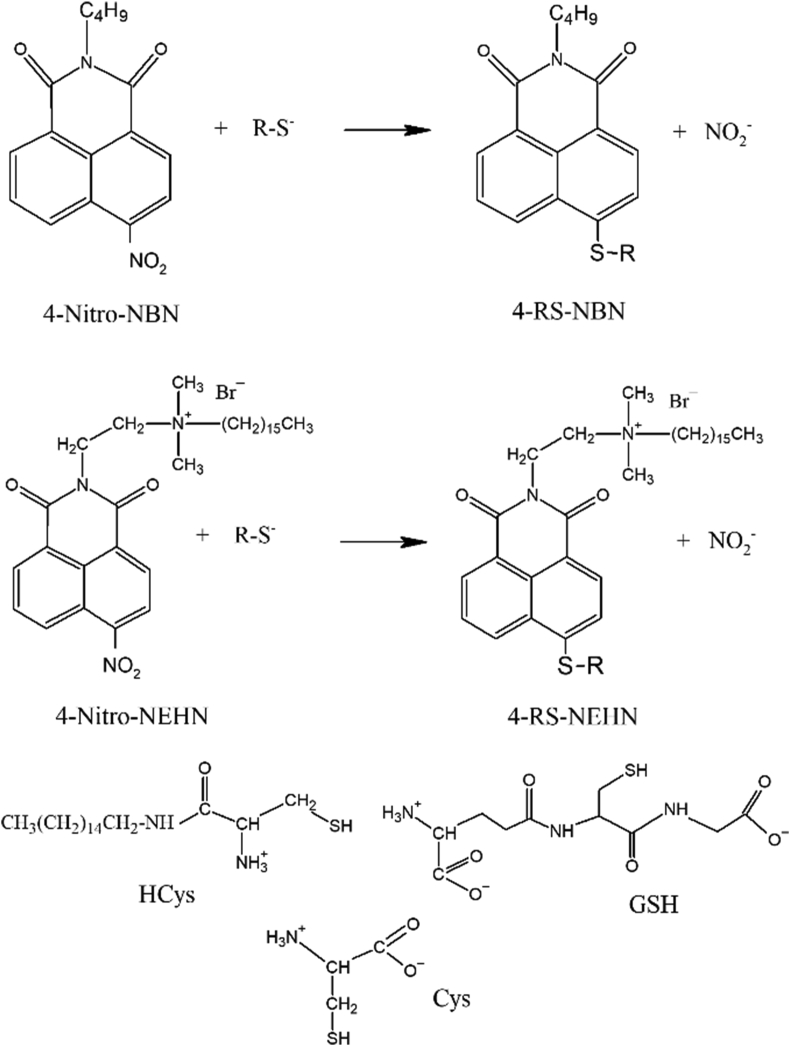
The aromatic nucleophilic substitution reactions of the nitro group of 4-Nitro-N-alkyl-1,8-naphthalimides by thiolate anions produce fluorescent derivatives and their rates are strongly accelerated by micelles of hexadecyltrimethylammonium chloride even at low pH. Acceleration factors of this reactions can reach million-fold. As the products are oxidant-insensible, this reaction allows the determination of SH- containing compounds such as cysteine, glutathione or proteins even in oxidative conditions. Limits of detection are as low as 5 × 10⁻⁷ M, ten times lower than the limit for the classic 5,5'-dithiobis-(2-nitrobenzoic) acid method. Moreover, this reaction can be developed at pHs between 6.5 and 7.5 thereby diminishing the rate of spontaneous oxidation of the thiols. In addition, we demonstrated that 4-Nitro-N-alkyl-1,8-naphthalimides can be used to evidence SH groups in peptides, proteins and living cells.

Keywords: Analytical chemistry; Fluorescence assay; Micellar solutions; Organic chemistry; Protein thiols; Thiol levels.


Figures

Scheme 1
Scheme 1
Reactions between the thiols GSH, Cys and HCys with 4-Nitro-Alkyl-Naphthalimides (4-Nitro-NBN and 4-Nitro-NEHN) forming the thioethers 4-RS-NBN and 4-RS-NEHN.
Figure 1
Figure 1
Mass Spectrum of 4-nitro-1,8-naphthalimide-N-ethylene-N, N′-dimethyl, N″-hexadecyl bromide, ESI+ 538.3 m/z.
Figure 2
Figure 2
-1H NMR of 4-nitro-1,8-naphthalimide-N-ethylene-N, N′-dimethyl, N″-hexadecyl bromide (500 MHz, CD3OD, TMS) δ (ppm): A) complete spectrum. B) Expansion of the 7.5–9.0 ppm region.
Figure 3
Figure 3
13C NMR of 4-nitro-1,8-naphthalimide-N-ethylene-N, N′-dimethyl, N″-hexadecyl bromide (125 MHz, CD3OD, TMS) δ (ppm).
Figure 4
Figure 4
FTIR of 4-nitro-1,8-naphthalimide-N-ethylene-N, N′-dimethyl, N″-hexadecyl bromide.
Figure 5
Figure 5
Spectra of the reaction product(s), as a function of time, of 4-nitro-NBN with: (A) Cys (0.01 M) in Tris/HCl 0.1 M, pH 8.23 buffer, at the following times (min): a) 0; b) 10; c) 30; d) 40; e) 60; f) 68. B) GSH (0.01 M) in Tris/HCl 0.1 M, pH 8.64; times (min): a) 0; b) 4; c) 10; d) 19; e) 27; f) 47; g) 67. C) Observed rate constants (kψ0) as a function of the anionic concentration of Cys, [Cys], in borate buffer 0.15 M pH 10.0 (●) and anionic form of glutathione [GS] in CAPSO 0.15 M buffer, at initial pH of 10.6 (◯). The concentration of 4-nitro-NBN was 8.9 × 10⁻⁶ M in all experiments.
Figure 6
Figure 6
Effect of [CTAC] on the pKap of: A) HCys, Tris/HCl 0.01 M pH 8.53, [HCys] = 4.58 × 10⁻⁵ M. B) Cys in Tris/HCl 0.01 M pH 8.5, [Cys] = 5.82 × 10⁻⁵ M. C) GSH, Tris/HCl buffer, 0.01 M, pH 9.05, [GSH] = 4.8 × 10⁻⁵ M. Inset- Absorbance of GSH at 231 nm as a function of pH 6.1 × 10⁻⁵ M (D) Effect of [NaCl] in the pKap of GSH, at [CTAC] = 0.008 M and [GSH] = 5 × 10⁻⁵ M, Tris/HCl buffer, 0.01 M, pH 9.05. In all experiments [TCEP] = 1 × 10⁻⁴ M. Symbols are experimental points and lines (A, B and C) were calculated using Eqs. (3), (4), (5), (6), (7), and (8).
Figure 7
Figure 7
Effect of [CTAC] on the rate constants of the reactions of Cys with: A) 4-Nitro-NBN in TRIS/HCl buffer 0.01 M, pH 8.5, [4-nitro-NBN] = 3.72 × 10⁻⁶ M and [Cys] = 5.53 × 10⁻⁵ M. B) 4-nitro-NEHN in HEPES buffer, 0.01 M, pH 7.5 and ((●)TRIS/HCl pH 8.0, [4-nitro-NEHN] = 4.15 × 10⁻⁶ M, [Cys] = 4.9 × 10⁻⁵ M (◯).
Figure 8
Figure 8
Spectra of the reaction mixtures of HCys and GSH with 4-nitro-NBN in CTAC in Tris/HCl 0.01M, pH = 7.0, as a function of time (min). A) HCys: a) t = 0; b) t = 0.5; c) t = 1.0; d) t = 1.5; e) t = 5. HCys = 5.27 × 10⁻⁵ M. B) GSH: a) t = 0; b) t = 2.5; c) t = 5; d) t = 10; e) 15; f) 30, GSH, 5 × 10⁻⁵ M. All reaction mixtures contained [CTAC] = 2 × 10⁻³ M and [4-nitro-NBN] = 8.2 × 10⁻⁶ M.
Figure 9
Figure 9
Effect of [CTAC] on the rate constant of the reaction of 4-nitro-NBN and thiols at different pHs. A) GSH in Tris/HCl 0.01M pH 7.5 buffer, [GSH] = 4.9 × 10⁻⁵ M (the symbols (●) and (○) are two independent sets of experiments. B) GSH in Tris/HCl 0.01M pH 7.11 buffer (○) and MES 0.01 M, pH 7.1 (●) [GSH] = 4.9 × 10⁻⁵ M. C) HCys in MES 0.01 M, pH 5.52 (●, ○) [HCYS] = 4.58 × 10⁻⁵ M. [4-nitro-NBN] = 3.92 × 10⁻⁶ M for all experiments. The symbols are experimental data and the lines are theoretical (see text).
Figure 10
Figure 10
Effect of [CTAC] on the reaction rates of 4-nitro-NEHN with: A) HCys in MES buffer, 0.01 M, pH 5.54, [4-nitro-NEHN] = 4.15 × 10⁻⁶ M, [HCys] = 4.60 × 10⁻⁵ M. The symbols (◯) and (●) refers to two different sets of experiments. Insert shows the effect of NaCl concentration in the reaction rate at CTAC 1.2 mM at pH 5.54. B) GSH in MES buffer 0.01 M, pH 5.12 (□); pH 6.07 (●); pH 6.53 (◯) and T. Tris/HCl 0.01 M pH 7.0 (▲); The symbols are experimental data and the lines. [4-nitro-NEHN] = 3.72 × 10⁻⁶ and [GSH] = 4.8 × 10⁻⁵. C) Effect of CTAC in the reaction of GSH and 4-nitro-NEHN in Tris/HCl 0.004 M, pH 7.83. The [4-nitro-NEHN] was 5 × 10⁻⁶ M and [GSH] was 5 × 10⁻⁵ M.
Figure 11
Figure 11
Emission fluorescence spectra of the reaction products of 4-nitro-NEHN and 4-nitro-NBN with HCys and GSH in CTAC as a function of time (min). (A) [HCys] = 4.6 × 10⁻⁵ M, [4-nitro-NBN] = 4.1 × 10⁻⁶ M, MES, 0.01 M, pH 5.5. Time (min): a) 0.5; b) 1.4; c) 3.6; d) After 10 min (B) [HCys] = 6.2 × 10⁻⁵ M, [4-nitro-NEHN] = 4.5 × 10⁻⁶ M, MES, 0.01 M, pH 5.5. Time (min): a) 0.2; b)1.0. (C) [GSH] = 4.6 × 10⁻⁵ M, [4-nitro-NBN] = 4.1 × 10⁻⁶ M, Tris/HCl 0.01 M, pH 7.5. Times (min): a) 0.45; b) 1.5; c) 2.2; d) After 10 min. (D) [GSH] = 4.9 × 10⁻⁵, [4-nitro-NEHN] = 4.5 × 10⁻⁶, Tris/HCl 0,01 M, pH 7.5. Time (min): a) 0.2; b) 1.0. [CTAC] = 9.8 × 10⁻⁴ M λexc (4-nitro-NBN) = 390 nm, λ exc (4-nitro-NEHN) = 400 nm.
Figure 12
Figure 12
Fluorescence standard curves of the reaction's products of 4-nitro-NEHN and 4-nitro-NBN with HCys and GSH at different pHs. A) (●) [4-nitro-NBN] = 2.7 × 10⁻⁵ M, R2 = 0.998 and slope = 6.4; (◯) [4-nitro-NEHN] = 2.7 × 10⁻⁵ M, MES (0.01 M), pH 6.5. R2 = 0.990 and slope = 3.0. B) (●) [4-nitro-NBN] = 3.6 × 10⁻⁵ M, R2 = 0.988 and slope = 16.7; (◯) [4-nitro-NEHN] = 2.7 × 10⁻⁵ M, Tris/HCl, 0.01 M, pH 7.0, R2 = 0.999 and slope = 30.5. All experiments contained [CTAC] = 1.4 × 10⁻³ M. Fluorescence was read after 10 min. For 4-nitro-NBN, λexc = 390 nm, λem = 463 nm and for 4-nitro-NEHN, λexc = 400 nm, λem = 487 nm. C) Standard curves of Cys with 4-Nitro-NBN, R2 = 0.999 and slope = 12.6 (●) and 4-nitro-NEHN (◯) in Tris/HCl 0.01M pH 8.0, R2 = 0.998 and slope 9.4. The concentrations of 4-nitro-NEHN and 4-Nitro-NBN were 6.0 × 10⁻⁵ M and [CTAC] 1.5 × 10⁻³ M λexc = 390 nm; λem = 487 nm (Incubation time 1 h). Points are triplicate averages.
Figure 13
Figure 13
Fluorescence spectra of the products of the reaction of PRDX2 with 4-nitro-NEHN (A) and 4-nitro-NBN (B) at the end of the reaction (5 min) at different concentrations of PRDX2, [PRDX2] in Tris/HCl 0.01M, pH 7.5 buffer, 5 mM CTAC. The [PRX2] used were: a) 0.25; b) 0.5; c) 1.0; d) 1.5; e) 2.0 and f) 2.5 μM). (C) Standard curve of the fluorescence of the products of PRDX2 and nitro-naphthalimides, at the end of the reactions, vs [PRDX2]: (●) [4-nitro-NBN (R2 = 0.995, slope = 20561 and (◯) 4-nitro-NEHN (R2 = 0.999 and slope = 14408). The concentration of 4-nitro-NEHN and 4-nitro-NBN were 250 μM and the total volume was 0.4 mL. The λexc was 390 nm and λem was 470 nm. Points are averages of duplicates.
Figure 14
Figure 14
Fluorescence microscopy images of dHL-60 (left A-D) and dTHP-1 (right E-H). The cells (5 × 10⁶ for dHL-60 or 2 × 10⁶ for dTHP-1) were incubated at 37 °C in PBS/glucose. A and E controls without probe; B and F 100 μM 4-NBN for 30 min; C and G pre-incubated with 5 mM hydrogen peroxide for 15 min followed by 100 μM 4-NBN for 30 min and; D and H pre-incubated with 100 μM 4-NBN for 30 min followed by 5 mM hydrogen peroxide for 15 min. The images groups were captured in Nikon Eclipse TE300 (40 x objective lens) in phase contrast and fluorescence microscopy (excitation at UV light and emission detection with a blue filter).

Similar articles

References

    1. Roos G., Foloppe N., Messens J. Understanding the pKa of redox cysteines: the key role of hydrogen bonding. Antioxidants Redox Signal. 2013;18:94–127. - PubMed
    1. Jacob C., Giles G.I., Giles N.M., Sies H. Sulfur and selenium: the role of oxidation state in protein structure and function. Angew. Chem. Int. Ed. 2003;42:4742–4758. - PubMed
    1. Benesch R.E., Benesch R. The acid strength of the -SH group in cysteine and related compounds. J. Am. Chem. Soc. 1955;77:5877–5881.
    1. Danehy J.P., Noel C.J. The relative nucleophilic character of several mercaptans toward ethylene oxide. J. Am. Chem. Soc. 1960;82:2511–2515.
    1. Jung G., Breitmaier E., Voelter W. Dissoziationsgleichgewichte von Glutathion. Eur. J. Biochem. 1972;24:438–445. - PubMed