[Preprint]. 2021 Mar 29:2020.09.14.295824.
doi: 10.1101/2020.09.14.295824.

SARS-CoV-2 nucleocapsid protein forms condensates with viral genomic RNA

Affiliations

SARS-CoV-2 nucleocapsid protein forms condensates with viral genomic RNA

Amanda Jack et al. bioRxiv. .

Update in

Abstract

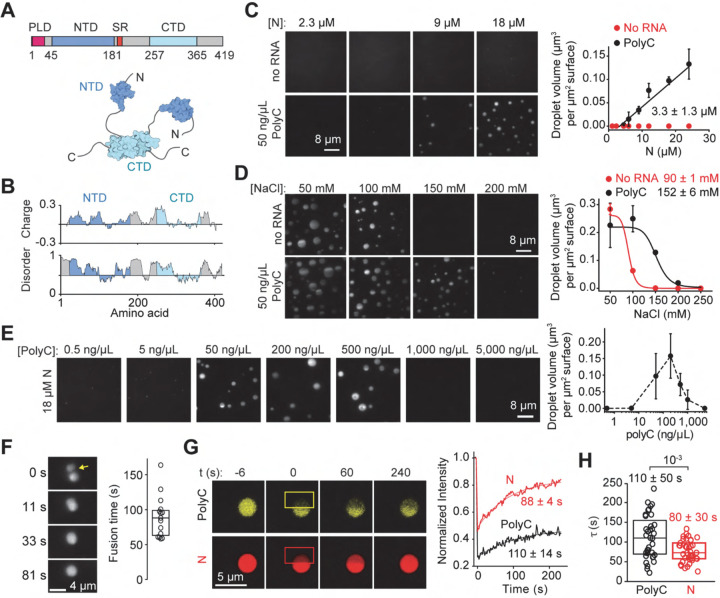
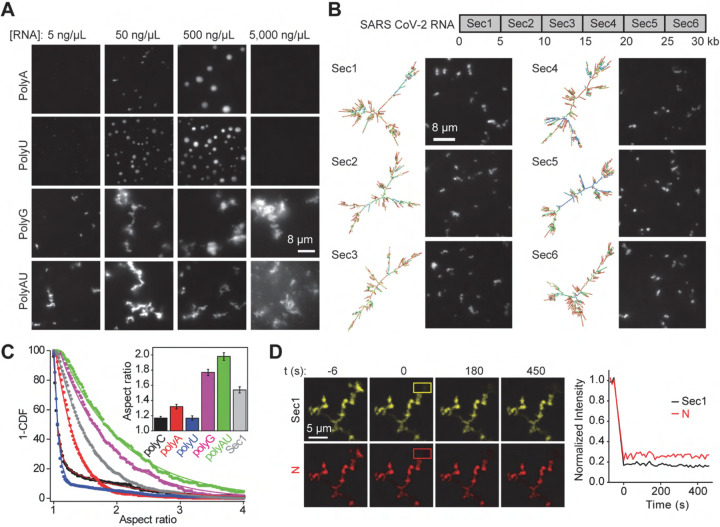
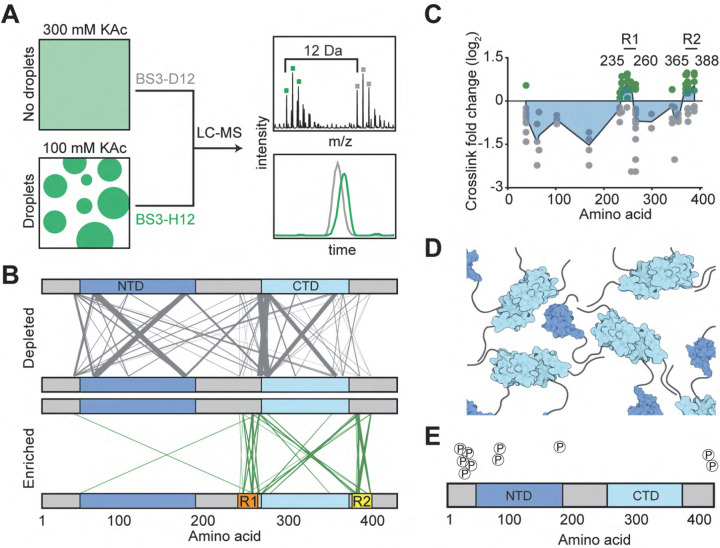
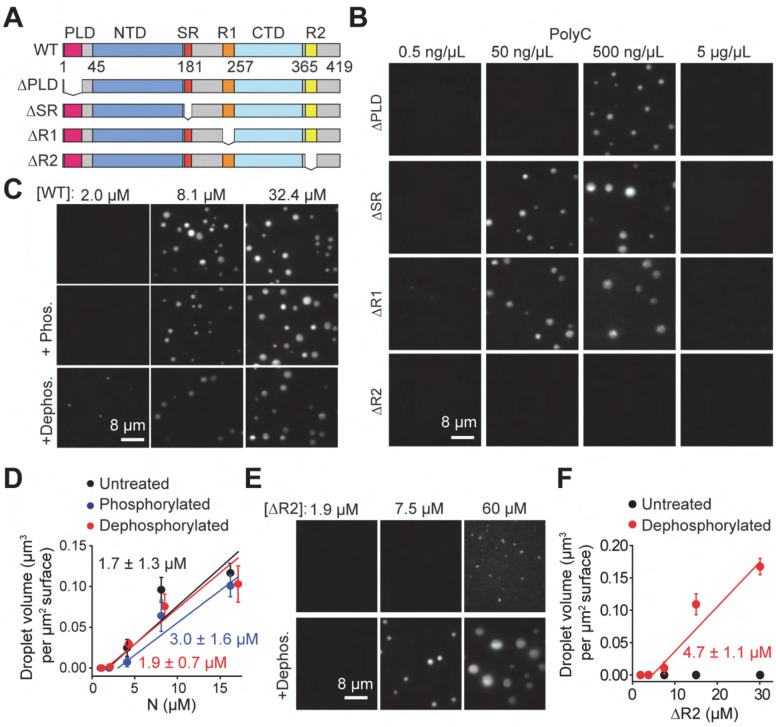
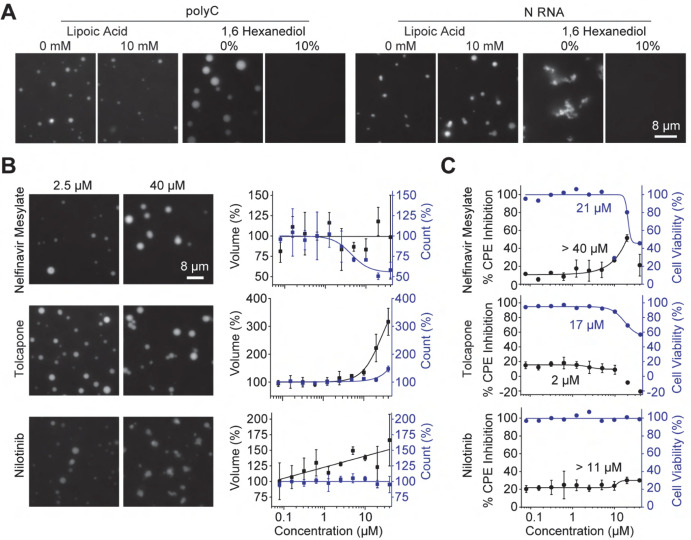
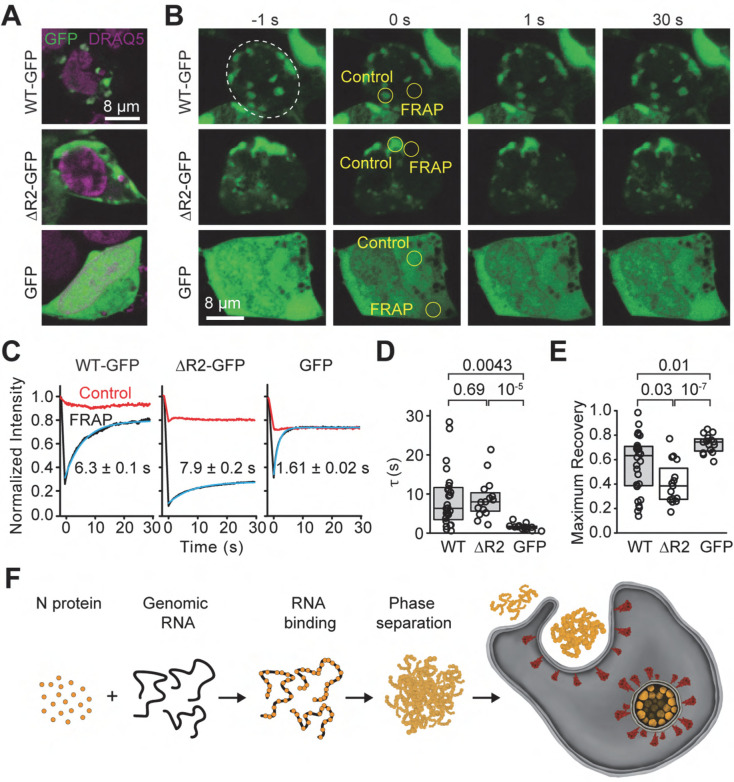
The severe acute respiratory syndrome coronavirus 2 (SARS-CoV-2) infection causes COVID-19, a pandemic that seriously threatens global health. SARS-CoV-2 propagates by packaging its RNA genome into membrane enclosures in host cells. The packaging of the viral genome into the nascent virion is mediated by the nucleocapsid (N) protein, but the underlying mechanism remains unclear. Here, we show that the N protein forms biomolecular condensates with viral genomic RNA both in vitro and in mammalian cells. Phase separation is driven, in part, by hydrophobic and electrostatic interactions. While the N protein forms spherical assemblies with unstructured RNA, it forms asymmetric condensates with viral RNA strands that contain secondary structure elements. Cross-linking mass spectrometry identified a region that forms interactions between N proteins in condensates, and truncation of this region disrupts phase separation. We also identified small molecules that alter the formation of N protein condensates. These results suggest that the N protein may utilize biomolecular condensation to package the SARS-CoV-2 RNA genome into a viral particle.


Conflict of interest statement

Declaration of interests The authors declare no competing interests.

Figures

Figure 1.
Figure 1.. The SARS-CoV-2 N protein phase separates with RNA in vitro.
(A) Domain organization and the schematic of the N protein dimer. (B) Sliding window plot of charge distribution (EMBOSS) and disorder prediction (IUPred2A) for the N protein. Charge y-axis represents mean charge across a 30-residue sliding window. Disorder prediction (1, disordered; 0, ordered) was calculated using the “long disorder” setting, encompassing a 30-residue sliding window. (C) (Left) Images of the LD655-labeled N protein in the presence and absence of polyC RNA in 150 mM NaCl. (Right) The total volume of N-RNA condensates settled per micron squared area on the coverslip with 50 ng/μL polyC RNA (mean ± s.d., n = 20 with two technical replicates). A linear fit (solid line) reveals csat (± s.e.), the minimum N protein concentration for condensate formation (see Methods). (D) (Left) Condensates formed by 24 μM LD655-labeled N protein in the presence or absence of 50 ng/μL polyC RNA dissolve by increasing NaCl concentration. (Right) The total volume of N condensates settled per micron squared area on the coverslip with increasing salt concentration (mean ± s.d., n = 20 with two technical replicates). Solid curves represent a fit to a dose-response equation to determine IC50 (±s.e.). (E) The stoichiometry of the N protein and RNA affects phase separation. (Left) Example pictures show that Cy3-labeled N protein forms condensates with different concentrations of polyC RNA. The N protein concentration was set to 18.5 μM. (Right) The total volume of N-polyC condensates settled per micron squared area on the coverslip under different RNA concentrations (mean ± s.d.; n = 20, two technical replicates). (F) (Left) The fusion of N-polyC condensates formed in the presence of 18.5 μM LD655-labeled N and 50 ng/μL polyC RNA. (Right) Fusion time of N-polyC condensates (mean ± s.d., n = 15 fusion events). The center and edges of the box represent the median with the first and third quartiles. (G) (Left) Representative FRAP imaging of an N-polyC condensate. The image of a condensate before the time of photobleaching (0 s) shows colocalization of Cy3-polyC and LD655-N in the condensate. Rectangles show the photobleached area. (Right) Fluorescence recovery signals of N and polyC in the bleached region. Solid curves represent a single exponential fit to reveal the recovery lifetime (τ, ±95% confidence interval). (H) The distribution of fluorescence recovery lifetimes of N and polyC in droplets (n = 37). The center and edges of the box represent the median with the first and third quartiles. The p-value was calculated from a two-tailed t-test.
Figure 2.
Figure 2.. The N protein forms asymmetric condensates with viral RNA.
(A) The N protein forms spherical condensates with unstructured RNA (polyA and polyU) but forms asymmetric condensates with structured RNA (polyG and polyAU). The N protein concentration was set to 18.5 μM. (B) (Top) SARS-Cov-2 genomic RNA was divided into 6 sections. (Bottom, left) Structure prediction of each section and (Bottom, right) the formation of asymmetric N condensates in the presence of 18 nM RNA. The N protein concentration was set to 18.5 μM. (C) The inverse cumulative distribution (1-CDF) of the aspect ratio of individual N condensates formed with different RNA substrates. The concentrations of N protein, RNA homopolymers, and Sec1 RNA were set to 18.5 μM, 50 ng/μL, and 18 nM, respectively. Solid fits represent a fit to exponential decay. (Insert) Decay constants of the exponential fits (±s.e.). (D) (Left) Representative FRAP imaging of an N-Sec1 condensate. The image of a condensate before the time of photobleaching (0 s) shows colocalization of Cy3-Sec1 and LD655-N in the condensate. Rectangles show the photobleached area. (Right) N and Sec1 do not exhibit fluorescence recovery in the bleached region (n = 16).
Figure 3.
Figure 3.. CLMS reveals inter-domain interactions of the N protein.
(A) Schematic of the CLMS experiment. (Left) A high salt (300 mM KAc) buffer disrupts N condensates, whereas a low salt (100 mM KAc) buffer promotes condensate formation. (Right, top) Example of an individual crosslinked peptide in quantitative CLMS analysis. Precursor ions from the high salt (gray) and low salt (green) BS3 crosslinking conditions show the 12 Da shift between light (H12) and heavy (D12) crosslinkers. (Right, bottom) Ion chromatograms from the first three isotopes of each doublet were extracted and expressed as the ratio of peak areas. (B) The plot of crosslinks depleted and enriched in the condensate condition. The width and transparency of the lines scale with the number of times the crosslink was detected across 3 independent experiments. (C) Fold changes of crosslink abundance upon condensate formation of N. As crosslinks contain two positions, fold change information is plotted at both positions. Only crosslinks with p-values less than 0.05 are included. Green and grey dots represent crosslinks enriched and depleted in the condensate condition, respectively. The blue area represents a plot of median crosslink fold change. (D) Model for how multiple N dimers could phase separate via their disordered regions. (E) Phosphorylation sites detected by the CLMS experiment in 300 mM KAc.
Figure 4.
Figure 4.. The effect of domain truncations and phosphorylation on phase separation of the N protein.
(A) Truncation mutants of the N protein. (B) While ΔPLD, ΔSR, and ΔR1 phase separate, ΔR2 does not phase separate when mixed with polyC RNA. Protein concentration was set at 18 μM for all conditions. (C) Images of condensates formed by untreated, phosphorylated, and dephosphorylated N protein in 50 ng/μL polyC RNA. (D) The total volume of N-RNA condensates settled per micron squared area on the coverslip under different phosphorylation conditions (mean ± s.d., n = 20 with two technical replicates). Linear fits (solid lines) reveal csat (± s.e.). (E) Images of condensates formed by untreated and dephosphorylated ΔR2 in 50 ng/μL polyC RNA. (F) The total volume of ΔR2-RNA condensates settled per micron squared area on the coverslip as a function of ΔR2 concentration (mean ± s.d., n = 20 with two technical replicates). The linear fit (solid line) reveals csat (± s.e.).
Figure 5.
Figure 5.. Identification of small molecules that alter phase separation of N in vitro and in vivo.
(A) Condensates formed in the presence of 7.8 μM N and either 50 ng/μL polyC or 18 nM Sec1 RNA were not affected by 10 mM lipoic acid, but dissolved in the presence of 10% 1,6 hexanediol. (B) (Left) Examples of Class I, II, and III drugs. The N protein and polyC RNA concentrations were set to 7.8 μM and 50 ng/μL, respectively. (Right) The percent change on the number (blue) and total volume (black) of N-polyC condensates settled per micron squared area on the coverslip under different drug concentrations (mean ± s.d., n = 8 with two technical replicates). Solid curves represent a fit to a dose-response equation (see Methods). (C) Percent CPE inhibition (black, mean ± s.d., two technical replicates) and cell viability (blue, mean) of SARS-CoV-2 infected Vero-E6 cells treated with serial dilutions of drugs. Solid curves represent a fit to a dose-response equation (see Methods) to determine a half-maximal response constant EC50 (Table S4).
Figure 6.
Figure 6.. Dynamics of N condensates in vivo.
(A) Example images of cells expressing N-GFP, ΔR2-GFP, and GFP stained with DRAQ5. (B) Representative FRAP imaging of cells exhibiting N-GFP or ΔR2-GFP puncta or high GFP expression. Circles show the photobleached area. (C) Fluorescence recovery signals of the protein in the bleached versus the control regions. The solid curve represents a single exponential fit to reveal the recovery lifetime (τ, ±95% confidence interval). (D) The distribution of fluorescence recovery lifetimes of cells expressing WT-GFP (n = 28) or ΔR2-GFP (n = 15) exhibiting puncta and cells with high expression of GFP only (n = 15). The center and edges of the box represent the median with the first and third quartiles. The p values were calculated from a two-tailed t-test. (E) The maximum fractional recovery after photobleaching of cells expressing WT-GFP (n = 28), ΔR2-GFP (n = 15) or GFP-only (n = 15). The center and edges of the box represent the median with the first and third quartiles. The p values were calculated from a two-tailed t-test. (F) Model for remodeling of viral RNA genome by the SARS-CoV-2 N protein. The N protein packages viral genomic RNA through phase separation, which may facilitate efficient replication of the genomic RNA and formation of the enveloped virus.

References

    1. Gordon D. E. et al. , A SARS-CoV-2-Human Protein-Protein Interaction Map Reveals Drug Targets and Potential Drug-Repurposing. (2020). - PMC - PubMed
    1. Shang J. et al. , Structural basis of receptor recognition by SARS-CoV-2. Nature 581, 221–224 (2020). - PMC - PubMed
    1. Chan K. K. et al. , Engineering human ACE2 to optimize binding to the spike protein of SARS coronavirus 2. Science, eabc0870 (2020). - PMC - PubMed
    1. Hoffmann M. et al. , SARS-CoV-2 Cell Entry Depends on ACE2 and TMPRSS2 and Is Blocked by a Clinically Proven Protease Inhibitor. Cell 181, 271–280.e278 (2020). - PMC - PubMed
    1. Mulligan M. J. et al. , Phase I/II study of COVID-19 RNA vaccine BNT162b1 in adults. Nature 586, 589–593 (2020). - PubMed

Publication types