[Preprint]. 2020 Sep 24:2020.09.24.312298.
doi: 10.1101/2020.09.24.312298.

Functional genomic screens identify human host factors for SARS-CoV-2 and common cold coronaviruses

Affiliations

Functional genomic screens identify human host factors for SARS-CoV-2 and common cold coronaviruses

Ruofan Wang et al. bioRxiv. .

Update in

  • Genetic Screens Identify Host Factors for SARS-CoV-2 and Common Cold Coronaviruses.
    Wang R, Simoneau CR, Kulsuptrakul J, Bouhaddou M, Travisano KA, Hayashi JM, Carlson-Stevermer J, Zengel JR, Richards CM, Fozouni P, Oki J, Rodriguez L, Joehnk B, Walcott K, Holden K, Sil A, Carette JE, Krogan NJ, Ott M, Puschnik AS. Wang R, et al. Cell. 2021 Jan 7;184(1):106-119.e14. doi: 10.1016/j.cell.2020.12.004. Epub 2020 Dec 9. Cell. 2021. PMID: 33333024 Free PMC article.

Abstract

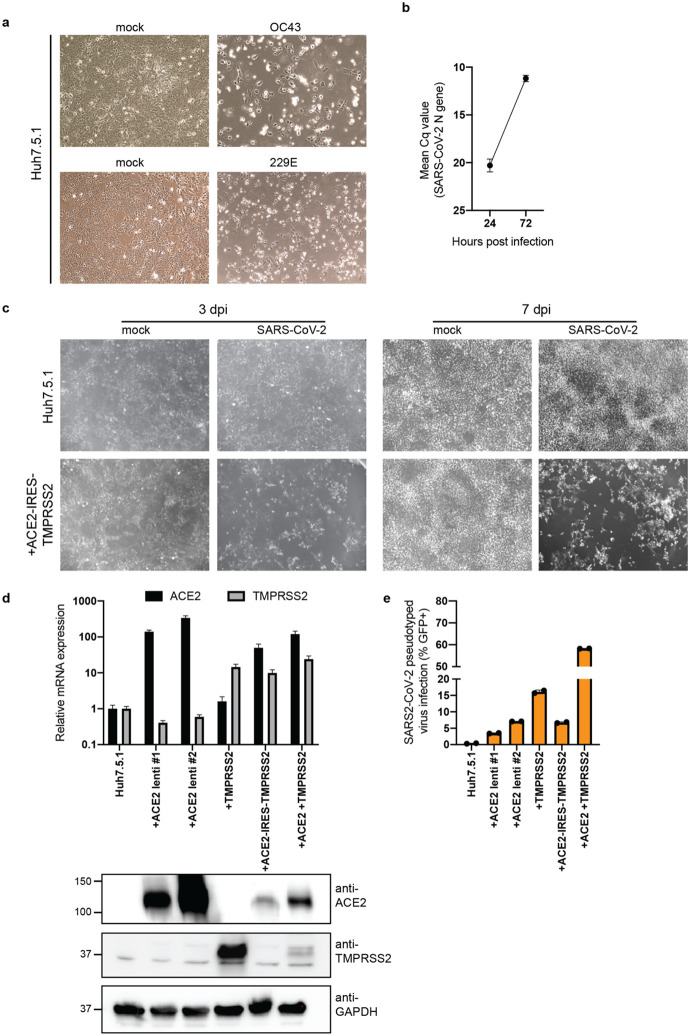
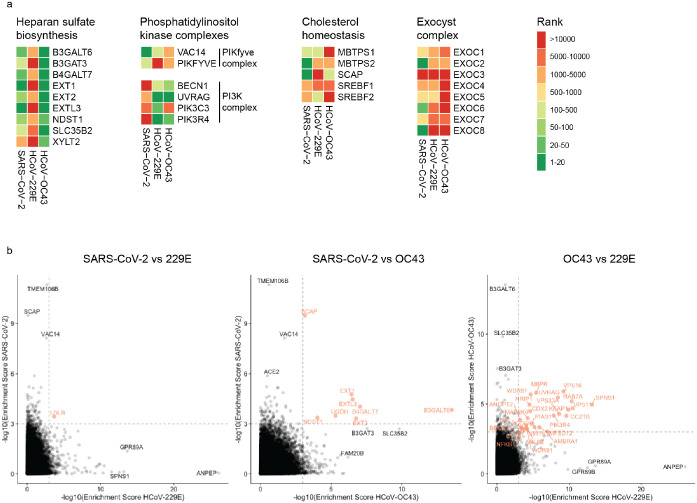
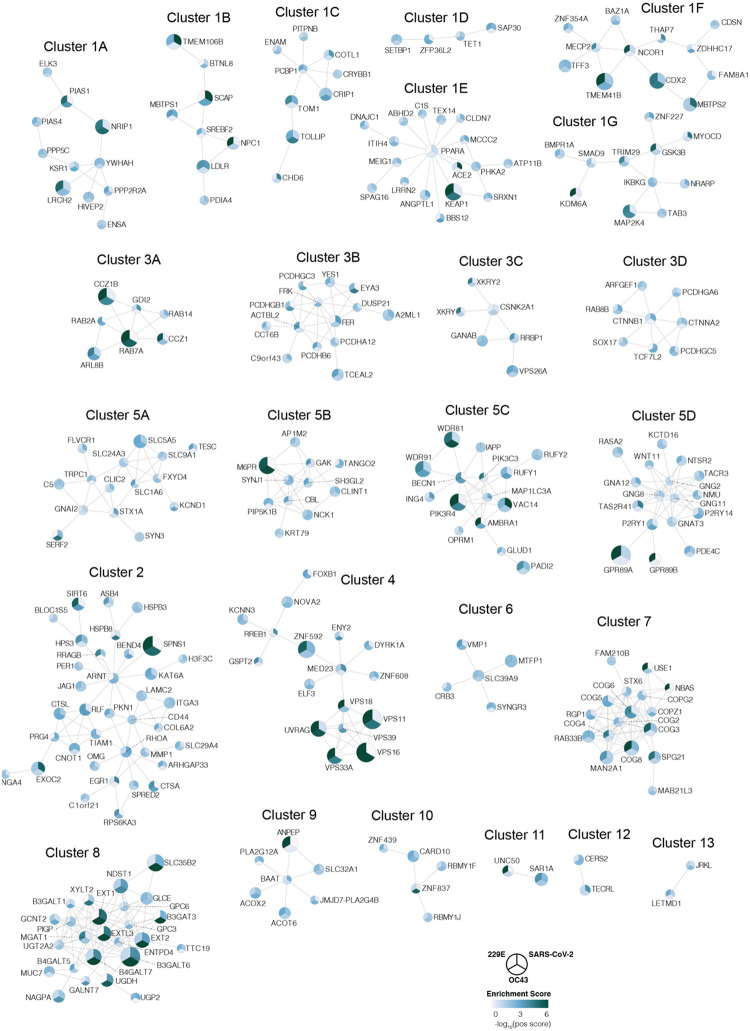
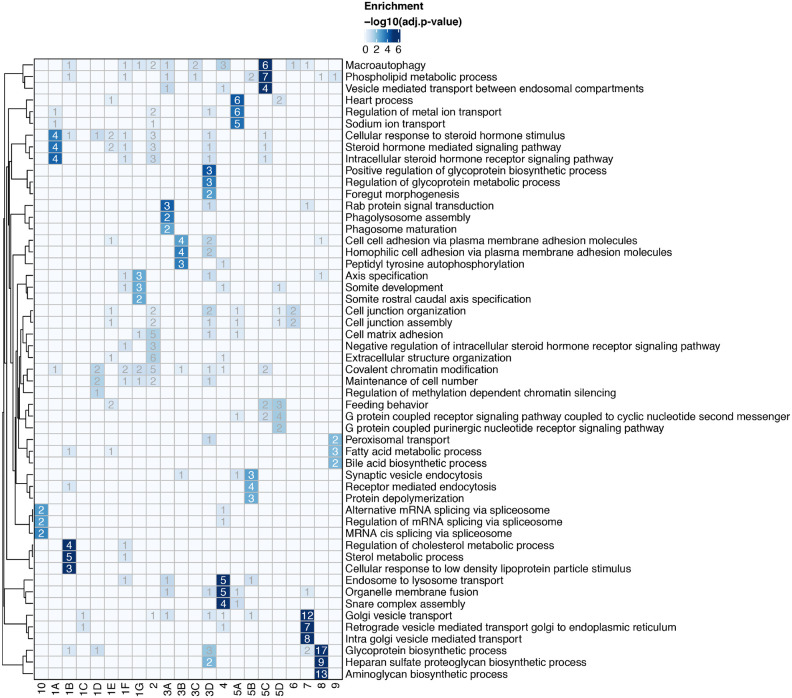
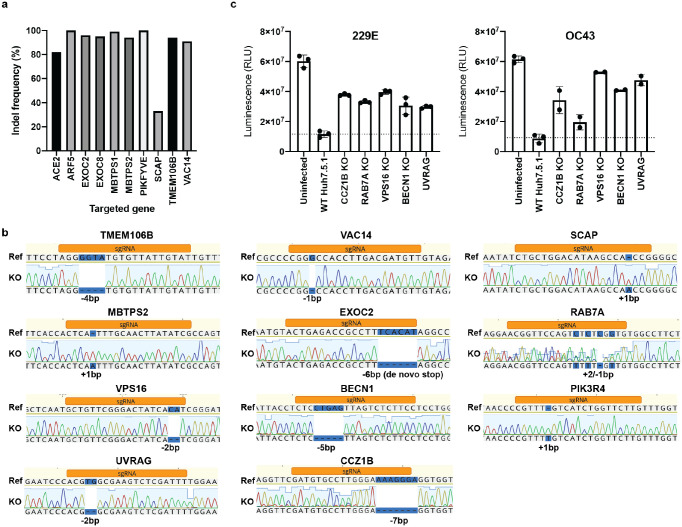
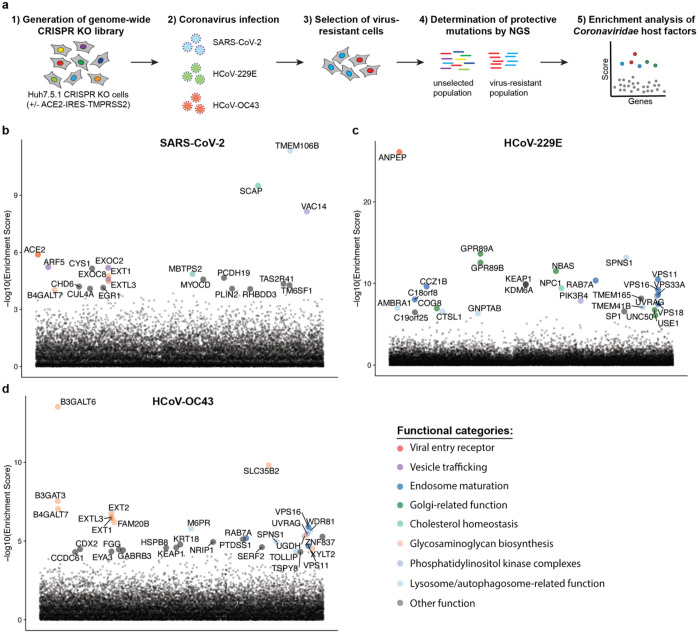
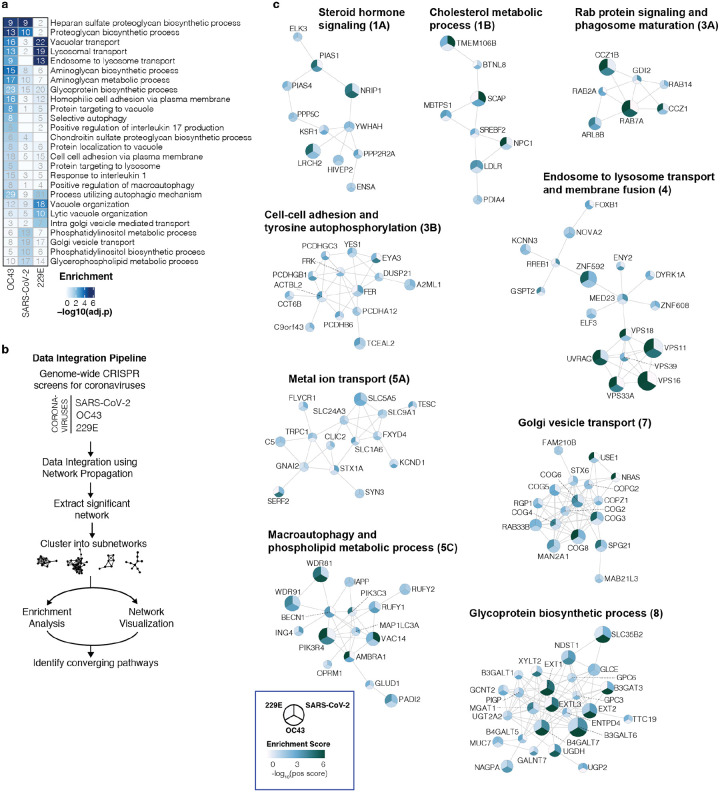
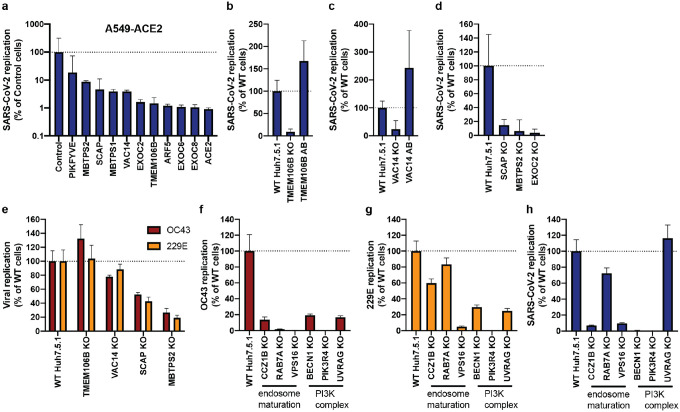
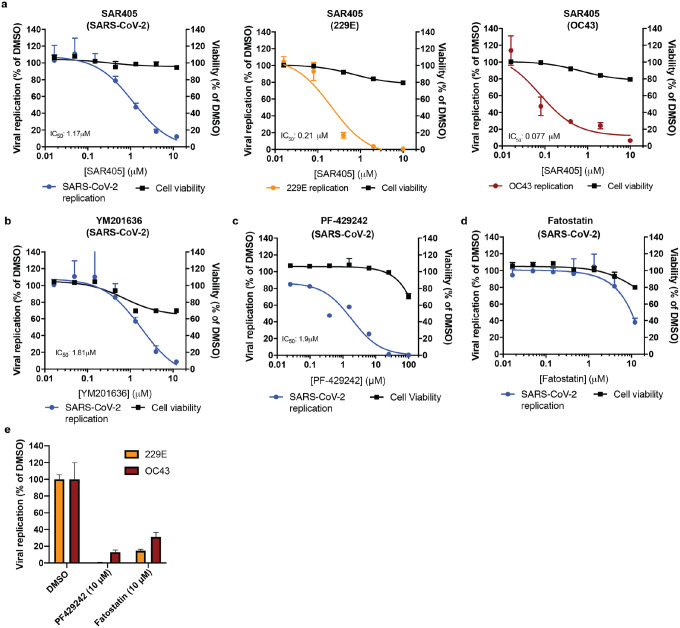
The Coronaviridae are a family of viruses that causes disease in humans ranging from mild respiratory infection to potentially lethal acute respiratory distress syndrome. Finding host factors that are common to multiple coronaviruses could facilitate the development of therapies to combat current and future coronavirus pandemics. Here, we conducted parallel genome-wide CRISPR screens in cells infected by SARS-CoV-2 as well as two seasonally circulating common cold coronaviruses, OC43 and 229E. This approach correctly identified the distinct viral entry factors ACE2 (for SARS-CoV-2), aminopeptidase N (for 229E) and glycosaminoglycans (for OC43). Additionally, we discovered phosphatidylinositol phosphate biosynthesis and cholesterol homeostasis as critical host pathways supporting infection by all three coronaviruses. By contrast, the lysosomal protein TMEM106B appeared unique to SARS-CoV-2 infection. Pharmacological inhibition of phosphatidylinositol phosphate biosynthesis and cholesterol homeostasis reduced replication of all three coronaviruses. These findings offer important insights for the understanding of the coronavirus life cycle as well as the potential development of host-directed therapies.


Conflict of interest statement

Conflict of interest

J.C.S., J.O. and K.H. are employees of Synthego Corporation.

Figures

Extended Data Figure 1:
Extended Data Figure 1:. Huh7.5.1 cells are susceptible to SARS-CoV-2, HCoV-OC43 and HCoV-229E.
(a) Light microscopy images of WT Huh7.5.1 infected with OC43 (7 dpi) and 229E (4 dpi). (b) Quantification of SARS-CoV-2 RNA in WT Huh7.5.1 cells at 24 and 72 hpi by RT-qPCR. Cq values represent mean ± s.e.m. from 3 biological replicates. (c) Light microscopy images of SARS-CoV-2 infected WT Huh7.5.1 cells or Huh7.5.1 cells expressing ACE2-IRES-TMPRSS2 at 3 and 7 dpi. (d) Quantification of ACE2 and TMPRSS2 expression in WT and lentivirally transduced Huh7.5.1 cells by RT-qPCR and Western blot. mRNA levels are displayed as mean ± s.e.m. from two independent harvests and are relative to expression in WT cells. Anti-ACE2 and anti-TMPRSS2 antibodies were used to detect protein levels in WT and overexpression cells. GAPDH was used as loading control. Molecular weight markers are indicated on the left. (e) Quantification of infection with pseudotyped lentivirus bearing SARS-CoV-2 spike and expressing a GFP by flow cytometry. Values are from two biological samples and are displayed as means ± s.d.
Extended Data Figure 2:
Extended Data Figure 2:. Comparison of CRISPR screens reveals common and distinct host factors across SARS-CoV-2, 229E and OC43.
(a) CRISPR screen ranking of genes, which are part of specific cellular pathway or complexes, across the three CRISPR screens. (b) Pairwise comparisons of gene enrichments between two CRISPR screens. Dotted lines indicate −log10(Enrichment score) > 3. Genes that scored above the threshold in both screens, are highlighted in red.
Extended Data Figure 3:
Extended Data Figure 3:. Network propagation of CRISPR screen hits reveals functional clusters with distinct biological functions.
(a) Biological subclusters from network propagation. Cluster number refers to the enrichment analysis of biological processes for each cluster, displayed in Extended Data Fig. 3b. Circle size represents p-value from integrative network propagation permutation test (gene-wise multiplication across datasets, see Methods). The original positive enrichment score of a gene in each CRISPR screen is indicated by color scale within the circle. (b) Gene ontology (GO) enrichment analysis was performed on each subcluster from the network propagation. P values were calculated by hypergeometric test and a false-discovery rate was used to account for multiple hypothesis testing. The entire set of enriched biological processes for each subcluster is listed in Supplementary Table 2.
Extended Data Figure 4:
Extended Data Figure 4:. Knockout of host factor genes reduces coronavirus infection and virus-induced cell death.
(a) Indel frequency of RNP-edited polyclonal A549-ACE2 KO cells. Targeted loci were PCR-amplified, Sanger-sequenced and analyzed using Inference of CRISPR Edits (ICE) analysis. (b) Genotyping of clonal Huh7.5.1. Targeted loci were PCR-amplified, Sanger-sequenced and aligned to WT reference sequence. Frameshifts are highlighted in blue. (c) Cell viability measurement of 229E or OC43 infected WT and KO Huh7.5.1 cells. Cells were infected with 229E (moi=0.05) or OC43 (moi=3) and viability was determined 8 dpi using Cell Titer Glo. Values are displayed as means ± s.d. from three (229E) or two (OC43) biological samples.
Figure 1:
Figure 1:. Genome-wide CRISPR KO screens in human cells identify host factors important for infection by for SARS-CoV-2, HCoV-229E and HCoV-OC43.
(a) Schematic of CRISPR KO screens for the identification of coronavirus host factors. Huh7.5.1-Cas9 (with bicistronic ACE2-IRES-TMPRSS2 construct for SARS-CoV-2 and without for 229E and OC43 screen) were mutagenized using a genome-wide sgRNA library. Mutant cells were infected with each coronavirus separately and virus-resistant cells were harvested 10–14 days post infection (dpi). The abundance of each sgRNA in the starting and selected population was determined by high-throughput sequencing and a gene enrichment analysis was performed. (b–d) Gene enrichment of CRISPR screens for (b) SARS-CoV-2, (c) 229E and (d) OC43 infection. Enrichment scores were determined by MaGECK analysis and genes were colored by biological function. The SARS-CoV-2 was performed once. The 229E and OC43 screens were performed twice and combined MaGECK scores are displayed.
Figure 2:
Figure 2:. Gene ontology analysis and network propagation highlight pathways and biological signaling networks important for coronavirus infection.
(a) Gene ontology (GO) enrichment analysis was performed on significant hits from the individual CRISPR screens (MaGECK enrichment score <= 0.005). P values were calculated by hypergeometric test and a false-discovery rate was used to account for multiple hypothesis testing. The top GO terms of each screen were selected for visualization. (b) Data integration pipeline for network propagation of identified host factor genes. Unthresholded positive enrichment scores served as initial gene labels for network propagation using Pathway Commons. Separately propagated networks were integrated gene-wise (via multiplication) to identify biological networks that are shared between all three datasets. Genes found to be significant in the propagation (see Methods) were extracted, clustered into smaller subnetworks, and annotated using GO enrichment analysis. (c) Selected biological subnetwork clusters from network propagation. Cluster title indicates the most significant biological function(s) for each cluster. Circle size represents p-value from network propagation permutation test (see Methods). The original positive enrichment score of a gene in each CRISPR screen is indicated by color scale within the circle. The entire set of identified clusters is displayed in Extended Data Fig. 3a. (#) is the cluster number, which refers to the enrichment analysis of biological processes in Extended Data Fig. 3b and Supplementary Table 2.
Figure 3:
Figure 3:. Knockout of candidate host factor genes reduces coronavirus infection.
(a) RT-qPCR quantification of intracellular SARS-CoV-2 levels in RNP edited A549-ACE2 cells. Cells were infected using moi=0.01 and harvested at 72 hours post infection (hpi). (b–d) RT-qPCR quantification of intracellular SARS-CoV-2 levels in WT Huh7.5.1 cells or cells harboring frameshift mutations or frameshift mutant cells complemented with respective cDNAs. Cells were infected using moi=0.01 and harvested at 24 hpi. (e–g) RT-qPCR quantification of intracellular OC43 and 229E RNA levels in WT and KO Huh7.5.1 cells. Cells were infected using moi=0.05 (229E) and moi=3 (OC43) and harvested at 48 hpi. (h) RT-qPCR quantification of intracellular SARS-CoV-2 levels in Huh7.5.1 WT or KO cells by RT-qPCR. Cells were infected using moi=0.01 and harvested at 24 hpi. For SARS-CoV-2 infection, viral transcripts were normalized to cellular RNaseP. For OC43 and 229E experiments, viral RNA was normalized to 18S RNA. For all RT-qPCR experiments, results are displayed relative to infection in WT cells and data represent means ± s.e.m. from 3 biological samples.
Figure 4:
Figure 4:. Pharmacological inhibition of phosphatidylinositol kinase complexes and cellular cholesterol homeostasis decreases infection with SARS-CoV-2 and common cold coronaviruses.
(a) SAR405 dose-response curves for SARS-CoV-2, HCoV-229E and HCoV-OC43 replication in Huh7.5.1 cells and for cell viability of drug treated cells. (b–d) Dose-response curves of the effect of (b) YM201636, (c) PF-429242, and (d) fatostatin to on SARS-CoV-2 replication in Huh7.5.1 cells and on cell viability of drug treated cells. (e) Quantification of 229E and OC43 replication in the presence of PF-429242 or fatostatin. For all experiments, compounds were added simultaneously with virus. Viral RNA was quantified after 24 hpi (SARS-CoV-2) or 48hpi (229E and OC43) using RT-qPCR and normalized to RnaseP (SARS-CoV-2) or 18S RNA (229E and OC43). Values represent means ± s.e.m. relative to DMSO treated cells. For cell viability, datasets represent means ± s.d. and values are relative to DMSO treated uninfected controls. Non-linear curves were fitted with least squares regression using GraphPad Prism 8 and IC50 was determined for (a–c). All experiments were performed in 3 biological replicates.

References

    1. van der Hoek L. Human coronaviruses: what do they cause? Antivir. Ther. 12, 651–658 (2007). - PubMed
    1. Drosten C. et al. Identification of a Novel Coronavirus in Patients with Severe Acute Respiratory Syndrome. N. Engl. J. Med. 348, 1967–1976 (2003). - PubMed
    1. Zaki A. M., van Boheemen S., Bestebroer T. M., Osterhaus A. D. M. E. & Fouchier R. A. M. Isolation of a Novel Coronavirus from a Man with Pneumonia in Saudi Arabia. N. Engl. J. Med. 367, 1814–1820 (2012). - PubMed
    1. Wu F. et al. A new coronavirus associated with human respiratory disease in China. Nature 579, 265–269 (2020). - PMC - PubMed
    1. Petersen E. et al. Comparing SARS-CoV-2 with SARS-CoV and influenza pandemics. Lancet Infect. Dis. 0, (2020). - PMC - PubMed

Publication types