

This is a preprint.
EXTENDING THE SUSCEPTIBLE-EXPOSED-INFECTED-REMOVED(SEIR) MODEL TO HANDLE THE HIGH FALSE NEGATIVE RATE AND SYMPTOM-BASED ADMINISTRATION OF COVID-19 DIAGNOSTIC TESTS: SEIR-fansy
- PMID: 32995829
- PMCID: PMC7523173
- DOI: 10.1101/2020.09.24.20200238
EXTENDING THE SUSCEPTIBLE-EXPOSED-INFECTED-REMOVED(SEIR) MODEL TO HANDLE THE HIGH FALSE NEGATIVE RATE AND SYMPTOM-BASED ADMINISTRATION OF COVID-19 DIAGNOSTIC TESTS: SEIR-fansy
Update in
-
Extending the susceptible-exposed-infected-removed (SEIR) model to handle the false negative rate and symptom-based administration of COVID-19 diagnostic tests: SEIR-fansy.Stat Med. 2022 Jun 15;41(13):2317-2337. doi: 10.1002/sim.9357. Epub 2022 Feb 27. Stat Med. 2022. PMID: 35224743 Free PMC article.
Abstract
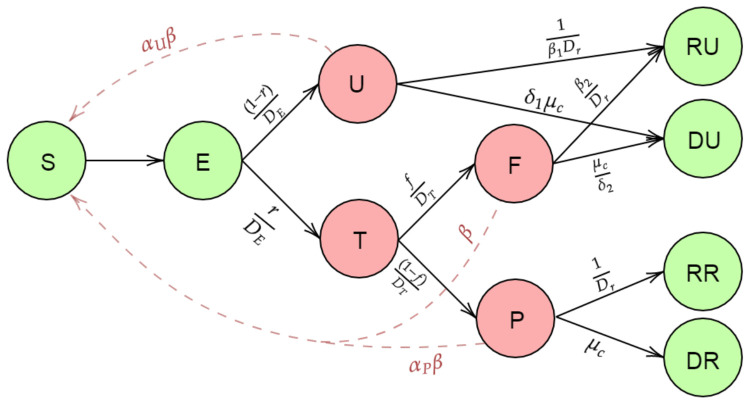
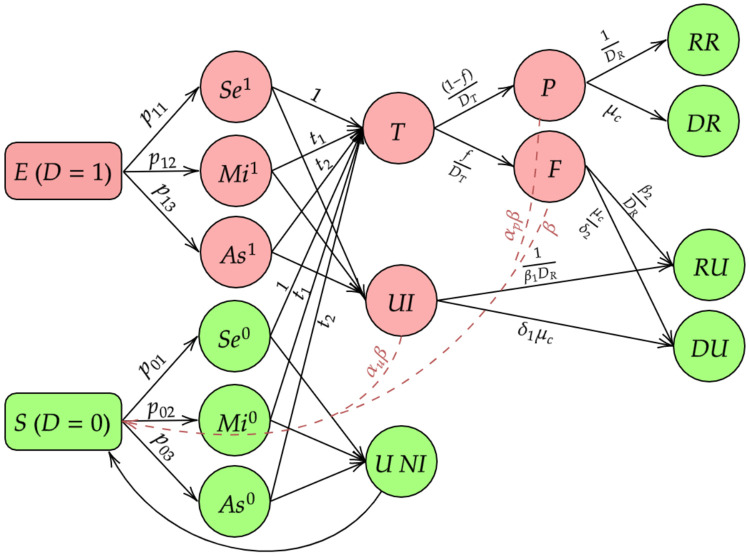
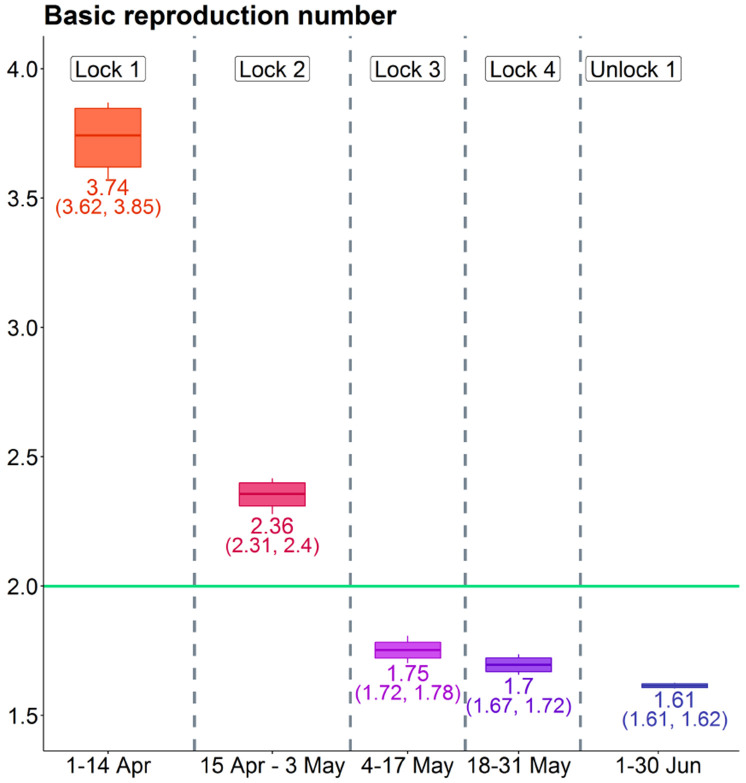
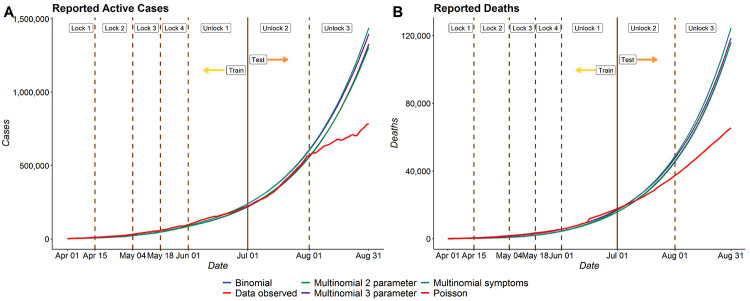
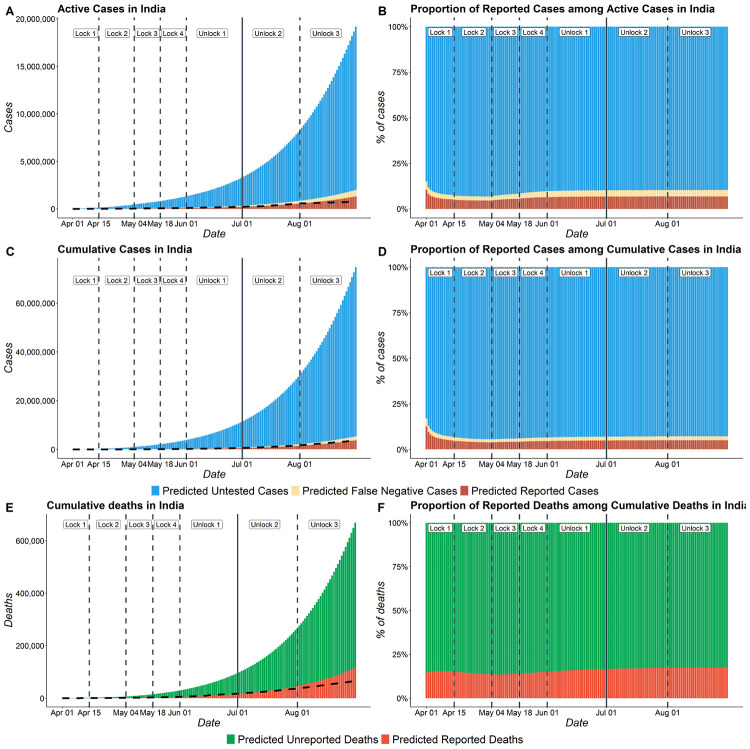
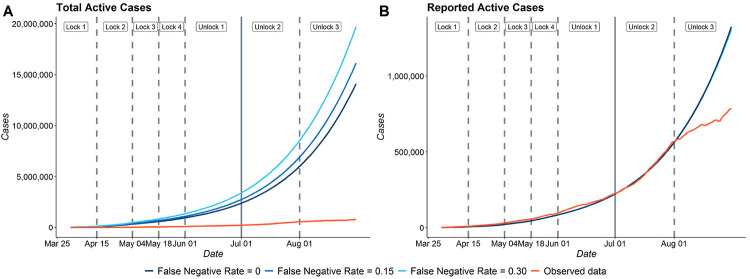
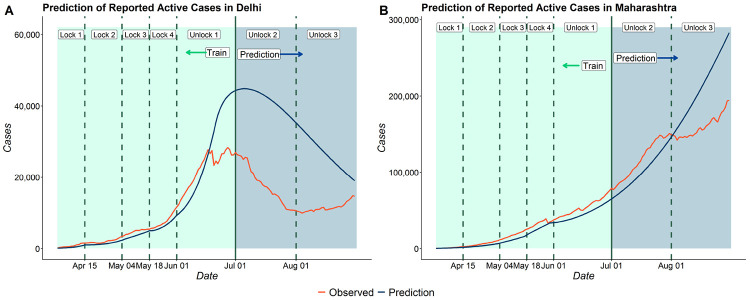
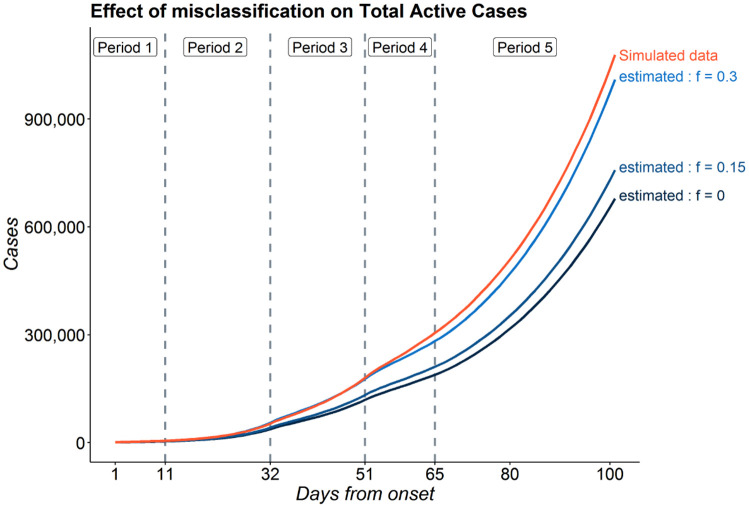
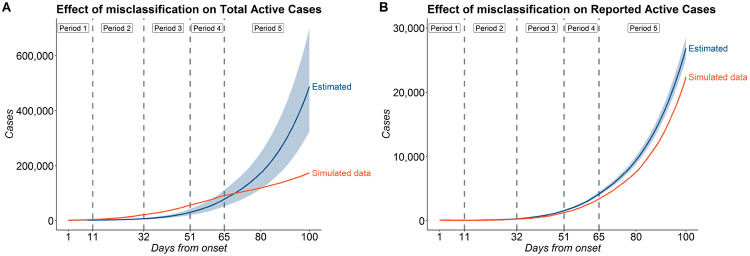
The false negative rate of the diagnostic RT-PCR test for SARS-CoV-2 has been reported to be substantially high. Due to limited availability of testing, only a non-random subset of the population can get tested. Hence, the reported test counts are subject to a large degree of selection bias. We consider an extension of the Susceptible-Exposed-Infected-Removed (SEIR) model under both selection bias and misclassification. We derive closed form expression for the basic reproduction number under such data anomalies using the next generation matrix method. We conduct extensive simulation studies to quantify the effect of misclassification and selection on the resultant estimation and prediction of future case counts. Finally we apply the methods to reported case-death-recovery count data from India, a nation with more than 5 million cases reported over the last seven months. We show that correcting for misclassification and selection can lead to more accurate prediction of case-counts (and death counts) using the observed data as a beta tester. The model also provides an estimate of undetected infections and thus an under-reporting factor. For India, the estimated under-reporting factor for cases is around 21 and for deaths is around 6. We develop an R-package (SEIRfansy) for broader dissemination of the methods.
Conflict of interest statement
Conflict of Interest
Nothing to declare.
Figures
References
-
- Arevalo-Rodriguez Ingrid, Buitrago-Garcia Diana, Simancas-Racines Daniel, Zambrano-Achig Paula, Campo Rosa del, Ciapponi Agustin, Sued Omar, Martinez-Garcia Laura, Rutjes Anne, Low Nicola, et al. False-negative results of initial rt-pcr assays for covid-19: a systematic review. medRxiv, 2020. - PMC - PubMed
-
- Babu N. Percentage of people with antibodies high, shows delhi serological survey. The Hindu, 2020.
-
- Beesley Lauren J and Mukherjee Bhramar. Statistical inference for association studies using electronic health records: handling both selection bias and outcome misclassification. medRxiv, 2019. doi: 10.1101/2019.12.26.19015859 URL https://www.medrxiv.org/content/early/2019/12/30/2019.12.26.19015859. - DOI - PubMed
Publication types
Grants and funding
LinkOut - more resources
Full Text Sources
Research Materials
Miscellaneous