. 2021 Jan 1;31(1):324-340.
doi: 10.1093/cercor/bhaa228.

Bidirectional Interaction of Hippocampal Ripples and Cortical Slow Waves Leads to Coordinated Spiking Activity During NREM Sleep

Affiliations

Bidirectional Interaction of Hippocampal Ripples and Cortical Slow Waves Leads to Coordinated Spiking Activity During NREM Sleep

Pavel Sanda et al. Cereb Cortex. .

Abstract

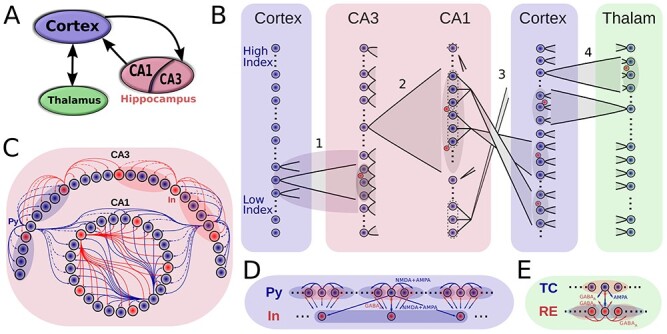
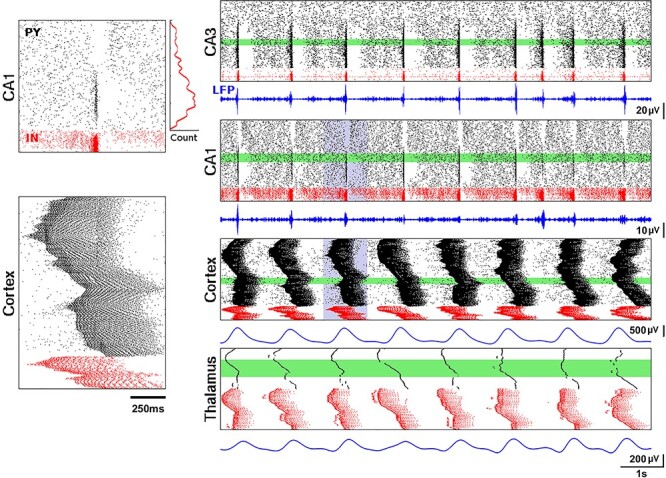
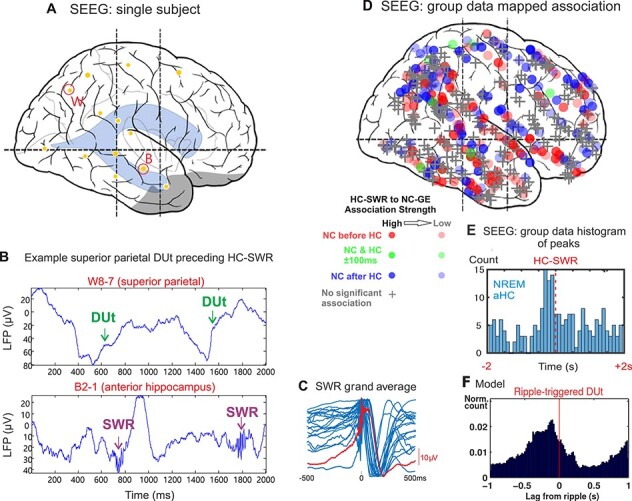
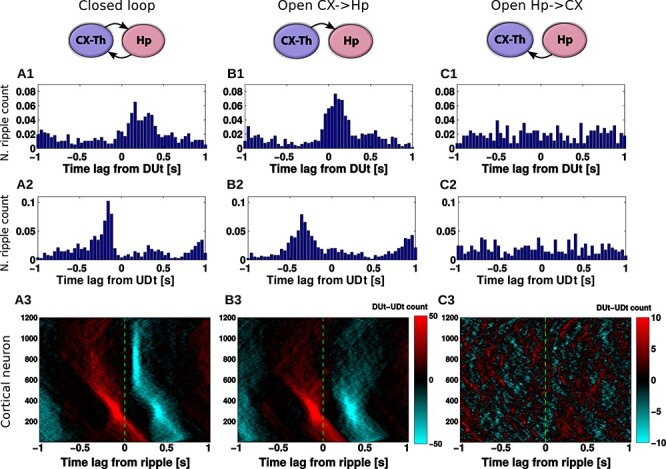
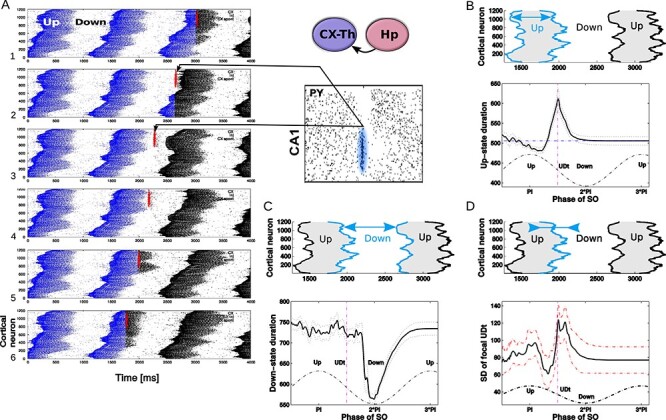
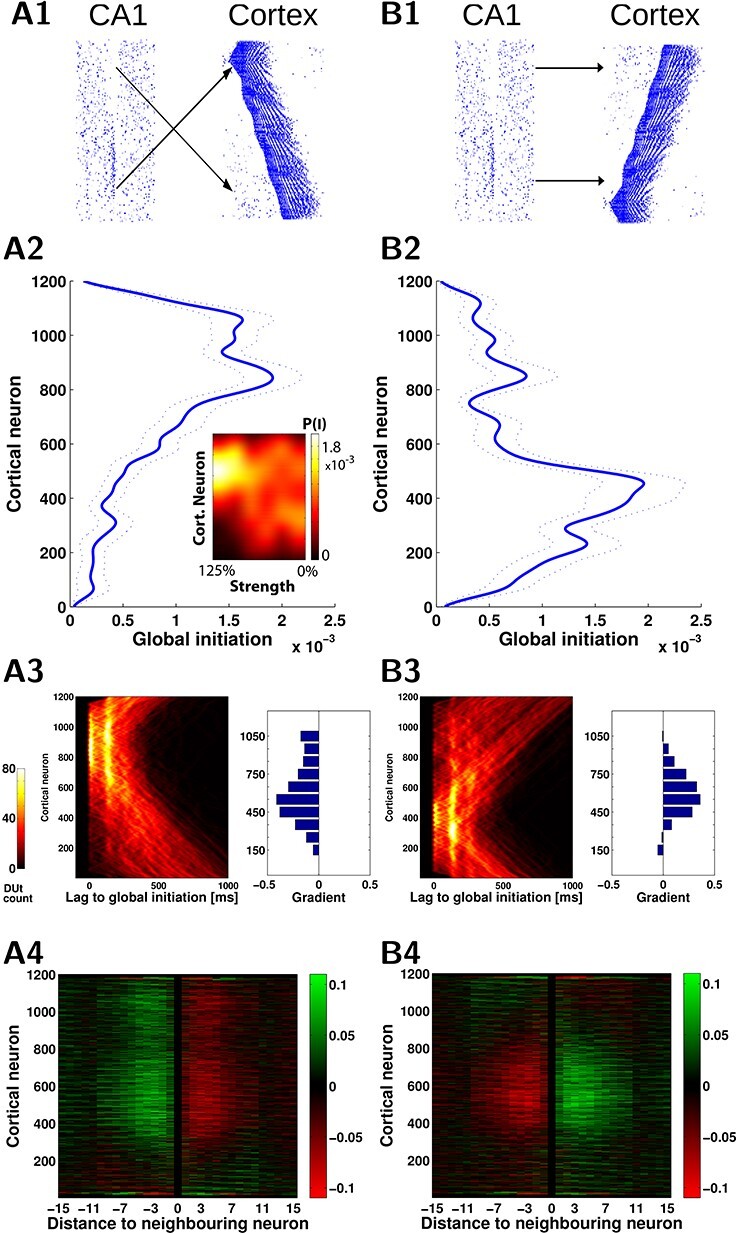
The dialogue between cortex and hippocampus is known to be crucial for sleep-dependent memory consolidation. During slow wave sleep, memory replay depends on slow oscillation (SO) and spindles in the (neo)cortex and sharp wave-ripples (SWRs) in the hippocampus. The mechanisms underlying interaction of these rhythms are poorly understood. We examined the interaction between cortical SO and hippocampal SWRs in a model of the hippocampo-cortico-thalamic network and compared the results with human intracranial recordings during sleep. We observed that ripple occurrence peaked following the onset of an Up-state of SO and that cortical input to hippocampus was crucial to maintain this relationship. A small fraction of ripples occurred during the Down-state and controlled initiation of the next Up-state. We observed that the effect of ripple depends on its precise timing, which supports the idea that ripples occurring at different phases of SO might serve different functions, particularly in the context of encoding the new and reactivation of the old memories during memory consolidation. The study revealed complex bidirectional interaction of SWRs and SO in which early hippocampal ripples influence transitions to Up-state, while cortical Up-states control occurrence of the later ripples, which in turn influence transition to Down-state.

Keywords: NREM sleep; network model; sharp wave-ripple; slow oscillation.


Figures

Figure 1
Figure 1
Model connectivity. A. The model consists of the thalamocortical loop that generates slow oscillation (SO), and the hippocampal circuit (consisting of CA1 and CA3 regions) that generates sharp wave-ripples (SWRs). The two components are connected via cortical input to CA3 and hippocampal output from CA1. B. Details of network connectivity. (1) Cortex->CA3: a small contiguous population of cortical excitatory cells targets a restricted part of CA3, which is highly responsive to incoming excitation. Both CA3 excitatory (blue dots) and inhibitory (red dots) cells were targeted. (2) CA3->CA1 (Schaffer collaterals): CA3 pyramidal cells broadly target CA1 excitatory and inhibitory neurons. (3) CA1->Cortex: Each small patch of CA1 cells projects to a small focal region in Cortex. (4) Cortex<->Thalamus: Cortical pyramidal neurons target both thalamic RE and TC cells, TC cells project back to both Pys and Ins of cortex. Cells in each region are linearly arrayed, with connectivity between regions generally being topographically organized, with the sole exception of the CA1-> Cortex where CA1 cells at the top of the array project to the cortical cells a the bottom, and vice-versa. C-E. Intra-area connectivities. Blue circles/arrows are excitatory cells/connections, and the red are inhibitory ones. The shaded area designates the target region of a projecting neuron. Connectivity of the thalamocortical circuity closely follows (Wei et al. 2018), and hippocampal connectivity is similar to the connectivity used in (Malerba and Bazhenov 2019).
Figure 2
Figure 2
Closed-loop network dynamics. Spiking activity of excitatory pyramidal (black) and local inhibitory (red) neurons, LFP traces (blue). Left panels: representative ripple event in CA1 (top) and Up-state in cortical network (bottom), correspond to the violet region on the right. Histogram next to the ripple event plot shows average spike count of CA1 excitatory cells during ripples. Right panels from top to bottom show 10 seconds of full network activity: spiking rastergrams for CA3, CA1, cortical, and thalamic (RE and TC cells) networks. Average LFPs from 100 neurons (green areas) are shown below rasterplots. LFP for CA1 was filtered from 120 to 200 Hz, for CA3 from 90 to 200 Hz, and for both cortical and thalamic cells from 0.5 to 2 Hz.
Figure 3
Figure 3
Experimental data and model prediction. A. Position of hippocampal (B) and parietal (W) electrodes in the example subject B. Top. Raw LFP trace (transcortical bipolar SEEG derivation) from an example parietal lobe electrode showing alternating Up/Down-states with the Down to Up transition (DUt) marked. Bottom. Raw LFP trace from depth electrode (bipolar SEEG) from the anterior hippocampus, showing sharpwave-ripples following DUt at the top panel. C. The blue waveforms are the template averages for the SWR in the 17 aHC sites. They range in amplitude from 35-300 formula imageV peak-to-peak and are normalized for display. The red waveform is the grand average. D. Locations of the NC electrodes where DUt were detected to correlate with HC SWR. Shape codes if there was a significant temporal relationship (circle: significant, +: not significant); color codes order (red: DUt before SWR; blue: SWR before DUt; green: within 100ms); intensity codes association strength. Significant associations are evident in all cortical areas sampled. E. The number of NC-HC electrode-pairs with peak DUt-SWR association latency in each 100ms bin around the time of the SWR is plotted. F. DUt-triggered ripple histogram for the model. To get a smooth distribution, the transition event in each cell is measured separately. Red vertical line - formula image ms.
Figure 4
Figure 4
Effect of network connectivity on DUt/UDt-ripple coordination. Left column (A): closed CX-HC loop, middle column (B): open loop (HC does not project back to CX), right column (C): open loop (CX does not project back to HC). 1: DUt triggered ripple count. 2: UDt triggered ripple count. 3: Spatiotemporal profile of ripple triggered DUt (red) and UDt (blue) count for all Py neurons in the CX. Colormap: DUt-UDt count (red indicates mainly DUt events, blue—mainly UDt events); y-axis—index of Py cells. Note the different color-scale used for C3. Corresponding cumulative histograms are shown in Supplementary Figure 7. Data were averaged across 20 trials.
Figure 5
Figure 5
Ripple effect within a single SO cycle, open loop scenario. A. A trace of a single representative ripple event was saved from the closed loop simulation and delivered to the isolated thalamocortical network at the different phases of the SO oscillatory cycle. Red dots show spikes of CA1 cells projected to the region of the cortical network. Blue dots are spikes of cortical cells in the network before ripple stimulation; black dots are cortical spikes after the ripple was delivered. The effect of a ripple on the spatiotemporal pattern of DUt/UDt transitions depended on the exact timing of the event. We tested 100 independent trials using identical networks (note, cortical spiking patterns before ripple arrival (blue) are identical in all five panels) with the ripple delivered at different times: formula image ms for i-th trial. Animation for this experiment is shown in Supplementary Figure 8, effect of SWR magnitude is shown in Supplementary Figure 9. B–D. Average effects of a ripple event. Each stimulation condition was repeated 10 times using different initial seed values hereby creating different cortical dynamics (see animation); the results were averaged. Cortical activity was analyzed in the region receiving most of the ripple input (top 601–1200 cortical cells). B. Effect of a ripple on the Up-state duration. Top. Schematic diagram of cortical activity showing two Up-states (shaded) and single Down-state. Duration of the first Up-state (blue envelope lines) was measured for each trial (i.e., different stimulation phase). Bottom. Average effect of a ripple on the Up-state length from 10 simulations for each phase condition. X-axis—timing of a ripple rescaled to SO cycle (reference cycle for each trial was defined by the run where no ripple was delivered). Dashed vertical line shows time of UDt. C. Effect of a ripple on the Down-state duration. Top. Schematic diagram of cortical activity. Duration of the Down-state (blue-line envelope) was measured. Bottom. Average effect of a ripple on the Down-state duration. D. Effect of ripple on the synchrony of the UDt events. Top: Schematic diagram of cortical activity. Timing of the UDt events (blue-line envelope) across population of cortical neurons was measured. Bottom: Average effect of a ripple on the synchronization of UDt events measured as a standard deviation of UDt events timing.
Figure 6
Figure 6
Hippocampal ripples shape spatiotemporal pattern of the slow waves. A1, B1. Two wiring models (A1, mirror) and (B1, direct) reveal different spatiotemporal patterns of the cortical slow waves. A2, B2. Probability of Up-state global initiation for each neuron in the network. In A1 ripples target the “top” region of the cortex (cells [601-1200]) and this causes higher Up-state initiation likelihood in that region (A2, blue). In B1 ripples target the “bottom” region ([1-600]) and this causes higher initiation in that region (B2, blue). Average across 20 simulations, dotted lines show standard error of the mean. A2 inset: Impact of ripples depends on the strength of CA1->CX connections. Color map codes probability of global Up-state initiation for each neuron in A1 wiring scenario. The preference for the upper region initiation dissolved as CA1->CX connectivity strength decreased (100%—baseline, 0%—no CA1 input). A3,B3. The pattern of the Up-state initiation probability is reflected in the shape of the DUt traveling waves. A3/B3, left. Probability of DUt for each neuron as a function of time (lag) with respect to the time moment of a global DUt (zero lag). A3/B3, right. The difference of the gradient (“slope” in radians) of the DUt traveling wave in the mirror and direct map models compared with the cortex-only (no hippocampal input) model, each bar corresponds to restricted region of 100 neurons. Positive values indicate a higher tendency of waves to propagate from the bottom to the top of the network when compared with the cortex-only model, while the negative values show the opposite tendency. A4,B4. Change of “incoming” synapses strength (X-axis—relative index of a presynaptic neuron in respect to the index of a fixed postsynaptic neuron) calculated using offline STDP. The neurons in the middle of the network show an opposite trend for strengthening/weakening of synapses, corresponding to preferred slope gradients as shown A3/B3. The effect starts weakening for the distances over 10 neighboring neurons (X-axis), which was due to the increasing time delay.

References

    1. Averbeck BB, Seo M. 2008. The statistical neuroanatomy of frontal networks in the macaque. PLoS Comput Biol. 4:e1000050. - PMC - PubMed
    1. Barbas H, Blatt GJ. 1995. Topographically specific hippocampal projections target functionally distinct prefrontal areas in the rhesus monkey. Hippocampus. 5:511–533. - PubMed
    1. Battaglia FP, Sutherland GR, McNaughton BL. 2004. Hippocampal sharp wave bursts coincide with neocortical “Up-state” transitions. Learn Memory. 11:697–704. - PMC - PubMed
    1. Batterink LJ, Creery JD, Paller KA. 2016. Phase of spontaneous slow oscillations during sleep influences memory-related processing of auditory cues. J Neurosci. 36:1401–1409. - PMC - PubMed
    1. Bazhenov M, Timofeev I, Steriade M, Sejnowski TJ. 2002. Model of thalamocortical slow-wave sleep oscillations and transitions to activated states. J Neurosci. 22:8691–8704. - PMC - PubMed

Publication types