. 2020 Sep 30:9:e59754.
doi: 10.7554/eLife.59754.

New insights on the modeling of the molecular mechanisms underlying neural maps alignment in the midbrain

Affiliations

New insights on the modeling of the molecular mechanisms underlying neural maps alignment in the midbrain

Elise Laura Savier et al. Elife. .

Abstract

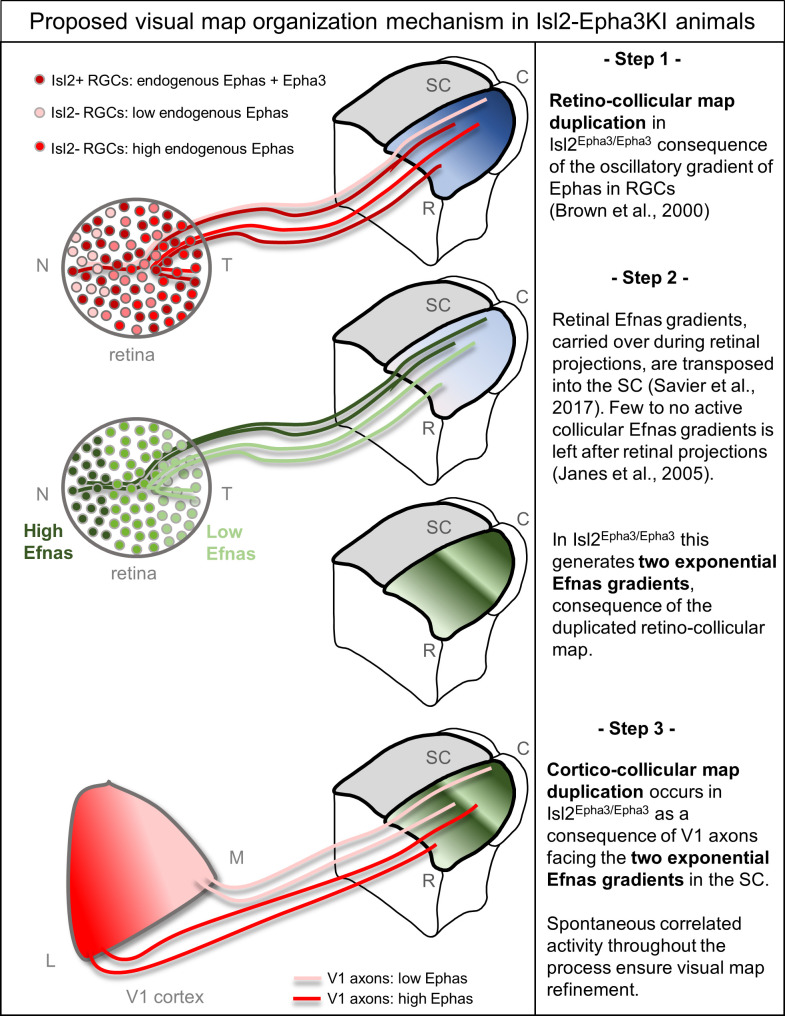
We previously identified and modeled a principle of visual map alignment in the midbrain involving the mapping of the retinal projections and concurrent transposition of retinal guidance cues into the superior colliculus providing positional information for the organization of cortical V1 projections onto the retinal map (Savier et al., 2017). This principle relies on mechanisms involving Epha/Efna signaling, correlated neuronal activity and axon competition. Here, using the 3-step map alignment computational model, we predict and validate in vivo the visual mapping defects in a well-characterized mouse model. Our results challenge previous hypotheses and provide an alternative, although complementary, explanation for the phenotype observed. In addition, we propose a new quantification method to assess the degree of alignment and organization between maps, allowing inter-model comparisons. This work generalizes the validity and robustness of the 3-step map alignment algorithm as a predictive tool and confirms the basic mechanisms of visual map organization.

Keywords: Eph/Efn signalling; computational biology; modelling; mouse; neuroscience; retinal development; superior colliculus; systems biology; visual system.


Conflict of interest statement

ES, JD, KC, MR No competing interests declared

Figures

Figure 1.
Figure 1.. Dot plots representing Ephas/Efnas expression in Isl2Epha3/Epha3retinas, V1 cortex and SC.
(A) Median Efna2/a3/a5 expression levels (relative to wild-type nasal expression) in P1/2 wild-type (WT - white) and Isl2Epha3/Epha3 (gray) acutely isolated RGCs from nasal (N), central (C) and temporal (T) retinas (WT, Isl2Epha3/Epha3, n = 6 animals, 12 retinas), Two-way ANOVA without replication: Efna2 x genotype: F(1,2) = 3.72 < Fcrit.=18.5, p=0.19; Efna3 x genotype : F(1, 2)=11.13 < Fcrit.=18.5, p=0.07; Efna5 x genotype: F(1, 2)=3.58 < Fcrit.=18.5, p=0.20. (B) Median Efna2/a3/a5 ligands and Epha4/a7 receptors expression levels (relative to WT expression levels) in Isl2Epha3/Epha3 V1 (WT n = 5 animals, Isl2Epha3/Epha3n = 8 animals; variables are normally distributed, one sample t-test: Efna2: p=0.29; Efna3: p=0.43; Efna5: p=0.42; Epha4: p=0.07; Epha7: p=0.54) and SC (WT n = 5 animals, Isl2Epha3/Epha3n = 6 animals; variables are normally distributed, one sample t-test: Efna2: p=0.20; Efna3: p=0.65; Efna5: p=0.71; Epha4: p=0.11; Epha7: p=0.17). qPCRs were repeated three times with duplicates for each sample.
Figure 2.
Figure 2.. Simulations of retino- and cortico-collicular mapping in Isl2-Epha3KI animals.
(A, G, M) Representation of measured retinal Epha gradients along the nasal-temporal (NT) axis in WT (A), Isl2Epha3/+ (G) and Isl2Epha3/Epha3 (M) animals (see Materials and methods and Table 1 for equations). (B, H, N) Representation of the estimated collicular Efna gradients along the rostral-caudal (RC) axis in WT (B), Isl2Epha3/+ (H) and Isl2Epha3/Epha3 (N) animals (see Materials and methods and Table 1 for equations). (C, I, O) Representation of the transposed retinal Efna gradients into the SC along the RC axis in WT (C), Isl2Epha3/+ (I) and Isl2Epha3/Epha3 (O) animals (see Materials and methods and Table 1 for equations). (D, J, P) Representation of the estimated cortical Epha gradients along the medial-lateral (ML) axis in V1 in WT (D), Isl2Epha3/+ (J) and Isl2Epha3/Epha3 (P) animals (see Materials and methods and Table 1 for equations). (E, K, Q) Simulated RC map in in WT (E), Isl2Epha3/+ (K) and Isl2Epha3/Epha3 (Q) animals generated by the 3-step map alignment algorithm (representative of n = 20 runs). (F, L, R) Simulated cortico-collicular map in WT (F), Isl2Epha3/+ (L) and Isl2Epha3/Epha3 (R) animals generated by the 3-step map alignment algorithm (representative of n = 20 runs). Abbreviations: N, nasal; T, temporal; R, rostral; C, caudal; M, medial; L, lateral.
Figure 3.
Figure 3.. Experimental validation of retino- and cortico-collicular mapping in Isl2-Epha3KI animals.
(A) Images of two experimental injections showing the collicular terminations zones (triangles and square, top-view, upper panels) after focal retinal injections (arrows, flat-mount, lower panel) in Isl2Epha3/+ animals. (B) Cartesian representation of the injections (triangles and square) in (A) superimposed with the simulated RC map (black dots, n = 100) in Isl2Epha3/+. Map profile is calculated by LOESS smoothing (black and gray lines). (C) Images of two experimental injections showing the collicular termination zones (sagittal view, upper panels) after focal cortical V1 injection (top-view, lower panels). Arrows and arrowheads indicate the site of the termination zones. Lower left panel shows CO staining (dark gray) delineating V1. (D) Cartesian representation of the experimental (red dots/lines, n = 15 animals) and simulated (black dots, n = 100) CC maps calculated by LOESS smoothing (black, red and gray lines). Arrows and arrowhead represent the two injections shown in (C). Two-samples Kolmogorov-Smirnov test, D-stat = 0.273 < D-crit.=0.282, p=0.06, simulated and experimentally measured CC maps are not significantly different. (E) Images of two experimental injections showing the collicular terminations zones (triangles and squares, top-view, upper panels) after focal retinal injection (arrows, flat-mount, lower panel) in Isl2Epha3/Epha3 animals. (F) Cartesian representation of the injections (triangles and squares) in (E) superimposed with the simulated RC map (black dots, n = 100) in Isl2Epha3/Epha3. Map profile is calculated by LOESS smoothing (black and gray lines). (G) Images of two experimental injections showing the collicular duplicated termination zones (arrows and arrowheads, sagittal view, upper panels) after focal cortical V1 injection (top-view, lower panels). (H) Cartesian representation of the experimental (red dots/lines, n = 7 animals) and simulated (black dots, n = 100) CC maps calculated by LOESS smoothing (black, red and gray lines). Arrows and arrowheads represent the two examples in (G). Two-samples Kolmogorov-Smirnov test, D-stat = 0.190 < D-crit.=0.371, p=0.72, simulated and experimentally measured CC maps are not significantly different. Scale bars: 400 μm (A upper, C, E upper, G), 1 mm (A, E lower). Abbreviations: N, nasal; T, temporal; R, rostral; C, caudal; M, medial; L, lateral.
Figure 4.
Figure 4.. Intrinsic dispersion index (IDI) and alignment index (AI) in Isl2-Epha3KI and Isl2-Efna3KI animal models.
(A) Violin plot representation of the median IDIs (from n = 10 simulated maps, each composed of 100 projections) in WT, Isl2-Epha3KI and Isl2-Efna3KI animal models. Mann-Whitney test: WT IDIretino vs. Isl2Epha3/+ IDIretino, z-score = 12.08, effect r = 0.85, p=6E-55; WT IDIcortico vs. Isl2Epha3/+ IDIcortico, z-score = 12.04, effect r = 0.85, p=8E-52; Isl2Epha3/+ IDIretino vs Isl2Epha3/Epha3 IDIretino, z-score = 11.25, effect r = 0.80, p=2E-39; Isl2Epha3/+ IDIcortico vs Isl2Epha3/Epha3 IDIcortico, z-score = 10.53, effect r = 0.74, p=1E-32; WT IDIcortico vs Isl2Efna3/+ IDIcortico, z-score = 8.30, effect r = 0.59, p=1E-18; WT IDIcortico vs Isl2Efna3/Efna3 IDIcortico, z-score = 10.37, effect r = 0.73, p=3E-31; Isl2Efna3/+ IDIcortico vs Isl2Efna3/Efna3 IDIcortico, z-score = 6.93, effect r = 0.49, p=6E-13; ***p<0.001. (B, C, D, E, F) Representation and superimposition of simulated RC (retino-collicular) (white dots) and CC (cortico-collicular) (black dots) maps in WT (B), Isl2Epha3/+ (C), Isl2Epha3/Epha3 (D), Isl2Efna3/+ (E) and Isl2Efna3/Efna3 (F) animals (representative of n = 10 runs). (G) Box plot representation of median AI (from n = 20 simulated RC/CC maps) in WT, Isl2Epha3/+, Isl2Epha3/Epha3, Isl2Efna3/+ and Isl2Efna3/Efna3 animals. Mann-Whitney test: AI WT vs. AI Isl2Epha3/+, z-score = 1.62, effect r = 0.26 p=0.10; AI WT vs. AI Isl2Epha3/Epha3, z-score = 0.11, effect r = 0.02, p=0.90; AI WT vs AI Isl2Efna3/+, z-score = 5.40, effect r = 0.85, p=1.45E-11; AI WT vs AI Isl2Efna3/Efna3, z-score = 5.40, effect r = 0.85, p=1.45E-11. ***p<0.001. Abbreviations: IDI, intrinsic dispersion index; AI, alignment index; WT, wild-type; N, nasal; T, temporal; R, rostral; C, caudal; M, medial; L, lateral.
Figure 5.
Figure 5.. Local intrinsic dispersion variation (local IDV) in WT, Isl2-Epha3KI and Isl2-Efna3KI animal models.
(A, B, C, D, E) Representation of the local IDV values for both retinal (light colors) and cortical (dark colors) projections along the rostral R (0%) – caudal C (100%) axis of the SC in WT (A), Isl2Epha3/+ Isl2Epha3/+ (B), Isl2Epha3/Epha3 (C), Isl2Efna3/+ (D) and Isl2Efna3/Efna3 (E) animals (representative of n = 10 runs). Dashed line represents the threshold above which maps are duplicated. Abbreviations: IDV, intrinsic dispersion variation; WT, wild-type; R, rostral; C, caudal.
Figure 6.
Figure 6.. Proposed mechanism of visual map duplication and alignment in Isl2-Epha3KI animals based on the 3-step map alignment model.
Step 1: Isl2(+) RGCs expressing WT levels Ephas + ectopic Epha3 (dark red) and Isl2(-) RGCs expressing WT levels of Ephas (light red to red) send their axons into the SC during the first postnatal week. These retino-collicular (RC) projections form a duplicated map due to the oscillatory gradient of Ephas receptors in the RGCs reading the WT collicular Efna gradients (blue R-C gradient in SC) through forward signaling. Step 2: Retinal Efna gradients (high Efnas-nasal-dark green, low Efnas-temporal-light green) are carried to the SC during the formation of the RC projections. This transposition of retinal Efnas generates two exponential gradients of Efna in the SC, due to the duplication of the RC map and replaces the WT collicular Efna gradients previously used by the RGCs axons (Janes et al., 2005). Step 3: V1 axons, expressing smooth gradients of Ephas receptors (light red – red), are facing two exponential gradients of Efnas, of retinal origin, in SC. Through forward signaling, this two exponential Efna gradients generate a duplication of the CC projections, which aligns with the RC map. Abbreviations: N, nasal; T, temporal; M, medial; L, lateral; R, rostral; C, caudal; SC, superior colliculus; RGCs, retinal ganglion cells.

Similar articles

Cited by

References

    1. Ackman JB, Crair MC. Role of emergent neural activity in visual map development. Current Opinion in Neurobiology. 2014;24:166–175. doi: 10.1016/j.conb.2013.11.011. - DOI - PMC - PubMed
    1. Basso MA, May PJ. Circuits for action and cognition: a view from the superior colliculus. Annual Review of Vision Science. 2017;3:197–226. doi: 10.1146/annurev-vision-102016-061234. - DOI - PMC - PubMed
    1. Bevins N, Lemke G, Reber M. Genetic dissection of EphA receptor signaling dynamics during retinotopic mapping. Journal of Neuroscience. 2011;31:10302–10310. doi: 10.1523/JNEUROSCI.1652-11.2011. - DOI - PMC - PubMed
    1. Brown A, Yates PA, Burrola P, Ortuño D, Vaidya A, Jessell TM, Pfaff SL, O'Leary DD, Lemke G. Topographic mapping from the retina to the midbrain is controlled by relative but not absolute levels of EphA receptor signaling. Cell. 2000;102:77–88. doi: 10.1016/S0092-8674(00)00012-X. - DOI - PubMed
    1. Cang J, Kaneko M, Yamada J, Woods G, Stryker MP, Feldheim DA. Ephrin-as guide the formation of functional maps in the visual cortex. Neuron. 2005;48:577–589. doi: 10.1016/j.neuron.2005.10.026. - DOI - PMC - PubMed

Publication types

Substances