. 2021 Jan 4;104(1):83-93.
doi: 10.1093/biolre/ioaa179.

Dux facilitates post-implantation development, but is not essential for zygotic genome activation†

Affiliations

Dux facilitates post-implantation development, but is not essential for zygotic genome activation†

Darko Bosnakovski et al. Biol Reprod. .

Abstract

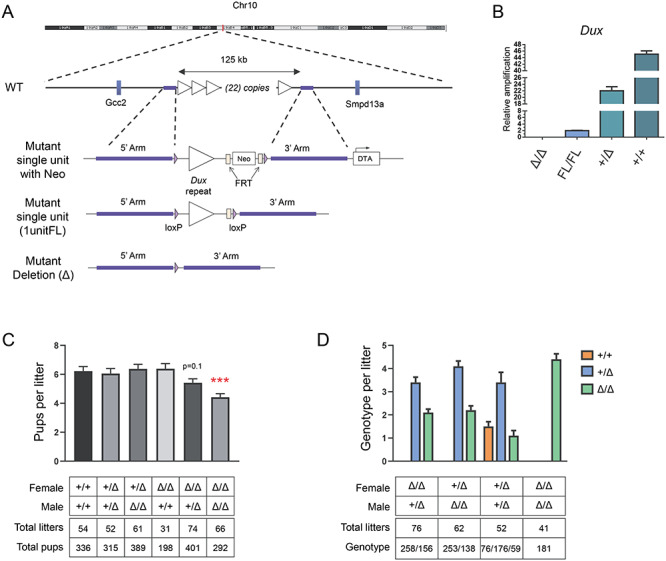
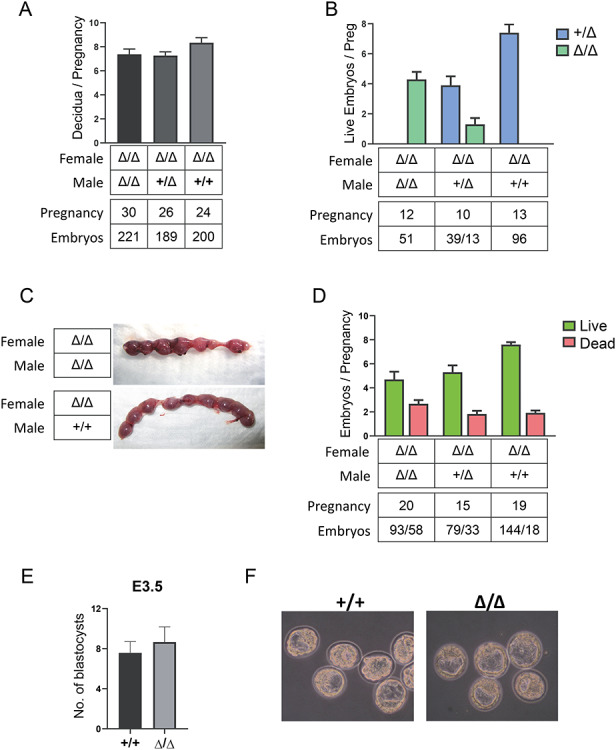
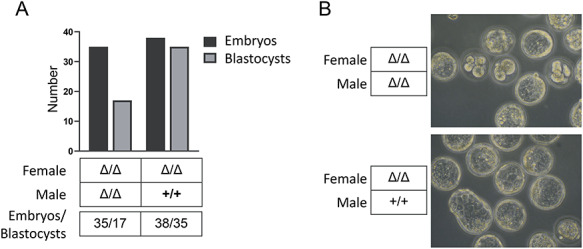
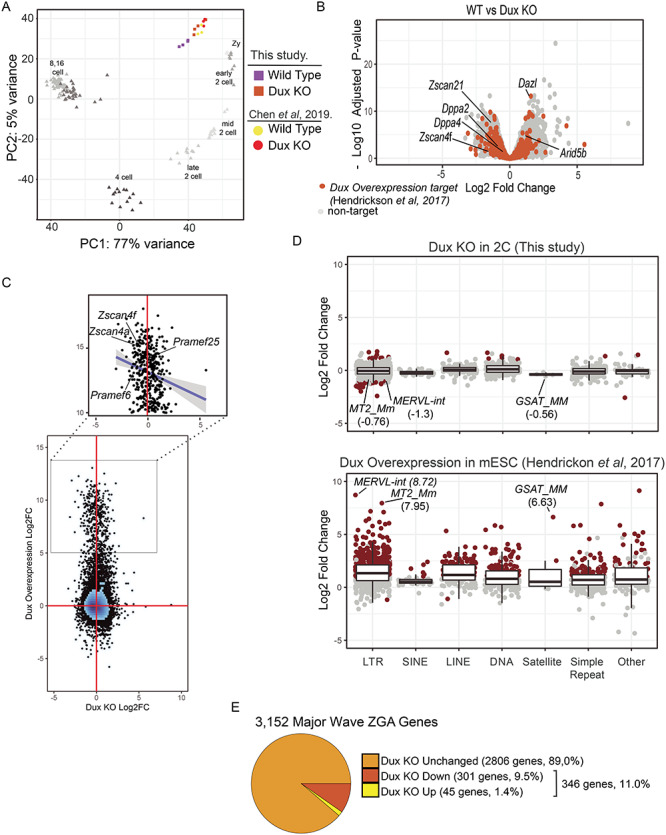
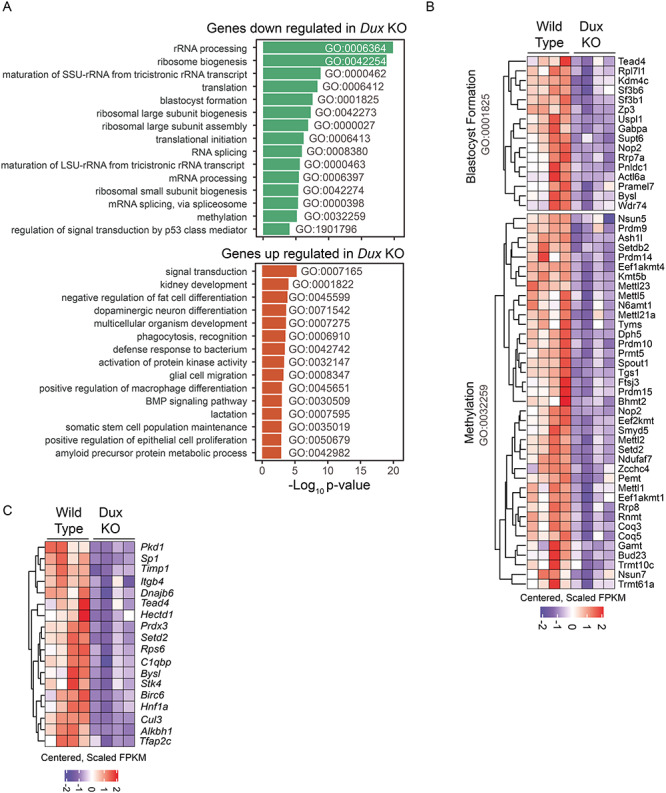
Double homeobox genes are unique to eutherian mammals. It has been proposed that the DUXC clade of the double homeobox gene family, which is present in multicopy long tandem arrays, plays an essential role in zygotic genome activation (ZGA). We generated a deletion of the tandem array encoding the DUXC gene of mouse, Double homeobox (Dux), and found it surprisingly to be homozygous viable and fertile. We characterize the embryonic development and ZGA profile of knockout (KO) embryos, finding that zygotic genome activation still occurs, with only modest alterations in 2-cell embryo gene expression, no defect in in vivo preimplantation development, but an increased likelihood of post-implantation developmental failure, leading to correspondingly smaller litter sizes in the KO strain. While all known 2-cell specific Dux target genes are still expressed in the KO, a subset is expressed at lower levels. These include numerous genes involved in methylation, blastocyst development, and trophectoderm/placental development. We propose that rather than driving ZGA, which is a process common throughout the animal kingdom, DUXC genes facilitate a process unique to eutherian mammals, namely the post-implantation development enabled by an invasive placenta.

Keywords: DUXC; Dux; double homeobox; post-implantation development; zygotic genome activation.


Figures

Figure 1
Figure 1
Dux KO generation, inheritance and effect on litter size. A. C57BL/6 ES cells were modified with a recombination vector that deleted the entire Dux array, and replaced it with a floxed single copy of the repeat. After removal of the selectable marker, mutant mice carrying the single floxed unit on one allele were generated by blastocyst injection. This single copy was then deleted with a germ-line cre to generate the deletion allele. B. qPCR for Dux on genomic DNA of mice of different genotypes, normalized to Dux copy number in the 1unitFL allele. The B6 WT allele is estimated to carry 22 copies of the Dux gene. C. Litter sizes of crosses between different genotypes. Data represents mean ± SEM; ***P < 0.001. D. Genotypes of progeny from different types of crosses. The Δ/Δ genotype is underrepresented in both classes of heterozygous backcrosses.
Figure 2
Figure 2
Dux KO effects on embyogenesis. A. Number of implantations per pregnancy (all decidual masses were counted, normal or resorbing). Data is combined from stages between E5.5 and E18.5. B. Genotypes of the live embryos combined from E8.5 to E12.5. C. Representative images of dissected uterus from Δ/Δ females (E13.5) crossed with either Δ/Δ or WT males. Note the evident embryos resorptions in the upper image. D. Number of live and dead embryos per pregnancy from E8.5 to E18.5 in crosses of different genotypes. E. Number of embryos per pregnancy isolated from Dux KOs (Δ/Δ females crossed with Δ/Δ males) and C57BL/6 (+/+) controls at 3.5 d.p.c. (n = 6 KO litters and 6 heterozygote litters). F. Representative example showing morphology of the embryos analyzed in (E) isolated at 3.5 d.p.c.
Figure 3
Figure 3
In vitro culture of Dux KO embryos. A. Number of embryos that developed into blastocysts from each genotype. B. Images of embryos harvested at the 2-cell stage, cultured for 5 days in vitro.
Figure 4
Figure 4
Gene expression changes at the 2-cell stage in Dux KO embryos. A. Principal component analysis of WT (purple) and Dux KO (orange) gene expression profiles at the 2-cell stage. Prior data from the 2-cell stage is shown for WT (yellow) and Dux KO (red) [18]. The principal components were calculated by including developmental time course from zygotes to the 16 cell stage using data from [22]. Principal component 1 captures 77% of the variance across samples reflecting the developmental stage. B. Gene expression changes between WT and Dux KO embryos. The x-axis corresponds to the log2Fold change and the y-axis corresponds to the negative log10 of the Benjamini–Hockberg corrected P-value. Orange points represent genes upregulated >2-fold in Dux overexpression experiments in ESCs [2]. C. Comparison of gene expression between Dux KO in 2-cell stage embryos to Dux overexpression in ESCs. Figure 4. (continued) The x- and y-axis correspond to the log2 fold change in expression for overexpression and KO experiments, respectively. The zoomed region corresponds to genes that are upregulated by more than 32-fold in the overexpression experiment. The trend line represents a linear fit to this subset. D. Expression changes were estimated for Dux KO (upper panel) and Dux overexpression experiments in ESCs (lower panel) [2] and grouped together by repeat class. Points correspond to repeat families and are colored red to indicate statistically significant expression changes (log2 fold change > 1 or < −1, Benjamini–Hochberg adjusted P-value < 0.05 and mean counts > 25). E. Proportions of major wave ZGA genes that are upregulated at the 2-cell stage in the Dux KO. Major wave ZGA genes were defined as genes expressed more highly at mid-2 cell stage relative to zygotic embryos in the data from [22].
Figure 5
Figure 5
GO enrichment analysis of genes regulated by Dux at the 2-cell stage. A. Enriched GO terms for genes down regulated (upper panel) or up regulated (lower panel) by greater than 1.5-fold in 2C Dux KO embryos. The x-axis corresponds to the negative log10 of the p-value calculated using a hypergeometric test with a transcript length bias correction. B. Heatmap showing scaled and centered FPKM values for down regulated genes by greater than 1.5 fold in 2C Dux KO embryos with ontology associations for blastocyst formation (GO:0001825) and methylation (GO:0032259). C. Heatmap showing scaled and centered FPKM values for down regulated genes by greater than 1.5 fold in 2C Dux KO embryos with ontology associations matching keywords trophoblast, trophectoderm or placenta.

Similar articles

Cited by

References

    1. Xue Z, Huang K, Cai C, Cai L, Jiang CY, Feng Y, Liu Z, Zeng Q, Cheng L, Sun YE, Liu JY, Horvath S et al. Genetic programs in human and mouse early embryos revealed by single-cell RNA sequencing. Nature 2013; 500:593–597. - PMC - PubMed
    1. Hendrickson PG, Dorais JA, Grow EJ, Whiddon JL, Lim JW, Wike CL, Weaver BD, Pflueger C, Emery BR, Wilcox AL, Nix DA, Peterson CM et al. Conserved roles of mouse DUX and human DUX4 in activating cleavage-stage genes and MERVL/HERVL retrotransposons. Nat Genet 2017; 49:925–934. - PMC - PubMed
    1. Whiddon JL, Langford AT, Wong CJ, Zhong JW, and Tapscott SJ. Conservation and innovation in the DUX4-family gene network. Nat Genet 2017; 49:935–940. - PMC - PubMed
    1. De Iaco A, Planet E, Coluccio A, Verp S, Duc J, and Trono D. DUX-family transcription factors regulate zygotic genome activation in placental mammals. Nat Genet 2017; 49:941–945. - PMC - PubMed
    1. Leidenroth A, Hewitt JE. A family history of DUX4: Phylogenetic analysis of DUXA, B, C and Duxbl reveals the ancestral DUX gene. BMC Evol Biol 2010; 10:364. - PMC - PubMed

Publication types