. 2020 Nov 4;48(19):10820-10831.
doi: 10.1093/nar/gkaa799.

The HMGB chromatin protein Nhp6A can bypass obstacles when traveling on DNA

Affiliations

The HMGB chromatin protein Nhp6A can bypass obstacles when traveling on DNA

Kiyoto Kamagata et al. Nucleic Acids Res. .

Abstract

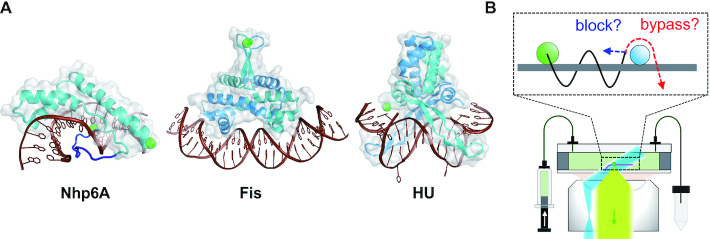
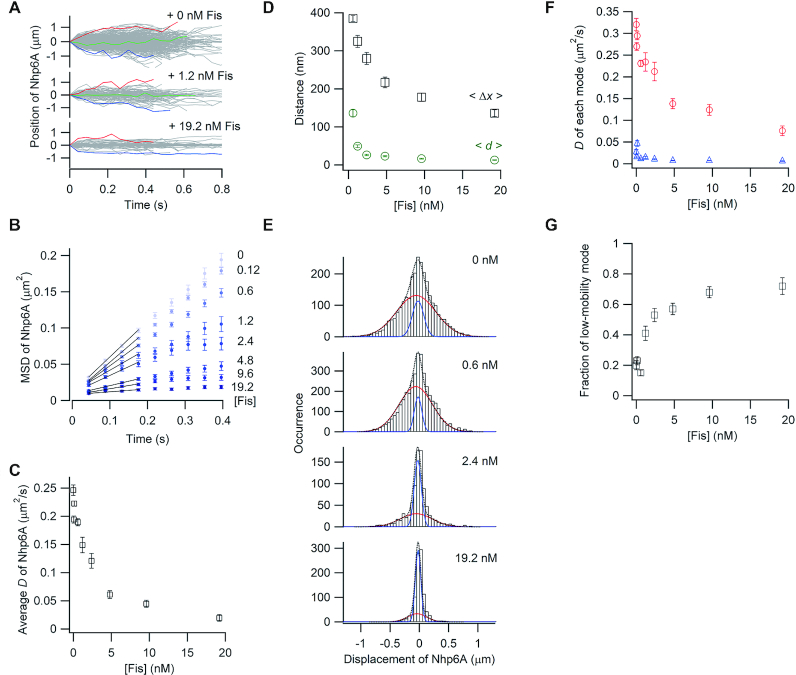
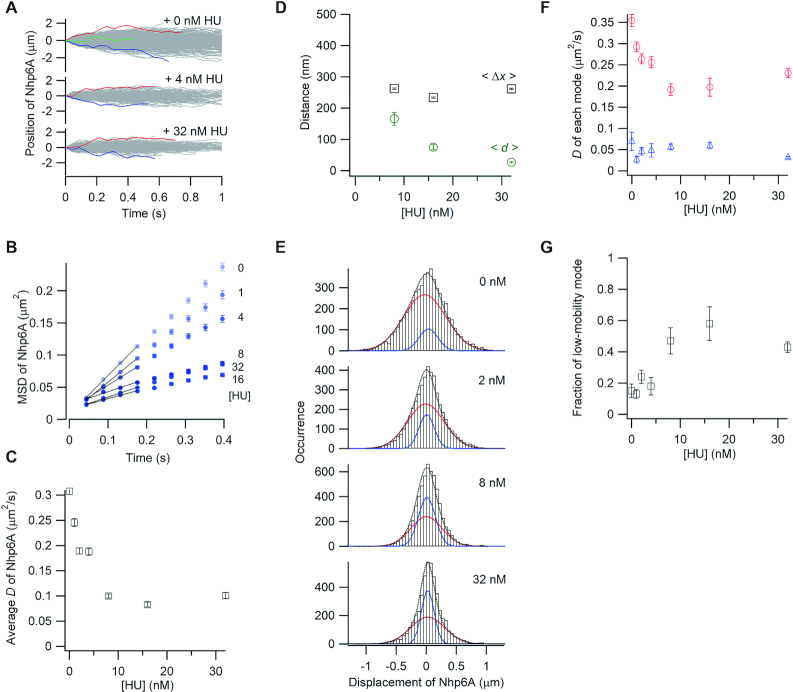
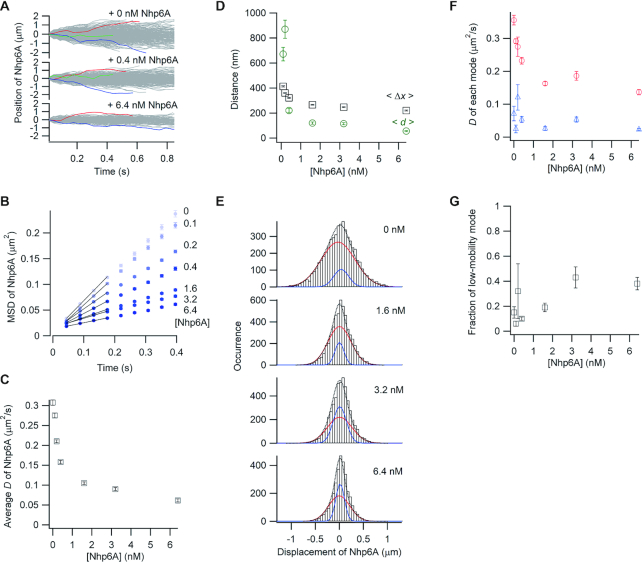
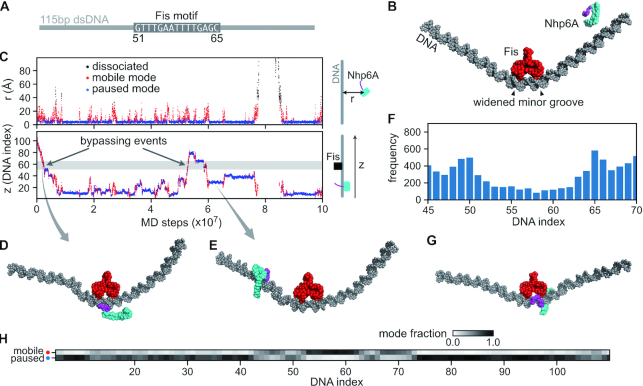
DNA binding proteins rapidly locate their specific DNA targets through a combination of 3D and 1D diffusion mechanisms, with the 1D search involving bidirectional sliding along DNA. However, even in nucleosome-free regions, chromosomes are highly decorated with associated proteins that may block sliding. Here we investigate the ability of the abundant chromatin-associated HMGB protein Nhp6A from Saccharomyces cerevisiae to travel along DNA in the presence of other architectural DNA binding proteins using single-molecule fluorescence microscopy. We observed that 1D diffusion by Nhp6A molecules is retarded by increasing densities of the bacterial proteins Fis and HU and by Nhp6A, indicating these structurally diverse proteins impede Nhp6A mobility on DNA. However, the average travel distances were larger than the average distances between neighboring proteins, implying Nhp6A is able to bypass each of these obstacles. Together with molecular dynamics simulations, our analyses suggest two binding modes: mobile molecules that can bypass barriers as they seek out DNA targets, and near stationary molecules that are associated with neighboring proteins or preferred DNA structures. The ability of mobile Nhp6A molecules to bypass different obstacles on DNA suggests they do not block 1D searches by other DNA binding proteins.


Figures

Figure 1.
Figure 1.
(A) ADBPs used for investigation of the effects of DNA-bound obstacles on 1D diffusion by Nhp6A. Structures of protein–DNA complexes from left to right: Nhp6A (PDB code: 1J5N), Fis (3IV5) and HU (1P71). Proteins are cyan or cyan/blue (dimer subunits) with transparent grey surfaces, and DNAs are brown. The Nhp6A N-terminal flexible arm is blue; patches of tandem basic residues are at residues 8–10 and 13–16. Green spheres are fluorescent labeling sites. (B) Fluorescence microscopy of fluorescent proteins (green dot) in a flow cell with DNA array (pink) using HILO illumination (blue) and fluorescence detection (light green). In inset, the sliding of Nhp6A (green circles) along DNA (grey) may be blocked by other ADBPs (cyan) or may bypass the ADBPs.
Figure 2.
Figure 2.
Single-molecule tracking of fluorescent Nhp6A along DNA bound by non-fluorescent Fis. (A) Single-molecule traces of Nhp6A in the presence of different concentrations of Fis. (B) MSD plots of Nhp6A with 0–19.2 nM Fis. (C) Fis concentration dependence of average diffusion coefficients (D) for Nhp6A. (D) Fis concentration dependence of average travel distances of Nhp6A at 0.4 s intervals (<Δx>, black square) and average spacings between neighboring Fis molecules (<d>, green circles). The error bars of <Δx> were determined from the fitting error of D. The errors of <d> represent standard errors calculated from the fluorescence intensity of at least 20 DNAs bound by fluorescently-labeled Fis. (E) Displacement distributions of Nhp6A at 0.176 s intervals with 0–19.2 nM Fis. Black-dashed curves are the best fitted curves with double Gaussian functions. Red and blue curves are the best fitted curves of the high-mobility and low-mobility modes, respectively. (F) Fis concentration dependence of diffusion coefficients in two modes of Nhp6A. Red and blue represent the diffusion coefficients of the high-mobility and low-mobility modes, respectively. (G) Fis concentration dependence of the fraction of the low-mobility mode of Nhp6A. The error bars in panels C, F and G represent the fitting errors.
Figure 3.
Figure 3.
Single-molecule tracking of fluorescent Nhp6A along DNA bound by non-fluorescent HU. (A) Single-molecule traces of Nhp6A in the presence of different concentrations of HU. (B) MSD plots of Nhp6A with 0–32 nM HU. (C) Fis concentration dependence of average diffusion coefficients (D) for Nhp6A. (D) HU concentration dependence of average travel distances of Nhp6A at 0.4 s intervals (<Δx>, black squares) and average spacings between neighboring HU molecules (<d>, green circles). (E) Displacement distributions of Nhp6A at 0.176 s intervals with 0–32 nM HU. Black-dashed curves are the best fitted curves with double Gaussian functions. Red and blue curves are the best fitted curve of the high-mobility and low-mobility modes, respectively. (F) HU concentration dependence of diffusion coefficients in two modes of Nhp6A. Red circles and blue triangles represent the diffusion coefficients of the high-mobility and low-mobility modes, respectively. (G) HU concentration dependence of the fraction of the low-mobility mode of Nhp6A. The error bars in panels B, C, D, F, and G are described in the caption of Figure 2.
Figure 4.
Figure 4.
Single-molecule tracking of fluorescent Nhp6A along DNA bound by non-fluorescent Nhp6A. (A) Single-molecule traces of Nhp6A in the presence of different concentrations of non-fluorescent Nhp6A. b) MSD plots of Nhp6A with 0–6.4 nM non-fluorescent Nhp6A. (C) Non-fluorescent Nhp6A concentration dependence of average diffusion coefficients (D) for Nhp6A. (D) Non-fluorescent Nhp6A concentration dependence of average travel distances of Nhp6A at 0.4 s intervals (<Δx>, black squares) and average spacings between neighboring non-fluorescent Nhp6A molecules (<d>, green circles). (E) Displacement distributions of Nhp6A at 0.176 s intervals with 0–6.4 nM non-fluorescent Nhp6A. Black-dashed curves are the best fitted curves with double Gaussian functions. Red and blue curves are the best fitted curve of the high-mobility and low-mobility modes, respectively. (F) Non-fluorescent Nhp6A concentration dependence of diffusion coefficients in two modes of Nhp6A. Red and blue represent the diffusion coefficients of the high-mobility and low-mobility modes, respectively. (G) Non-fluorescent Nhp6A concentration dependence of the fraction of the low-mobility mode of Nhp6A. The error bars in panels B, C, D, F and G are described in the caption of Figure 2.
Figure 5.
Figure 5.
Molecular dynamics (MD) simulations of Nhp6A bypassing a stationary Fis dimer. (A) A 115 bp dsDNA was used in the Nhp6A+Fis+DNA coarse-grained MD simulations. The central 15 bp was the Fis consensus motif (from DNA index 51–65), and the other regions had random sequences. (B) Initial structure of the MD simulations. Nhp6A was placed near one end of the DNA. The N-terminal arm of Nhp6A is shown in purple and the folded HMGB domain is in cyan. (C) A representative MD trajectory of Nhp6A sliding on DNA. Top panel: time series of distance from center-of-mass of Nhp6A HMGB domain to DNA (r); Bottom panel: Nhp6A binding position on DNA (z). In both panels the dots are colored by their corresponding binding status: mobile (red) or paused (blue) binding modes or dissociated from DNA (black). The grey region in the bottom panel represents the Fis binding motif (51–65). (D) A representative structure of Nhp6A using its N-terminal arm to contact DNA during Fis bypass. (E) A representative structure of Nhp6A binding to a Fis-free region in the paused mode. f) Nhp6A binding frequency to the region 45–70 on DNA in 50 independent MD simulations. (G) A representative structure of Nhp6A binding to the widened minor groove at DNA index 65. h) Normalized fraction of the two binding modes of Nhp6A along the DNA.

References

    1. Von Hippel P.H., Berg O.G.. Facilitated target location in biological systems. J. Biol. Chem. 1989; 264:675–678. - PubMed
    1. Hammar P., Leroy P., Mahmutovic A., Marklund E.G., Berg O.G., Elf J.. The Lac repressor displays facilitated diffusion in living cells. Science. 2012; 336:1595–1598. - PubMed
    1. Halford S.E., Marko J.F.. How do site-specific DNA-binding proteins find their targets. Nucleic Acids Res. 2004; 32:3040–3052. - PMC - PubMed
    1. Tafvizi A., Mirny L.A., van Oijen A.M.. Dancing on DNA: kinetic aspects of search processes on DNA. ChemPhysChem. 2011; 12:1481–1489. - PMC - PubMed
    1. Kamagata K., Murata A., Itoh Y., Takahashi S.. Characterization of facilitated diffusion of tumor suppressor p53 along DNA using single-molecule fluorescence imaging. J. Photochem. Photobiol. C Photochem. Rev. 2017; 30:36–50.

Publication types