. 2020 Nov 1;124(5):1530-1549.
doi: 10.1152/jn.00474.2019. Epub 2020 Sep 30.

Retinal ganglion cell defects cause decision shifts in visually evoked defense responses

Affiliations

Retinal ganglion cell defects cause decision shifts in visually evoked defense responses

Rebecca Nicole Lees et al. J Neurophysiol. .

Abstract

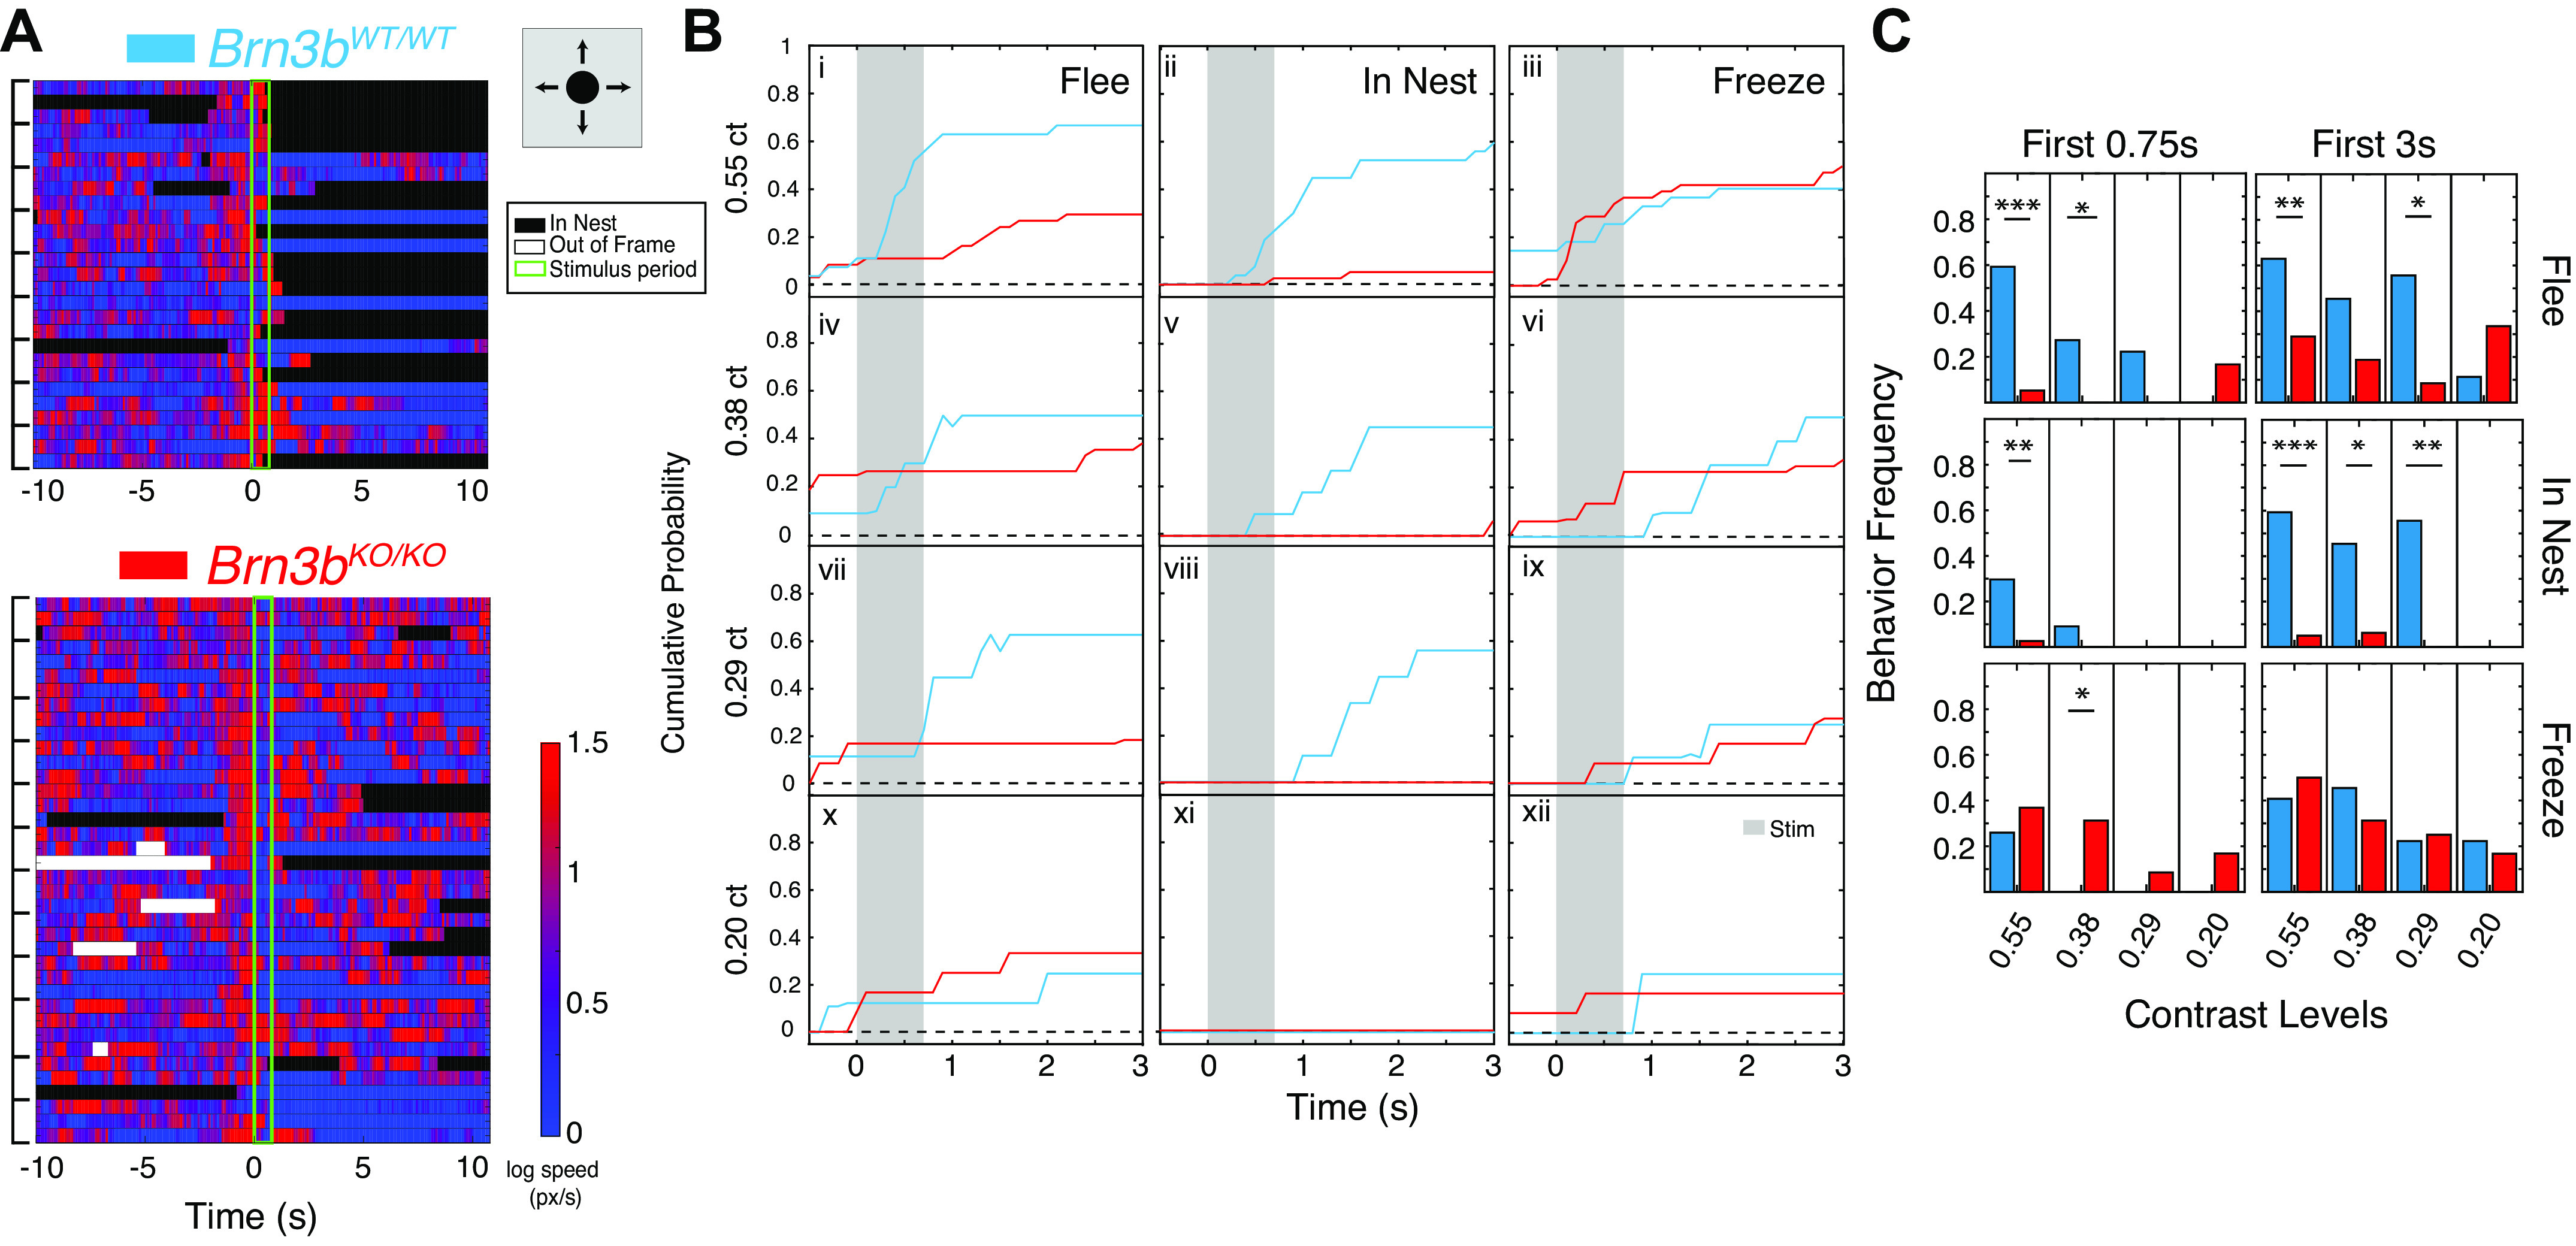
A variety of visual cues can trigger defensive reactions in mice and other species. In mice, looming stimuli that mimic an approaching aerial predator elicit flight or freezing reactions, while sweeping stimuli that mimic an aerial predator flying parallel to the ground typically elicit freezing. The retinal ganglion cell (RGC) types involved in these circuits are largely unknown. We previously discovered that loss of RGC subpopulations in Brn3b knockout mice results in distinct visual response deficits. Here, we report that retinal or global loss of Brn3b selectively ablates the fleeing response to looming stimuli while leaving the freeze response intact. In contrast, freezing responses to sweeping stimuli are significantly affected. Genetic manipulations removing three RGC subpopulations (Brn3a+ betta RGCs, Opn4+Brn3b+, and Brn3c+Brn3b+ RGCs) result in milder phenocopies of Brn3b knockout response deficits. These findings show that flight and freezing responses to distinct visual cues are mediated by circuits that can already be separated at the level of the retina, potentially by enlisting dedicated RGC types.NEW & NOTEWORTHY Flight and freezing response choices evoked by visual stimuli are controlled by brain stem and thalamic circuits. Genetically modified mice with loss of specific retinal ganglion cell (RGC) subpopulations have altered flight versus freezing choices in response to some but not other visual stimuli. This finding suggests that "threatening" visual stimuli may be computed already at the level of the retina and communicated via dedicated pathways (RGCs) to the brain.

Keywords: Brn3b/Pou4f2 transcription factor; defensive behavior; looming stimuli; retinal ganglion cells; sweep stimuli.


Conflict of interest statement

No conflicts of interest, financial or otherwise, are declared by the authors.

Figures

Fig. 1.
Fig. 1.
Characterization of flight and freeze responses to looming stimuli in Brn3bKO/KO mice. A: ethogram of log10 (mouse speed) across trials for Brn3bWT/WT (top) and Brn3bKO/KO (bottom) mice. Basic looming stimulus schematic: black disk in center of screen expanding from 0 cm (0°) diameter to 31.5 cm (49.3°) diameter over 250 ms (197°/s), remaining onscreen for 500 ms after expansion at contrast 0.55. Stimulus expands once per trial. Each horizontal track represents 1 trial. For each mouse, 3–4 trials (encompassed by black brackets on the left) are shown in chronological order from top to bottom (i.e., first trial at the top). Time (x-axis) shows 10 s before and after the stimulus (stimulus, t = 0, duration 0.75 s, light green lines). Heat map to the right represents the mouse speed. Black denotes periods of nest entry and white periods during which mouse position was undetermined. For speed ethograms and behavior ethograms for all stimulus conditions, see Supplemental Fig. S4. High speed in these ethograms does not necessarily signify flight toward nest. Behavior assessments of flight computed below also include a directionality toward the nest component (materials and methods). B: cumulative probability plots of fleeing (i, iv, vii, and x), entries into nest (ii, v, viii, and xi), and freezing (iii, vi, ix, and xii) for Brn3bWT/WT (blue, n = 9 mice) and Brn3bKO/KO (red, n = 12) mice, 3 trials/mouse. Freeze and flee behaviors are normalized to total number of viable trials in time bins of 0.1 s; nest entries are normalized to total number of trials at each time point. iiii: Traces of responses at maximal contrast (0.55). iv-xii: Traces of responses under various contrast conditions (0.375 = ivvi; 0.29 = viiix; 0.2 = xxii) for Brn3bWT/WT (blue, n = 3 mice) and Brn3bKO/KO (red, n = 4 mice), 3–4 trials/mouse/stimulus. Gray vertical columns indicate the stimulus duration. C: behavior frequency during stimulus presentation (First 0.75 s, left), or within 3 s (First 3 s, right) of stimulus presentation, for Brn3bWT/WT (blue) and Brn3bKO/KO (red) mice. Data are normalized to total number of trials for each genotype. Contrast levels are indicated under the plots. χ2 test was used to determine significance. For all graphs: *P < 0.05, **P < 0.01, ***P < 0.001.
Fig. 2.
Fig. 2.
Global and/or retinal-specific loss of Brn3b abolishes flight but not freeze responses to looming stimuli. A: ethogram of log (mouse speed) across looming response trials for Rax:Cre; Brn3bCKOAP/WT (left), and Rax:Cre; Brn3bCKOAP/CKOAP (right) mice. Stimulus definition and ethogram description are shown. For speed ethograms and behavior ethograms for all other genotypes in this figure, see Supplemental Fig. S5. B: Cumulative probability plots of fleeing (left), nest entry (middle), and freezing (right), for Brn3bWT/WT (blue, 3 trials/mouse, n = 9 mice), Brn3bKO/KO (red, 3 trials/mouse, n = 12 mice), and Brn3bKO/WT (green, 4 trials/mouse, n = 10 mice). Data for Brn3bWT/WT and Brn3bKO/KO mice from iiii are included here again for comparison purposes. C: cumulative probability plots of fleeing (left), nest entry (middle), and freezing (right) for Rax:Cre; Brn3bCKOAP/WT (orange, 3–4 trials/mice, n = 14 mice), Rax:Cre; Brn3bCKOAP/CKOAP (black, 4 trials/mice, n = 12 mice), and Rax:Cre; Brn3bCKOAP/KO (purple, 3–4 trials/mice, n = 10 mice). D: behavior frequency during stimulus (First 0.75 s, left), or within 3 s (First 3 s, right) of stimulus presentation, for the 6 Brn3b genotypes, color coded according to A. Data are normalized to total number of trials for each genotype. E and F: box-whisker plots for flee (E) and freeze (F) reaction times for trials where reaction was observed within 3 s of basic loom stimulus onset. Box indicates the interquartile interval, dots the individual datapoints, red line the median, and whisker the full range of observations. Trials with freezing/fleeing episode starting before stimulus onset and lasting into stimulus period excluded. For E and F, KS2 test was used, and for D, χ2 test was used to determine significance. For all graphs: *P < 0.05, **P < 0.01, ***P < 0.001.
Fig. 3.
Fig. 3.
Looming-evoked flight to freeze shifts in retinal Brn3a knockout (KO) mice. A: ethogram of log (mouse speed) across looming response trials for Rax:Cre; Brn3aCKOAP/WT (left) and Rax:Cre; Brn3aCKOAP/KO (right) mice. Stimulus definition and ethogram description as in Fig. 2A. For behavior ethograms, see Supplemental Fig. S5. B: cumulative probability plots of fleeing (left), nest entry (middle), and freezing (right) for Rax:Cre; Brn3aCKOAP/WT (blue, 3–4 trials/mouse, n = 11 mice) and Rax:Cre; Brn3aCKOAP/KO (orange, 3–4 trials/mouse, n = 10 mice). C: behavior frequency during stimulus (First 0.75 s, left), or within 3 s (First 3 s, right) of stimulus presentation, for Rax:Cre; Brn3aCKOAP/WT (blue) and Rax:Cre; Brn3aCKOAP/KO (orange) mice. Data are normalized to total number of trials for each genotype. D: box-whisker plots for flee (left) and freeze (right) reaction times for trials where reaction was observed within 3 s of basic loom stimulus onset. Significance was determined using χ2 test for C and KS2 test for D. For all graphs: *P < 0.05, **P < 0.01.
Fig. 4.
Fig. 4.
Diminished looming-evoked flight in Opn4Cre/WT; Brn3bcDTA/WT mice. A: ethogram of log (mouse speed) across looming response trials for Brn3bcDTA/WT (left), Opn4Cre/WT (middle), and Opn4Cre/WT; Brn3bcDTA/WT (right) mice. Stimulus definition and ethogram description as in Fig. 2A. For behavior ethograms, see Supplemental Fig. S6. B: cumulative probability plots of fleeing (i), nest entry (ii), and freezing (iii) for Brn3bcDTA/WT (blue, 4 trials/mouse, n = 9 mice), Opn4Cre/WT (green, 4 trials/mouse, n = 9 mice), and Opn4Cre/WT; Brn3bcDTA/WT (red, 4 trials/mouse, n = 11 mice). C: behavior frequency during stimulus (First 0.75 s, left), or within 3 s (First 3 s, right) of stimulus presentation, for Brn3bcDTA/WT (blue), Opn4Cre/WT (green), and Opn4Cre/WT; Brn3bcDTA/WT (red). Data are normalized to total number of trials for each genotype. D: box-whisker plots for flee (left) and freeze (right) reaction times for trials where reaction was observed within 3 s of basic loom stimulus onset. Significance was determined using χ2 test for C and KS2 test for D. For all graphs: *P < 0.05.
Fig. 5.
Fig. 5.
Looming-evoked flight-to-freeze shifts in Brn3cCre/WT; Brn3bcDTA/WT mice. A: ethogram of log (mouse speed) across looming response trials for Brn3cCre/WT (left) and Brn3cCre/WT; Brn3bcDTA/WT (right) mice. Stimulus definition and ethogram description as in Fig. 2A. For behavior ethograms, see Supplemental Fig. S6. B: cumulative probability plots of fleeing (left), nest entry (middle), and freezing (right) for Brn3cCre/WT (orange, 4 trials/mouse, n = 7 mice) and Brn3cCre/WT; Brn3bcDTA/WT (black, 4 trials/mouse, n = 10 mice). C: behavior frequency during stimulus (First 0.75 s, left), or within 3 s (First 3 s, right) of stimulus presentation, for Brn3cCre/WT (orange) and Brn3cCre/WT; Brn3bcDTA/WT (black). Data are normalized to total number of trials for each genotype. D: box-whisker plots for flee (left) and freeze (right) reaction times for trials where reaction was observed within 3 s of basic loom stimulus onset. Significance was determined using χ2 test for C and KS2 test for D.
Fig. 6.
Fig. 6.
Characterization of freeze and flight responses to sweeping stimuli in Brn3bKO/KO mice. A: ethogram of log (mouse speed) across trials for Brn3bWT/WT (left) and Brn3bKO/KO (right) mice. Basic sweeping stimulus schematic: 2.6 cm (4.3°) black disk moving diagonally across screen at 21.8°/s over 4 s at contrast 0.55. Each horizontal bar is 1 trial; trials from each animal are marked with brackets and arranged top to bottom in chronological order (1st trial at the top). Stimulus duration is indicated by green outline, and time (x-axis) is centered on stimulus onset. Black areas denote nest entry, while white areas denote mice out of frame. For behavior ethograms, see Supplemental Fig. S7. B: cumulative probability plots of freezing (i, iv, vii, x, and xiii), flight (ii, v, viii, xi, and xiv), and nest entries (iii, vi, ix, xii, and xv). Freeze and flee behaviors are normalized to total number of viable trials in time bins of 0.1 s; nest entries are normalized to total number of trials at each time point. B, iiii: responses to basic stimulus conditions (speed 21.8 o/s, spot diameter = 4.3°) for Brn3bWT/WT (blue, 3–4 trials/mouse, n = 10 mice) and Brn3bKO/KO (red, 3–4 trials/mouse, n = 11 mice). B, ivvi: responses to “Big” stimulus conditions (speed 21.8 o/s, spot diameter = 7.67°). B, viiix: Responses to “Small” stimulus conditions (speed 21.8 o/s, spot diameter = 1.92°). B, xxii: responses to “Fast” stimulus conditions (speed 43.5 o/s, spot diameter = 4.3°). B, xiiixv: Responses to “Slow” stimulus conditions (speed 10.9 o/s, spot diameter = 4.3°). Experiments for each condition in ivxv were carried out for Brn3bWT/WT (blue, 2–4 trials, n = 8 mice) and Brn3bKO/KO mice (red, 2–4 trials, n = 6 mice). C: number of trials where behavior was observed during stimulus period, normalized to total number of trials. In CE, stimulus variants are indicated under the plots and colors of bars refer to mouse genotypes as indicated in A. D: time spent freezing for each trial, normalized to length of stimulus. Trials where no reactions were observed within stimulus period excluded. No significant differences found between the different genotypes under optimal (basic) stimulus conditions. Asterisks indicate significant effect of stimulus speed on normalized time spent freezing for WT mice. E: freeze reaction times. Trials with freezing episode starting before stimulus onset or after stimulus end excluded. For C, χ2 test was used to determine significance. For D and E, KS2 test was used to determine significance within same condition between genotypes, and Kruskal-Wallis test was used to determine whether there was an effect of size/speed of stimulus on reaction time or time spent freezing. For all graphs: *P < 0.05, **P < 0.01, ***P < 0.001.
Fig. 7.
Fig. 7.
Global and/or retinal specific Brn3b ablation differentially affects freeze and flight responses to sweeping stimuli. A: ethogram of log (mouse speed) across trials for Rax:Cre; Brn3bCKOAP/WT (left) and Rax:Cre; Brn3bCKOAP/CKOAP (right) mice. For Figs. 7–10, basic sweep stimulus was used: a 4.3° black disk moving diagonally across screen at 21.8°/s over 2.76 s at contrast 0.55. Ethogram description is as in Fig. 6A. For speed ethograms and behavior ethograms for all other genotypes in this figure see Supplemental Fig. S8. B: cumulative probability plots of freezing (left), fleeing (middle), and nest entry (right) for Brn3bWT/WT (blue, 3–4 trials/mouse, n = 10 mice), Brn3bKO/KO (red, 3–4 trials/mouse, n = 11 mice), and Brn3bKO/WT (green, 3–4 trials/mouse, n = 10 mice). Data for Brn3bWT/WT and Brn3bKO/KO mice from B are included here again for comparison purposes. C: cumulative probability plots of freezing (left), fleeing (middle), and nest entry (right) for Rax:Cre; Brn3bCKOAP/WT (orange, 3–4 trials/mice, n = 14 mice), Rax:Cre; Brn3bCKOAP/CKOAP (black, 4 trials/mice, n = 12 mice), and Rax:Cre; Brn3bCKOAP/KO (purple, 3–4 trials/mice, n = 10 mice). D: box-whisker plots for freeze reaction times. E: behavior frequency during stimulus. Data are normalized to total number of trials for each genotype. Data points in D and bars in E indicate the 6 Brn3b genotypes, color coded according to A. For D, KS2 test was used, and for E, χ2 test was used to determine significance. For all graphs: *P < 0.05, **P < 0.01, ***P < 0.001.
Fig. 8.
Fig. 8.
Sweep-evoked freeze and flight responses in retinal Brn3a knockout (KO) mice. A: ethogram of log (mouse speed) across sweep response trials for Rax:Cre; Brn3aCKOAP/WT (left) and Rax:Cre; Brn3aCKOAP/KO (right) mice. Stimulus definition and ethogram description as in Fig. 7A. For behavior ethograms, see Supplemental Fig. S8. B: cumulative probability plots of freezing (left), fleeing (middle), and nest entry (right) for Rax:Cre; Brn3aCKOAP/WT (blue, 3–4 trials/mouse, n = 11 mice) and Rax:Cre; Brn3aCKOAP/KO (orange, 3–4 trials/mouse, n = 10 mice). C: behavior frequency during stimulus for Rax:Cre; Brn3aCKOAP/WT (blue) and Rax:Cre; Brn3aCKOAP/KO (orange) mice. Data are normalized to total number of trials for each genotype. D: box-whisker plots for freezing reaction times. For D, KS2 test was used, and for C, χ2 test was used to determine significance. For all graphs: *P < 0.05, **P < 0.01.
Fig. 9.
Fig. 9.
Flight and freeze reactions to sweeping stimuli are not affected in Opn4Cre/WT; Brn3bcDTA/WT mice. A: ethogram of log (mouse speed) across sweeping response trials for Brn3bcDTA/WT (left), Opn4Cre/WT (middle), and Opn4Cre/WT; Brn3bcDTA/WT (right) mice. Stimulus definition and ethogram description as in Fig. 7A. For behavior ethograms, see Supplemental Fig. S9. B: cumulative probability plots of freezing (left), fleeing (middle), and nest entry (right) for Brn3bcDTA/WT (blue, 4 trials/mouse, n = 9 mice), Opn4Cre/WT (green, 4 trials/mouse, n = 9 mice), and Opn4Cre/WT; Brn3bcDTA/WT (red, 4 trials/mouse, n = 11 mice). C: box-whisker plots for freeze reaction times. D: behavior frequency during stimulus, for Brn3bcDTA/WT (blue), Opn4Cre/WT (green), and Opn4Cre/WT; Brn3bcDTA/WT (red). Data are normalized to total number of trials for each genotype. For C, KS2 test was used, and for D, χ2 test was used to determine significance. For all graphs: *P < 0.05.
Fig. 10.
Fig. 10.
Modest shifts in sweeping-evoked freeze and flight responses in Brn3cCre/WT; Brn3bcDTA/WT mice. A: ethogram of log (mouse speed) across looming response trials for Brn3cCre/WT (left) and Brn3cCre/WT; Brn3bcDTA/WT (right) mice. Stimulus definition and ethogram description as in Fig. 8A. For behavior ethograms, see Supplemental Fig. S9. B: cumulative probability plots of freezing (left), fleeing (middle), and nest entry (right), for Brn3cCre/WT (orange, 4 trials/mouse, n = 7 mice) and Brn3cCre/WT; Brn3bcDTA/WT (black, 4 trials/mouse, n = 10 mice). C: behavior frequency during stimulus for Brn3cCre/WT (orange) and Brn3cCre/WT; Brn3bcDTA/WT (black) mice. Data are normalized to total number of trials for each genotype. D: box-whisker plots for freeze reaction times. For D, KS2 test was used, and for C, χ2 test was used to determine significance. For all graphs: *P < 0.05.

References

    1. Badea TC, Cahill H, Ecker J, Hattar S, Nathans J. Distinct roles of transcription factors brn3a and brn3b in controlling the development, morphology, and function of retinal ganglion cells. Neuron 61: 852–864, 2009. doi:10.1016/j.neuron.2009.01.020. - DOI - PMC - PubMed
    1. Badea TC, Nathans J. Morphologies of mouse retinal ganglion cells expressing transcription factors Brn3a, Brn3b, and Brn3c: analysis of wild type and mutant cells using genetically-directed sparse labeling. Vision Res 51: 269–279, 2011. doi:10.1016/j.visres.2010.08.039. - DOI - PMC - PubMed
    1. Badea TC, Williams J, Smallwood P, Shi M, Motajo O, Nathans J. Combinatorial expression of Brn3 transcription factors in somatosensory neurons: genetic and morphologic analysis. J Neurosci 32: 995–1007, 2012. doi:10.1523/JNEUROSCI.4755-11.2012. - DOI - PMC - PubMed
    1. Bae JA, Mu S, Kim JS, Turner NL, Tartavull I, Kemnitz N, Jordan CS, Norton AD, Silversmith WM, Prentki R, Sorek M, David C, Jones DL, Bland D, Sterling AL, Park J, Briggman KL, Seung HS; Eyewirers . Digital museum of retinal ganglion cells with dense anatomy and physiology. Cell 173: 1293–1306.e19, 2018. doi:10.1016/j.cell.2018.04.040. - DOI - PMC - PubMed
    1. Ben-Shaul Y. OptiMouse: a comprehensive open source program for reliable detection and analysis of mouse body and nose positions. BMC Biol 15: 41, 2017. doi:10.1186/s12915-017-0377-3. - DOI - PMC - PubMed

Publication types

Substances