

Development and external validation of a prediction risk model for short-term mortality among hospitalized U.S. COVID-19 patients: A proposal for the COVID-AID risk tool
- PMID: 32997700
- PMCID: PMC7526907
- DOI: 10.1371/journal.pone.0239536
Development and external validation of a prediction risk model for short-term mortality among hospitalized U.S. COVID-19 patients: A proposal for the COVID-AID risk tool
Abstract
Background: The 2019 novel coronavirus disease (COVID-19) has created unprecedented medical challenges. There remains a need for validated risk prediction models to assess short-term mortality risk among hospitalized patients with COVID-19. The objective of this study was to develop and validate a 7-day and 14-day mortality risk prediction model for patients hospitalized with COVID-19.
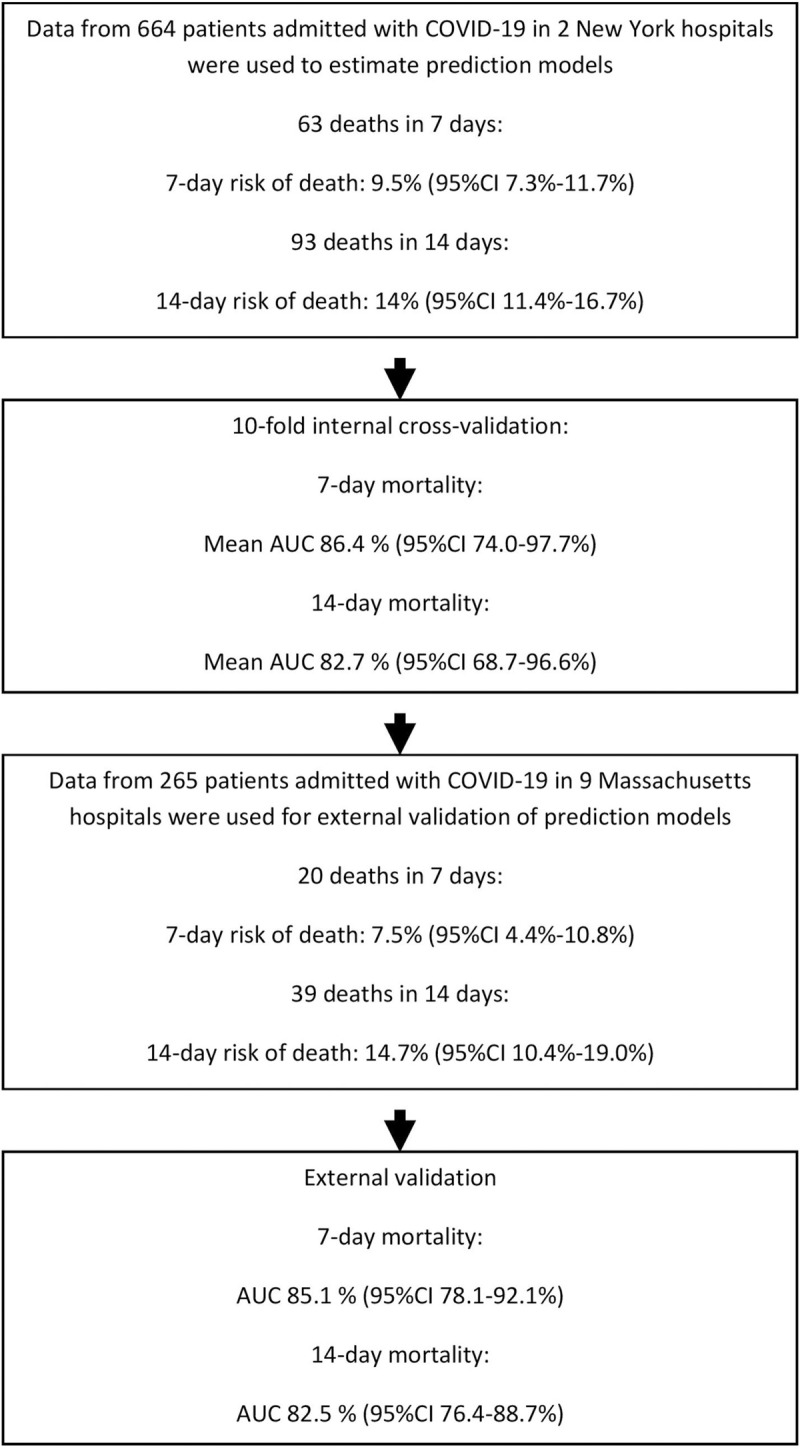
Methods: We performed a multicenter retrospective cohort study with a separate multicenter cohort for external validation using two hospitals in New York, NY, and 9 hospitals in Massachusetts, respectively. A total of 664 patients in NY and 265 patients with COVID-19 in Massachusetts, hospitalized from March to April 2020.
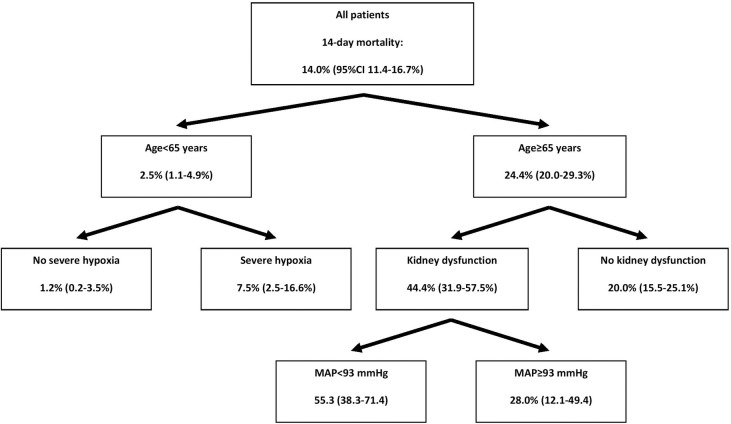
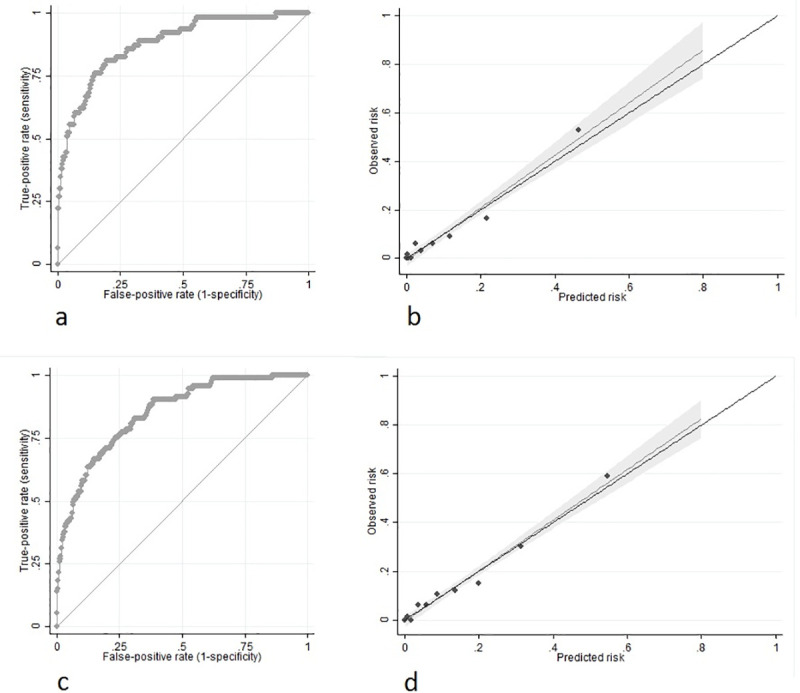
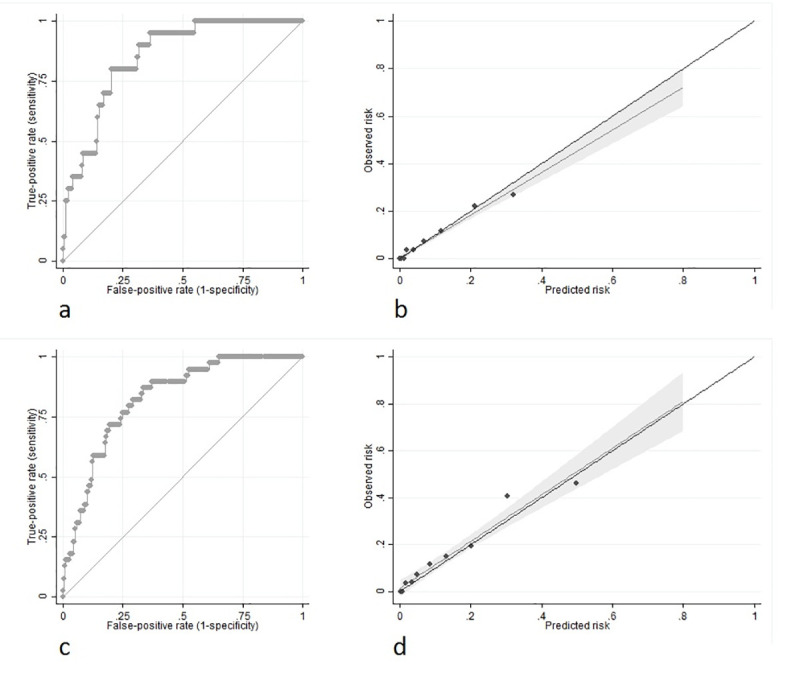
Results: We developed a risk model consisting of patient age, hypoxia severity, mean arterial pressure and presence of kidney dysfunction at hospital presentation. Multivariable regression model was based on risk factors selected from univariable and Chi-squared automatic interaction detection analyses. Validation was by receiver operating characteristic curve (discrimination) and Hosmer-Lemeshow goodness of fit (GOF) test (calibration). In internal cross-validation, prediction of 7-day mortality had an AUC of 0.86 (95%CI 0.74-0.98; GOF p = 0.744); while 14-day had an AUC of 0.83 (95%CI 0.69-0.97; GOF p = 0.588). External validation was achieved using 265 patients from an outside cohort and confirmed 7- and 14-day mortality prediction performance with an AUC of 0.85 (95%CI 0.78-0.92; GOF p = 0.340) and 0.83 (95%CI 0.76-0.89; GOF p = 0.471) respectively, along with excellent calibration. Retrospective data collection, short follow-up time, and development in COVID-19 epicenter may limit model generalizability.
Conclusions: The COVID-AID risk tool is a well-calibrated model that demonstrates accuracy in the prediction of both 7-day and 14-day mortality risk among patients hospitalized with COVID-19. This prediction score could assist with resource utilization, patient and caregiver education, and provide a risk stratification instrument for future research trials.
Conflict of interest statement
The authors have declared that no competing interests exist.
Figures
Similar articles
-
A nomogram for predicting mortality in patients with COVID-19 and solid tumors: a multicenter retrospective cohort study.J Immunother Cancer. 2020 Sep;8(2):e001314. doi: 10.1136/jitc-2020-001314. J Immunother Cancer. 2020. PMID: 32895296 Free PMC article.
-
Machine Learning to Predict Mortality and Critical Events in a Cohort of Patients With COVID-19 in New York City: Model Development and Validation.J Med Internet Res. 2020 Nov 6;22(11):e24018. doi: 10.2196/24018. J Med Internet Res. 2020. PMID: 33027032 Free PMC article.
-
Development of a multivariate prediction model of intensive care unit transfer or death: A French prospective cohort study of hospitalized COVID-19 patients.PLoS One. 2020 Oct 19;15(10):e0240711. doi: 10.1371/journal.pone.0240711. eCollection 2020. PLoS One. 2020. PMID: 33075088 Free PMC article.
-
External validation of six COVID-19 prognostic models for predicting mortality risk in older populations in a hospital, primary care, and nursing home setting.J Clin Epidemiol. 2024 Apr;168:111270. doi: 10.1016/j.jclinepi.2024.111270. Epub 2024 Feb 2. J Clin Epidemiol. 2024. PMID: 38311188
-
Predicting clinical outcomes among hospitalized COVID-19 patients using both local and published models.BMC Med Inform Decis Mak. 2021 Jul 24;21(1):224. doi: 10.1186/s12911-021-01576-w. BMC Med Inform Decis Mak. 2021. PMID: 34303356 Free PMC article. Review.
Cited by
-
When to operate after SARS-CoV-2 infection? A review on the recent consensus recommendation of the DGC/BDC and the DGAI/BDA.Langenbecks Arch Surg. 2022 Jun;407(4):1315-1332. doi: 10.1007/s00423-022-02495-8. Epub 2022 Mar 21. Langenbecks Arch Surg. 2022. PMID: 35307746 Free PMC article. Review.
-
Explainable Machine Learning for Early Assessment of COVID-19 Risk Prediction in Emergency Departments.IEEE Access. 2020 Oct 26;8:196299-196325. doi: 10.1109/ACCESS.2020.3034032. eCollection 2020. IEEE Access. 2020. PMID: 34812365 Free PMC article.
-
An architecture for research computing in health to support clinical and translational investigators with electronic patient data.J Am Med Inform Assoc. 2022 Mar 15;29(4):677-685. doi: 10.1093/jamia/ocab266. J Am Med Inform Assoc. 2022. PMID: 34850911 Free PMC article.
-
Clinical characteristics and outcomes of 1,331 patients with COVID-19: HM Spanish Cohort.Rev Esp Quimioter. 2021 Aug;34(4):342-352. doi: 10.37201/req/050.2021. Epub 2021 May 19. Rev Esp Quimioter. 2021. PMID: 34008930 Free PMC article.
-
Prognostic models in COVID-19 infection that predict severity: a systematic review.Eur J Epidemiol. 2023 Apr;38(4):355-372. doi: 10.1007/s10654-023-00973-x. Epub 2023 Feb 25. Eur J Epidemiol. 2023. PMID: 36840867 Free PMC article.
References
Publication types
MeSH terms
LinkOut - more resources
Full Text Sources
Miscellaneous
