. 2020 Nov 2;219(11):e202006054.
doi: 10.1083/jcb.202006054.

The proline-rich domain promotes Tau liquid-liquid phase separation in cells

Affiliations

The proline-rich domain promotes Tau liquid-liquid phase separation in cells

Xuemei Zhang et al. J Cell Biol. .

Abstract

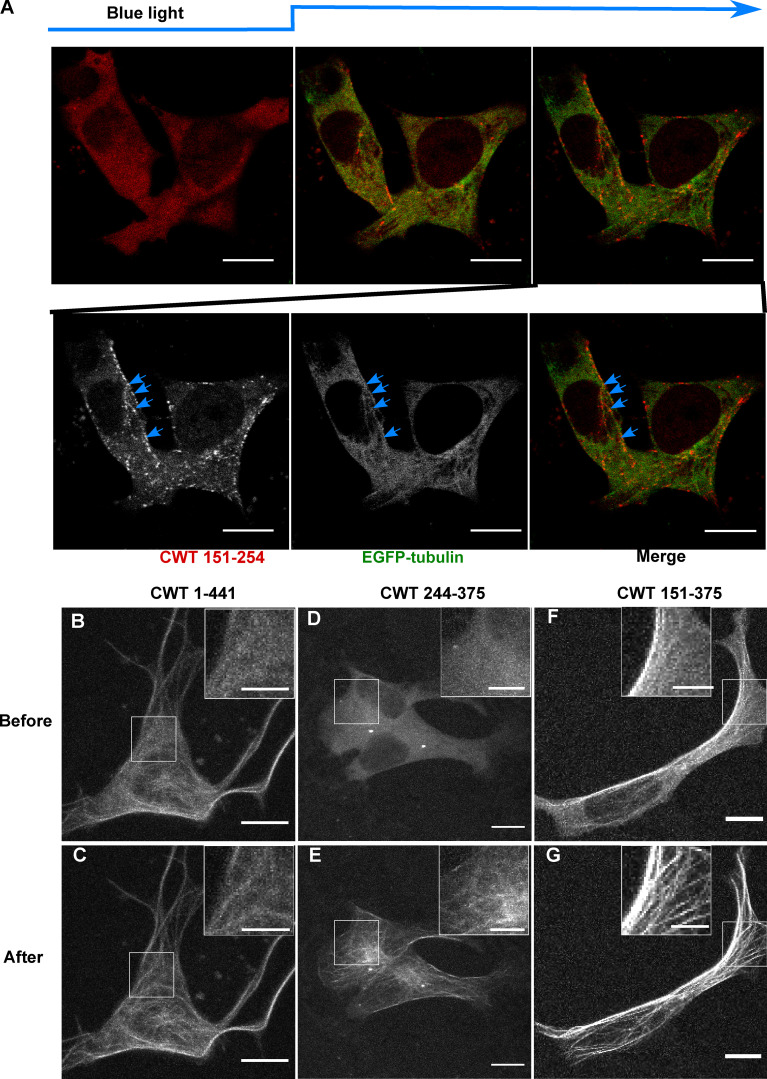
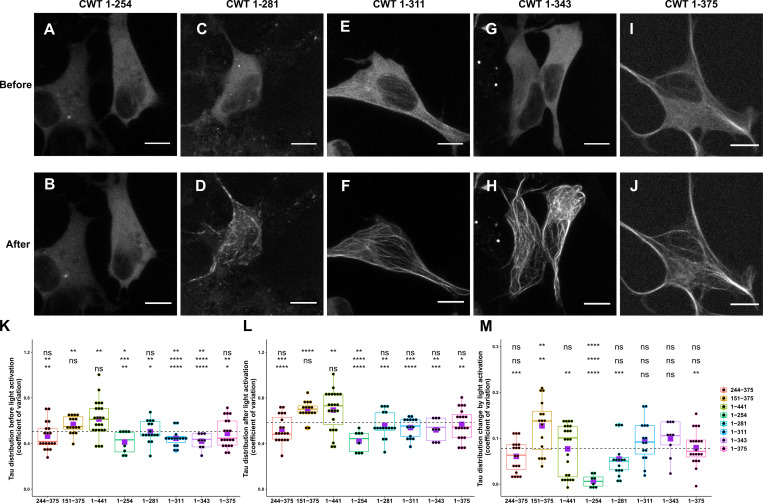
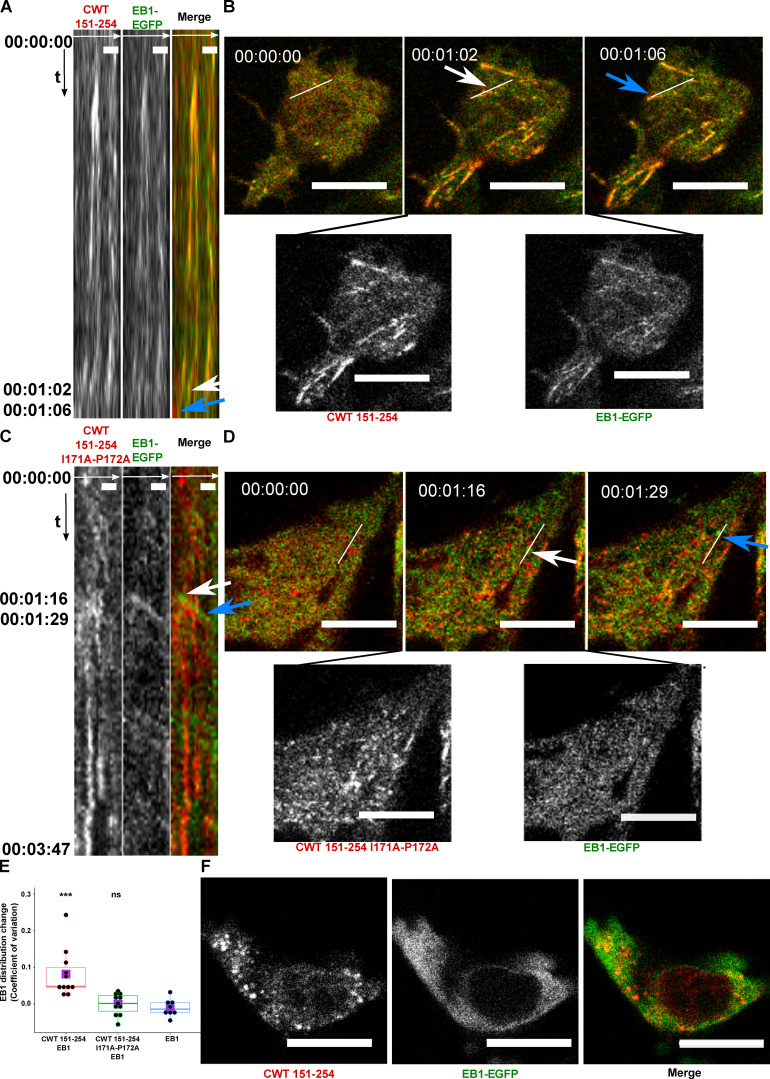
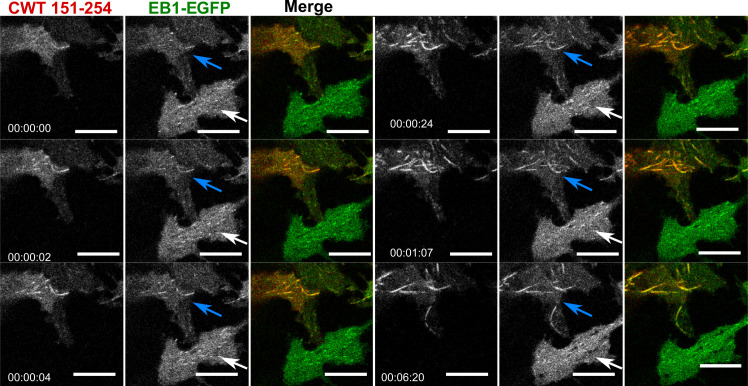
Tau protein in vitro can undergo liquid-liquid phase separation (LLPS); however, observations of this phase transition in living cells are limited. To investigate protein state transitions in living cells, we attached Cry2 to Tau and studied the contribution of each domain that drives the Tau cluster in living cells. Surprisingly, the proline-rich domain (PRD), not the microtubule binding domain (MTBD), drives LLPS and does so under the control of its phosphorylation state. Readily observable, PRD-derived cytoplasmic condensates underwent fusion and fluorescence recovery after photobleaching consistent with the PRD LLPS in vitro. Simulations demonstrated that the charge properties of the PRD predicted phase separation. Tau PRD formed heterotypic condensates with EB1, a regulator of plus-end microtubule dynamic instability. The specific domain properties of the MTBD and PRD serve distinct but mutually complementary roles that use LLPS in a cellular context to implement emergent functionalities that scale their relationship from binding α-beta tubulin heterodimers to the larger proportions of microtubules.


Figures

Figure 1.
Figure 1.
Tau condensation mediates binding to MTs. (A and B) Representative Z-stack images of Cry2WT-mCherry-Tau 2N4R 1–441 (CWT 1–441) overexpressed in neuroblastoma SH SY5Y cell before (A) and 50 s after activation (B). Signal from the diffuse pool was reduced and the MT signal (blue arrows) increased. Scale bar, 5 µm. (C) Schematic diagram of Cry2WT-mCherry-Tau constructs studied, the Cry2WT fused to mCherry, and various Tau fragments.
Figure S1.
Figure S1.
Quantification of Cry2WT-mCherry-Tau (CWT 1–441) distribution in SH SY5Y before and after blue-light activation and Tau dissociates from MTs after 1,6-HD treatment in HeLa cells. (A) Cry2WT-mCherry-Tau (CWT 1–441) distribution in SH SY5Y before activation (green dots), after activation (orange dots), and change by activation (blue dots) were quantified using pixel CV (y axis) for each cell (x axis). The CV of the Tau signal after blue-light activation is significantly higher than before, n = 23, P = 7.0 × 10⁻⁷, paired t test. (B–D) Full-length Tau 1–441-EGFP is sensitive to 1,6-HD but not to 2,5-HD. (B) Protein schematic diagram of Tau 1–441-EGFP. (C) Tau 1–441-EGFP expressed in HeLa cells was treated with 1,6-HD, which resulted in the loss of a MT-binding pattern to a diffuse pattern. Selected images at 0 min, 1.5 min, and 3 min are presented. (D) Tau 1–441-EGFP was treated with 2,5-HD in HeLa cell; selected images at 0 min, 3 min, and extended time to 20 min are presented. Tau binds to MT even after extended treatment of 2,5-HD. (E and F) Tau truncations containing MTBD and the extreme C terminus remain sensitive to 1,6-HD treatment, and MT was not affected. (E) Protein schematic diagram of Tau 256–441-EGFP. (F) Tau 256–441-EGFP (green) and mCherry-α-tubulin (red) were overexpressed in HeLa cells, treated with 1,6-HD. Montage of selected images at 0 min and 3 min treatment are presented. From left to right, mCherry-α-tubulin, Tau 256–441-EGFP, and the merge. While truncated Tau became diffuse after 3 min, mCherry-α-tubulin still maintained the MT pattern. Note that there is a nuclear population of EGFP signal for Tau 256–441-EGFP overexpression, which is commonly seen for EGFP fused with proteins of low molecular weight. (G) Quantification of Tau distribution upon 1,6-HD or 2,5-HD treatment based upon CV. Distribution of Tau 1–441-EGFP treated with 1,6-HD (black), Tau 1–441-EGFP treated with 2,5-HD (orange), Tau 256–441-EGFP treated with 1,6-HD (gray), and mCherry-a-tubulin treated with 1,6-HD (yellow) was evaluated and plotted over the time. ID, identification; t, time.
Figure 2.
Figure 2.
LLPS of Cry2WT-mCherry-Tau 151–254 (CWT 151–254). (A) CWT 151–254 overexpressed in SH SY5Y cells activated by shallow blue light (488 nm, 5% power) rapidly induced condensates (blue arrowheads). Representative fluorescent images at 0 and 5 s after activation are shown. Occasional preactivation foci are sometimes present and do not participate in light-activated phase separation (blue arrow). (B) Temporal evolution of phase separation of CWT 151–254 (black points) and Cry2WT-mCherry (orange points) was monitored on a single confocal plane, quantified by CV across the cell and plotted over time. n = 7 for CWT 151–254 and n = 5 for Cry2WT-mCherry; error bar in SE. (C and D) FRAP of CWT 151–254. (C) Representative time-lapse images of FRAP indicated by the 3 × 3-µm bleach site is marked by the white square. See Video 1. (D) Integrated intensity density for the bleached areas was monitored over time during FRAP. 55% recovery was achieved after bleaching. n = 3. (E and F) CWT 151–254 phase separation is reversible. (E) Time-lapse images of maximum intensity Z-projection of CWT 151–254 show phase separation is reversible after the withdrawal of blue light (0–14 min) and reassembled when subject to blue light reactivation (14–33 min). (F) Quantification of CWT 151–254 from disassembly to reassembly as light power changes. CWT 151–254 distribution quantified by CV (black) and light activation indicated by the blue light power (blue) were plotted over time. n = 8; error bar in SE. (G) Time-lapse images of local shallow light activation of CWT 151–254 demonstrate localized progression toward phase separation. A rectangular area of 3 × 3-µm (white square) was stimulated with blue light. See also Video 2 for local activation and the field activation followed. Scale bar, 10 µm. t, time.
Figure 3.
Figure 3.
Repeated deep blue-light activation reduced recovery of Cry2WT-mCherry-Tau 151–254 (CWT 151–254) biocondensates. (A) Top: A sequence of three cycles of deep blue-light activation, 488 nm, 100% power for 10 min, each followed by 26 min of recovery time applied to SH SY5Y cells, in which CWT 151–254 was overexpressed. Bottom: Time-lapse of single Z-stack images shows CWT 151–254 biocondensate assembly upon light activation and disassembly when light was removed following the sequence on the top. For each cycle, the image at initial activation and recovery at 0, 7, 13, 20, and 26 min are shown. (B) The number of the clusters post-activation was counted and plotted. (C) Redistribution of CWT 151–254 through the time course is quantified by CV and change in light power over the time course. Scale bar, 10 µm. t, time.
Figure 4.
Figure 4.
Cry2WT-mCherry-Tau fragments associate with MT. (A) Association of PRD condensates with MTs. EGFP-α-tubulin (green) and CWT 151–254 (red) were coexpressed in neuroblastoma SH SY5Y cells. Time-lapse images show CWT 151–254 forms LLPS upon blue-light activation starting from the second time frame. Montage of two fluorescent channels in the third time frame demonstrates CWT 151–254 foci are attached to EGFP-α-tubulin on MT, like beads on a thread (blue arrow). (B–G) Cry2WT-mCherry fused to MTBD without and with PRD were overexpressed in SH SY5Y cells, and signal distribution was studied before and after blue light. Representative maximum intensity Z-projection images before and after blue light of each construct are shown, CWT 1–441 before (B) and after (C), CWT 244–375 before (D) and after (E), CWT 151–375 before (F) and after (G). Insets (scale bar, 5 µm) within the white rectangle show more details of the diffuse pool and the MT-binding population in each construct. Scale bar unless specifically mentioned, 10 µm.
Figure S2.
Figure S2.
Comparison of Cry2WT-mCherry-Tau distribution before and after light activation for various Tau constructs. (A–J) Cry2WT-mCherry fused various Tau constructs was overexpressed in SH SY5Y cells. Signal distribution was studied before and after blue light. Representative maximum intensity Z-projection images before and after blue light of each construct are shown, CWT 1–254 before (A) and after (B), CWT 1–281 before (C) and after (D), CWT 1–311 before (E) and after (F), CWT 1–343 before (G) and after (H), and CWT 1–375 before (I) and after (J). Scale bar, 10 µm. (K–M) Quantifications of Cry2WT-mCherry-Tau distribution before activation (K), after activation (L), and change by activation (M) are shown in boxplot. Constructs from left to right along the x axis are CWT 244–375, CWT 151–375, CWT 1–441, CWT 1–254, CWT 1–281, CWT 1–311, CWT 1–343, and CWT 1–375. Distribution of Cry2WT-mCherry-Tau is evaluated by pixel CV over the cell shown along the y axis. n = 19, 16, 23, 8, 16, 15, 9, and 20 for constructs from left to right along the x axis. Mean for each group is indicated by a purple square, also listed in Table S1. Base-mean for all the constructs as a whole is indicated as a horizontal dotted line. Statistical significance by pairwise t test of each independent group is indicated at the top of each plot, from top to bottom, against all the constructs as a whole, against CWT 1–441, and against CWT 151–375, correspondingly. *, P < 0.05; **, P < 0.01; ***, P < 0.001; ****, P < 0.0001.
Figure 5.
Figure 5.
Cry2WT-mCherry-Tau 151–254 (CWT 151–254) tracks with EB1 after blue-light activation. (A and B) CWT 151–254 overexpressed with EB1-EGFP in SH SY5Y cells and activated by shallow blue light (488 nm, 5% power) induced colocalization. (A) Kymograph of CWT 151–254 (red) and EB1-EGFP (green) is generated from time-lapse imaging for 66 s at 2-s imaging intervals, with the x axis the selected line crossing the image and the y axis the time of recording. Fluorescence imaging of two channels shows the formed CWT 151–254 (red) condensate colocalized with moving EB1-EGFP (green). Scale bar, 2 µm. (B) Representative time-lapse images at the times of 00:00:00, 00:01:02, and 00:01:06 are shown in the top panel, where the line used to generate the kymograph is shown in white. The kymograph in A moves from left to right. Selected moving foci on the line are indicated with white or blue arrows on both the kymograph and the corresponding time-lapse images. Two fluorescent channels of the middle image at 00:01:02, CWT 151–254 (red, left), EB1-EGFP (green, right), are presented at the bottom panel. See also Video 3. (C and D) CWT 151–254 with I171A and P172A double mutant and EB1-EGFP overexpressed in SH SY5Y cells activated by shallow blue light (488 nm, 5% power). The induced double mutant CWT 151–254 (red) condensate does not colocalize with EB1-EGFP. (C) Kymograph of CWT 151–254 with I171A and P172A double mutant (red) and EB1-EGFP (green) generated from a time-lapse imaging for 3 min and 47 s at 2-s imaging intervals, with the x axis being the selected line crossing the image and the y axis the time of recording. Fluorescence imaging of two channels shows the formed CWT 151–254 with I171A and P172A double mutant (red) condensate does not colocalize with moving EB1-EGFP (green). Scale bar, 2 µm. (D) Representative time-lapse images at the times of 00:00:00, 00:01:16, and 00:01:29 are shown in the top panel, where the line used to generate the kymograph is shown in white. Selected moving foci on the line are indicated with white or blue arrows on both the kymograph and the corresponding time-lapse images. Two fluorescent channels the middle image at 00:01:16, CWT 151–254 I171A and P172A (red, left), EB1-EGFP (green, right), are presented in the bottom panel. (E) Quantification of EB1-EGFP distribution after light activation. EB1 was expressed in SH SY5Y cells with CWT 151–254, or with CWT 151–254 I171A/P172A double mutant, or with no co-overexpression. Distribution of EB1 is evaluated by the change in the CV after 60 s of light activation shown along the y axis. n = 11, 11, and 8 for the groups from left to right along the x axis. Mean for each group is indicated by a purple square. Statistical significance by pairwise t test of each independent group against EB1 without CWT 151–254 is indicated at the top of the plot. (F) CWT 151–254 (red) and EB1-EGFP (green) overexpressed in SH SY5Y cell, treated with 20 µM nocodazole for 2 h, activated by blue light. EB1-EGFP appeared diffuse in the cytoplasm and not colocalized with the CWT 151–254 light-induced spherical condensates. Representative montage image is shown. See also Video 4. Montage of two fluorescent channels is presented from the left, the mCherry channel, the GFP channel separate and the merged. Scale bar, 10 µm unless specifically mentioned. ns, not significant. ***, P < 0.001.
Figure S3.
Figure S3.
Cry2WT-mCherry-Tau 151–254 (CWT 151–254)/EB1-EGFP bound along the MT lattice of MT bundles upon light activation. Time-lapse of EB1-EGFP (green) when overexpressed with Cry2WT-mCherry-Tau 151–254 (CWT 151–254, red) in SH SY5Y cells activated by shallow blue light (488 nm, 5% power). Note that besides binding MT +TIPs and moving as comets, upon light activation, some CWT 151–254/EB1-EGFP extended the binding along the MT lattice and MT bundles (following the blue arrows in the time-lapse) while the cell at the bottom, which also has expression of EB1-EGFP but no CWT 151–254, does not show shift of EB1 localization from MT +TIPS, remaining as a comet (white arrows). Montage of two fluorescent channels is presented in the order from left, the mCherry channel, the GFP channel separate, and merged. Scale bar, 10 µm.
Figure 6.
Figure 6.
Similar to Tau 255–441, Tau 151–254 can form droplets in vitro. (A) Representative bright-field images of Tau 151–254/polyU droplets. Scale bar is 50 µm. (B) Direct comparison of Tau 151–254 (red) and Tau 255–441(black) shows phase separation occurs for both protein segments with addition of PolyU or heparin. In contrast to the Tau 255–441 heparin complex, Tau 151–254 does not show the capacity to form fibrils with either PolyU or heparin. Turbidity was evaluated at 500 nm (filled bar); fibrilization was evaluated by ThT fluorescence (striped bar). Protein concentration was 50 µM, PolyU concentration (where applicable) was 125 µg/ml, and heparin concentration was 12.5 µM. All data were normalized by the largest measured value or absorbance or fluorescence. n = 3; error bar in SD. (C) Predicted Tau 151–254/RNA binodal phase coexistence points modeled using FTS. Calculations performed for Tau 151–254 (red dots) are compared with our previously reported (Lin et al., 2019) phase diagram for Tau 255–441 (black dots), showing that both sequences have a stable two-phase region under similar electrostatic environments and solvent conditions. The conditions for stable binodal phase coexistence depend on the strength of the electrostatic interaction, characterized in our model by the lB as the input parameter. The region defined by the coexistence points is the region at which the system forms a thermodynamically stable droplet phase in coexistence with a solution phase. Areas corresponding to one-phase or two-phase are shown in the diagram.

References

    1. Akhmanova A., and Steinmetz M.O.. 2010. Microtubule +TIPs at a glance. J. Cell Sci. 123:3415–3419. 10.1242/jcs.062414 - DOI - PubMed
    1. Alberti S., Gladfelter A., and Mittag T.. 2019. Considerations and Challenges in Studying Liquid-Liquid Phase Separation and Biomolecular Condensates. Cell. 176:419–434. 10.1016/j.cell.2018.12.035 - DOI - PMC - PubMed
    1. Ambadipudi S., Biernat J., Riedel D., Mandelkow E., and Zweckstetter M.. 2017. Liquid-liquid phase separation of the microtubule-binding repeats of the Alzheimer-related protein Tau. Nat. Commun. 8:275 10.1038/s41467-017-00480-0 - DOI - PMC - PubMed
    1. Bieling P., Laan L., Schek H., Munteanu E.L., Sandblad L., Dogterom M., Brunner D., and Surrey T.. 2007. Reconstitution of a microtubule plus-end tracking system in vitro. Nature. 450:1100–1105. 10.1038/nature06386 - DOI - PubMed
    1. Bieling P., Kandels-Lewis S., Telley I.A., van Dijk J., Janke C., and Surrey T.. 2008. CLIP-170 tracks growing microtubule ends by dynamically recognizing composite EB1/tubulin-binding sites. J. Cell Biol. 183:1223–1233. 10.1083/jcb.200809190 - DOI - PMC - PubMed

Publication types