

Early prediction of mortality risk among patients with severe COVID-19, using machine learning
- PMID: 32997743
- PMCID: PMC7543461
- DOI: 10.1093/ije/dyaa171
Early prediction of mortality risk among patients with severe COVID-19, using machine learning
Abstract
Background: Coronavirus disease 2019 (COVID-19), caused by severe acute respiratory syndrome coronavirus 2 infection, has been spreading globally. We aimed to develop a clinical model to predict the outcome of patients with severe COVID-19 infection early.
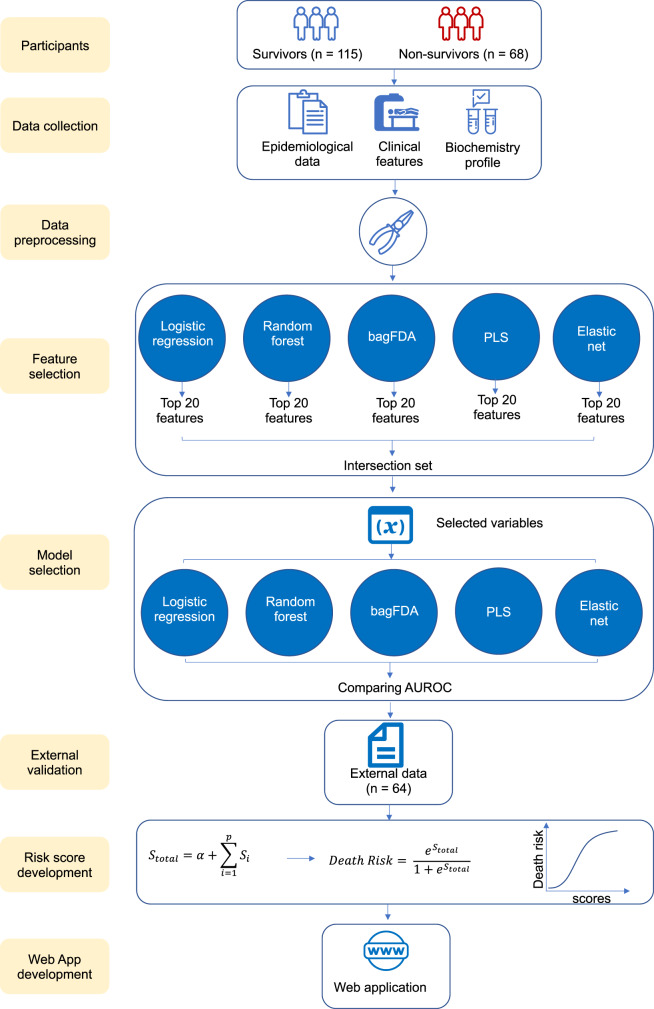
Methods: Demographic, clinical and first laboratory findings after admission of 183 patients with severe COVID-19 infection (115 survivors and 68 non-survivors from the Sino-French New City Branch of Tongji Hospital, Wuhan) were used to develop the predictive models. Machine learning approaches were used to select the features and predict the patients' outcomes. The area under the receiver operating characteristic curve (AUROC) was applied to compare the models' performance. A total of 64 with severe COVID-19 infection from the Optical Valley Branch of Tongji Hospital, Wuhan, were used to externally validate the final predictive model.
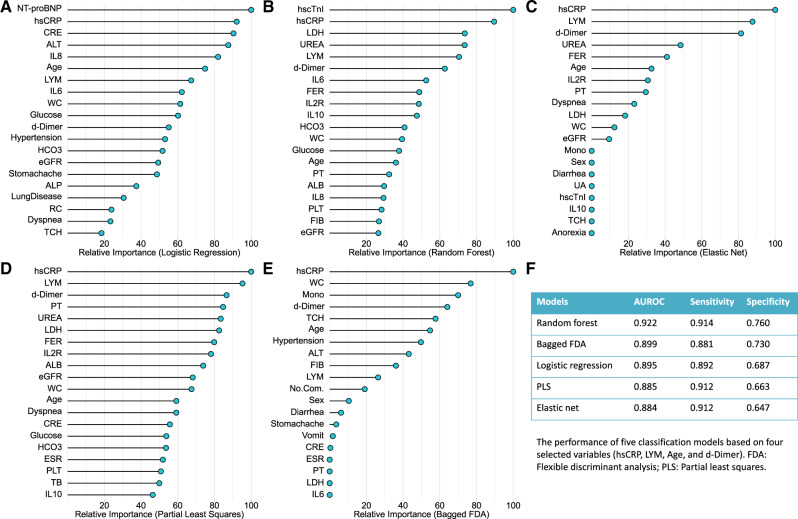
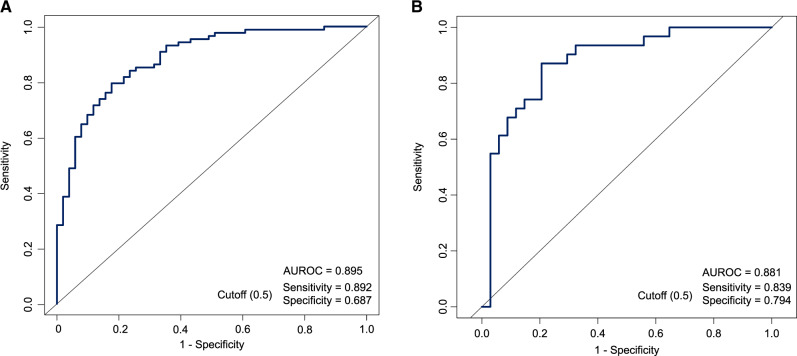
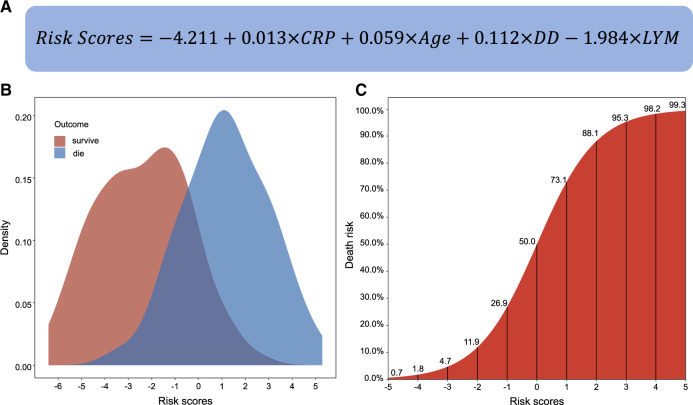
Results: The baseline characteristics and laboratory tests were significantly different between the survivors and non-survivors. Four variables (age, high-sensitivity C-reactive protein level, lymphocyte count and d-dimer level) were selected by all five models. Given the similar performance among the models, the logistic regression model was selected as the final predictive model because of its simplicity and interpretability. The AUROCs of the external validation sets were 0.881. The sensitivity and specificity were 0.839 and 0.794 for the validation set, when using a probability of death of 50% as the cutoff. Risk score based on the selected variables can be used to assess the mortality risk. The predictive model is available at [https://phenomics.fudan.edu.cn/risk_scores/].
Conclusions: Age, high-sensitivity C-reactive protein level, lymphocyte count and d-dimer level of COVID-19 patients at admission are informative for the patients' outcomes.
Keywords: COVID-19; death; fatality rate; machine learning; predictive model.
© The Author(s) 2020; all rights reserved. Published by Oxford University Press on behalf of the International Epidemiological Association.
Figures
References
-
- World Health Organization. Coronavirus Disease (COVID-19) Pandemic. 2020. https://www.who.int/emergencies/diseases/novel-coronavirus-2019 (8 June 2020, date last accessed).
Publication types
MeSH terms
LinkOut - more resources
Full Text Sources
Medical
Research Materials
