. 2021 Jan 7;28(1):33-47.e8.
doi: 10.1016/j.stem.2020.09.004. Epub 2020 Sep 29.

MYC Promotes Bone Marrow Stem Cell Dysfunction in Fanconi Anemia

Affiliations

MYC Promotes Bone Marrow Stem Cell Dysfunction in Fanconi Anemia

Alfredo Rodríguez et al. Cell Stem Cell. .

Abstract

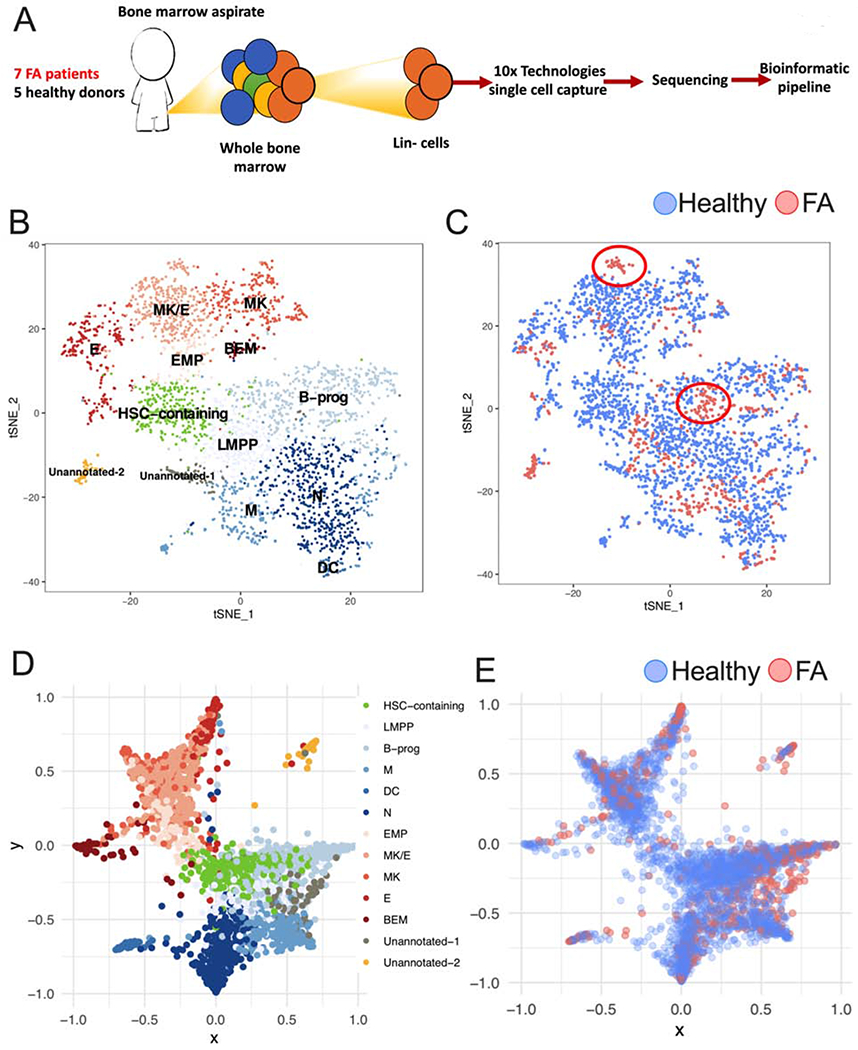
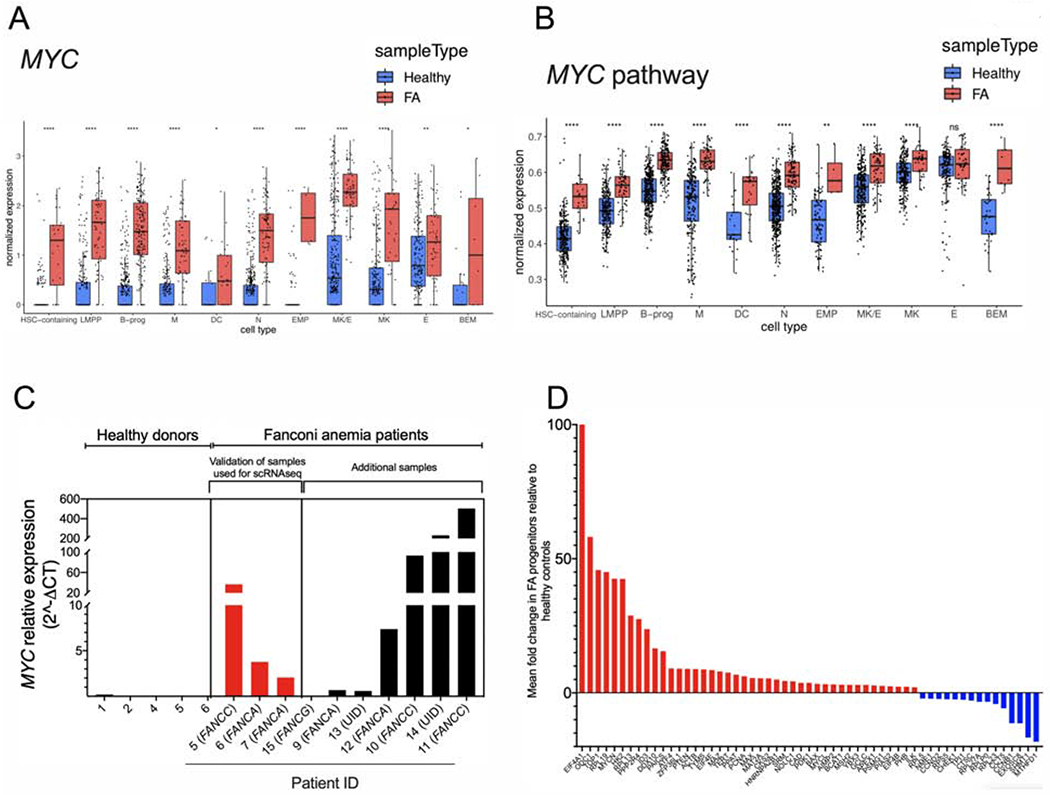
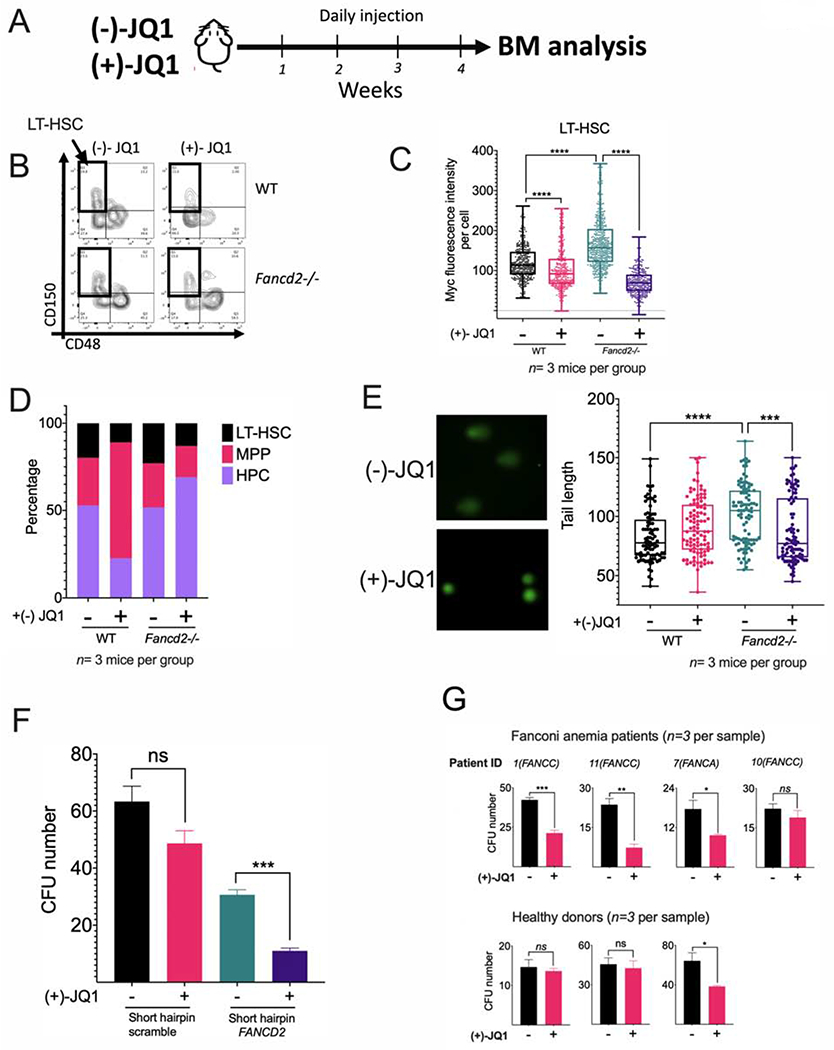
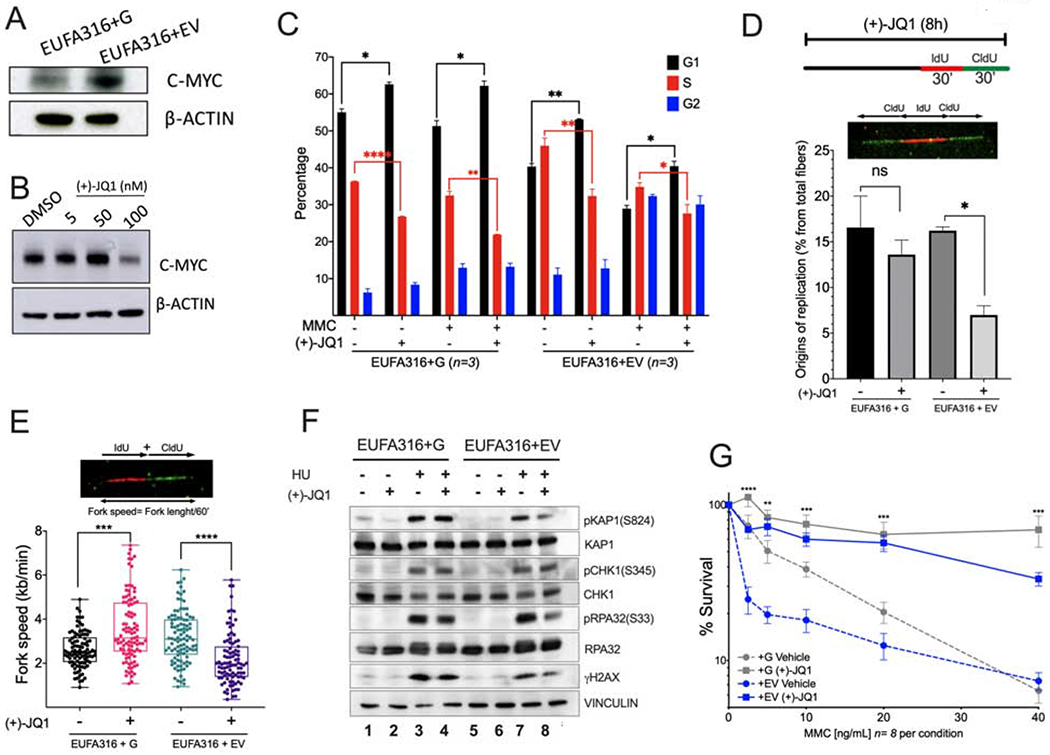
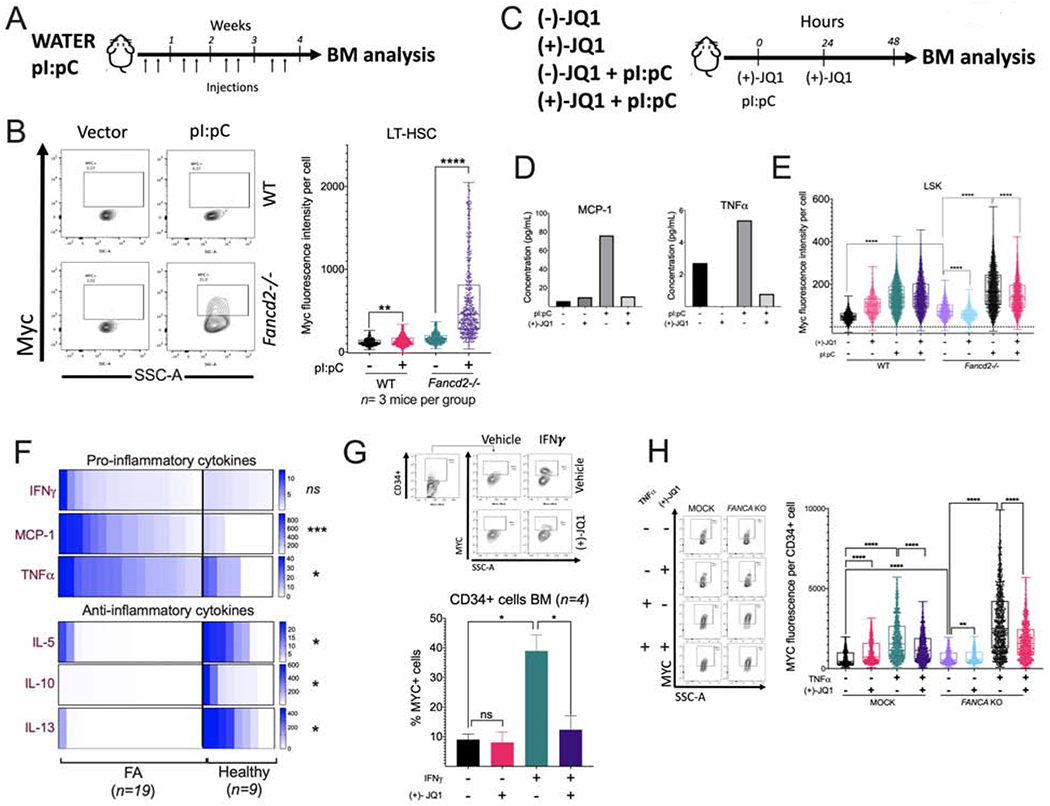
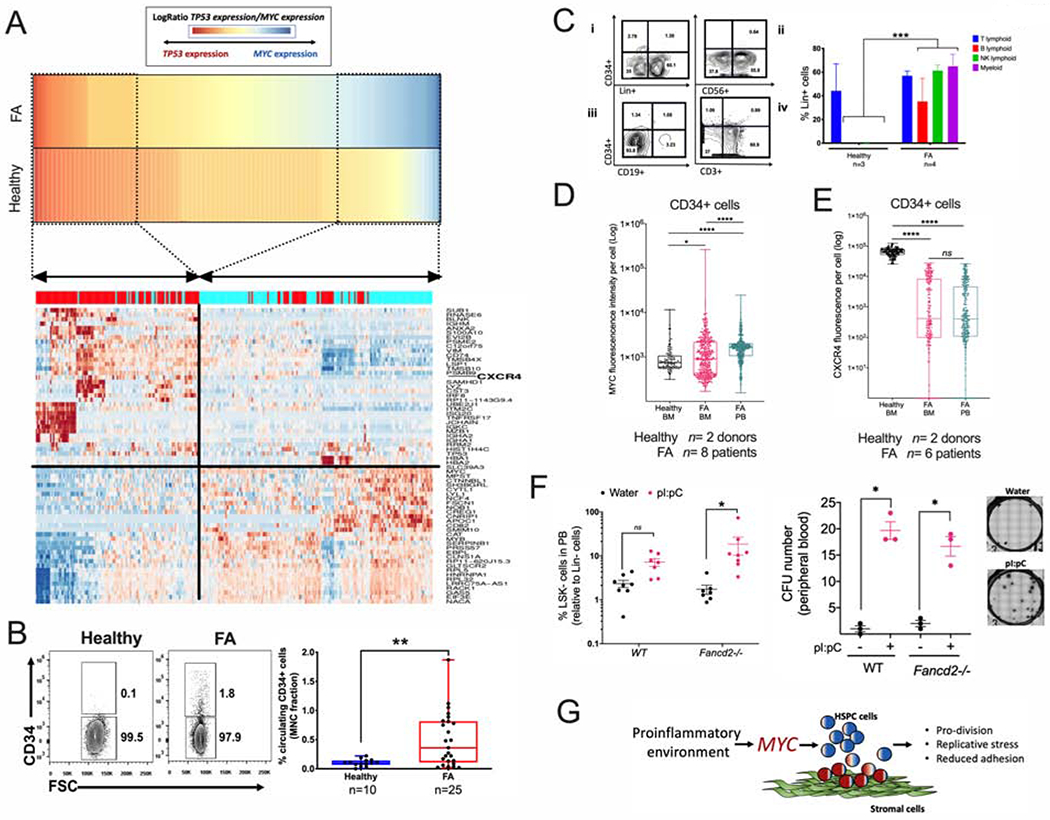
Bone marrow failure (BMF) in Fanconi anemia (FA) patients results from dysfunctional hematopoietic stem and progenitor cells (HSPCs). To identify determinants of BMF, we performed single-cell transcriptome profiling of primary HSPCs from FA patients. In addition to overexpression of p53 and TGF-β pathway genes, we identified high levels of MYC expression. We correspondingly observed coexistence of distinct HSPC subpopulations expressing high levels of TP53 or MYC in FA bone marrow (BM). Inhibiting MYC expression with the BET bromodomain inhibitor (+)-JQ1 reduced the clonogenic potential of FA patient HSPCs but rescued physiological and genotoxic stress in HSPCs from FA mice, showing that MYC promotes proliferation while increasing DNA damage. MYC-high HSPCs showed significant downregulation of cell adhesion genes, consistent with enhanced egress of FA HSPCs from bone marrow to peripheral blood. We speculate that MYC overexpression impairs HSPC function in FA patients and contributes to exhaustion in FA bone marrow.

Keywords: CXCR4; DNA damage; Fanconi anemia; MYC; bone marrow failure; genotoxic stress; hematopoietic stem cells; p53; physiological stress; single-cell RNA sequencing.


Conflict of interest statement

Declaration of Interests The authors declare no competing interests.

Figures

Figure 1.
Figure 1.. Single cell RNA sequencing reveals that early hematopoiesis is not perturbed in FA.
(A) Lin- cells from 7 patients with FA and 5 healthy donors (Supplementary Table 1) were individually captured, lysed and barcoded using the 10x Chromium™ controller platform. Barcoded bulk cDNA was sequenced in an Illumina platform. Unique Molecular Identifiers (UMIs) were used for sequencing deconvolution and clustering analysis, DEG analysis and lineage analysis. (B) t-SNE plot showing the clustering analysis for CD34 expressing HSPCs. FA and healthy CD34 expressing HSPCs were combined for clustering based on their gene expression profiles. A total of 13 clusters were identified spanning the different HSPC subpopulations. Identified clusters include a HSC-containing cluster (HSC-containing); clusters with megakaryocytic-erythroid identity include: EMP (Erythroid-megakaryocyte progenitor), MK (Megakaryocyte progenitor), MK/E (common megakaryocyte/erythroid cluster), E (erythroid progenitor) and BEM (basophil, eosinophil and mast cell progenitor); clusters with lympho-myeloid identity include LMPP (lymphoid-primed multipotential progenitor), B-prog (B-cells progenitor), N (neutrophil progenitor), DC (dendritic cell progenitor) and M (monocyte progenitor). Two clusters with distinctive gene expression profiles, one of them enriched in FA cells, were assigned as “unannotated” since they required further research for identity definition. (C) FA-derived CD34 expressing HSPCs (red dots) cluster together with healthy donors derived CD34 expressing HSPCs (blue dots). Two FA-specific sub-clusters are highlighted with circles. (D) Lineage trajectory analysis showing that HSPC differentiation follows a star-like path. HSCs (green) located in the center region of this star follow at least two main differentiation pathways, one characterized by lympho-myeloid commitment (shades of blue), and the other characterized by megakaryocytic-erythroid commitment (shades of red). The lympho-myeloid commitment includes B, M, DC and N progenitors; the megakaryocytic-erythroid commitment spans MK, E and BEM progenitors. (E) Projection of FA HSPCs in the lineage trajectory analysis showing that FA HSPCs follow the same differentiation star-like profile as healthy cells do. FA HSPCs (red dots), healthy HSPCs (blue dots). See also Supplementary Figure 1. Supplementary Table 1 describes the characteristics of heathy donors and FA patients whose bone marrow samples were used for the experiments described in panels A-E.
Figure 2.
Figure 2.. The MYC pathway is overexpressed in FA HSPCs.
(A) Single cell gene expression analysis of the different HSPCs clusters. (B) Single cell enrichment score analysis of the different HSPCs clusters. (C) Quantitative real-time RT-PCR for MYC expression in primary HSPCs from FA patients and healthy donors. The Supplemental Table 1 and Supplemental Table 2 describe the characteristics of healthy donors and FA patients whose bone marrow samples were used in this study. Complementation group of each patient with FA is indicated between parenthesis. UID: Unidentified pathogenic variant. (D) Real-time RT-PCR for expression of the MYC pathway genes in bulk population of FA HSPCs in comparison to HSPCs from healthy controls (see Supplementary Table 2 for the details about the samples). Data in (A) and (B) are represented as box plots. p-values of <0.001 were considered extremely significant (***, ****). See also Supplementary Figure 2.
Figure 3.
Figure 3.. HSPCs expressing two opposing functional cell states exist in the BM of patients with FA.
(A) “High-TP53” expressing HSPCs and “High-MYC” expressing HSPCs co-exist in the BM of patients with FA. The LogRatio of TP53 expression was divided by the LogRatio of MYC expression per cell, resulting in a gradient spanning from “High-TP53” expressing HSPCs to “High-MYC” expressing HSPCs. The expression of MYC and TP53 per cell is represented with a red or blue bar. (B) Flow cytometric analysis confirming the co-existence of MYC and p53 expressing CD34+ cells from FA patients. FACS plot for gating CD34+ cells is shown in left panel. FACS plot for MYC and p53 expression in CD34+ cells is shown in right panel. Two seemingly exclusive populations of FA CD34+ cells were detected, one with high MYC levels (shaded green box) and the other with high p53 levels (shaded pink box) in comparison to healthy cells. A third population (shaded in orange box) in samples from FA patients co-expresses medium-high levels of MYC and p53 in comparison to healthy CD34+ cells. Data are from pooled BM samples of two healthy controls and eight FA patients. (C) FACS plot (left panel) and quantitation (right panel) of DNA content showing high MYC expression in FA CD34+ cells during S and G2/M phases of the cell cycle. The data are from pooled healthy BM controls (n=2) and patients with FA (n=8). Data in (C) are represented as box plots. p-values of <0.001 were considered extremely significant (***, ****). See also Supplementary Figure 3.
Figure 4.
Figure 4.. (+)-JQ1 inhibits the growth of FA-deficient hematopoietic stem cells.
(A) WT and Fancd2−/− mice were injected daily with (+)-JQ1 (50 mg/kg) for 1 month or the inactive enantiomer (−)-JQ1 (50 mg/kg) as a negative control (n=3 mice per group) and BM was analyzed. (B) Flow cytometry plots for identification of LT-HSCs in wild-type (WT) and Fancd2−/− mice exposed to (−)-JQ1 or (+)-JQ1. LSK (Lin-Sca-1+c-Kit+) population was analyzed for CD150 and CD48 expression and LT-HSCs (LSK CD150+CD48−) were identified. (C) Quantitation of Myc expression by FACS analysis in LT-HSCs from wild-type (WT) and Fancd2−/− mice exposed to (−)-JQ1 or (+)-JQ1. (n=3 mice per group). (D) LT-HSC (Long-term HSC), MPP (multipotent progenitors), HPC (restricted hematopoietic progenitors) content in wild-type (WT) and Fancd2−/− mice exposed to (−)-JQ1 or (+)-JQ1 (n=3 mice per group). (E) DNA damage in LT-HSCs from wild-type (WT) and Fancd2−/− mice exposed to (−)-JQ1 or (+)-JQ1. DNA damage was measured by tail length in a comet assay (n=3 mice per group). Representative images of the alkaline comets (left panel) and quantitation of comet tail length (right panel) are shown. (F) CFU assay of FA-like CD34+ HSPCs, generated through infection with a shRNA lentivirus against FANCD2. FA-like HSPCs were cultured in triplicates in complete methylcellulose medium with or without (+)-JQ1 (50 nM) for 14 days and clonogenic growth was assessed. (G) CFU assay of HSPCs from bone marrow of healthy donors or FA patients. Healthy and FA BM derived Lin- cells (3000 cells for healthy BM and 5000 cells for FA BM) were plated in complete methycellulose with (+)-JQ1 (50 nM) or DMSO and CFU numbers were quantified after 14 days of culture. Note that the cells were plated at different time depending upon the availability of the samples. Data in (C) and (E) are represented as box plots. Data in (F) and (G) are represented as mean ± SEM. p-values of 0.01 to 0.05 were considered significant (*), p-values of 0.001 to 0.01 were considered very significant (**) and p-values of <0.001 were considered extremely significant (***, ****). See also Supplementary Figure 4.
Figure 5.
Figure 5.. MYC inhibition prevents entry into S phase and reduces replication associated stress in FA lymphoblastoid cells.
(A) Western blots of the lysates of FANCG-deficient human lymphoblastoid cells (EUFA316+EV) and FANCG-complemented lymphoblastoid cells (EUFA316+G). (B) Western blots of the lysates of EUFA316+EV cells exposed to the BET bromodomain inhibitor (+)-JQ1 for 48 h. (C) EUFA316+G and EUFA316+EV cells were treated for 24h with Mitomycin C (MMC) (20 ng/ml) and (+)-JQ1 (50 nM) and cell cycle distribution was analyzed. (D) (+)-JQ1 reduces the amount of new replication origins in the FANCG-deficient lymphoblastoid cells. EUFA316+G and EUFA316+EV cells were exposed to (+)-JQ1 for 8 h and then incubated with the nucleotide analogs IdU for 30 min followed by CldU for 30 min in presence of (+)-JQ1. DNA fiber assay was carried out and the percentage of fibers with replication origins were quantified per condition. (E) (+)-JQ1 slows-down replication fork speed in the FANCG-deficient lymphoblastoid cells. EUFA316+G and EUFA316+EV cells were treated as described in panel D. DNA fiber assays were performed and the fiber length composed by IdU tracts plus CldU tracts was measured and divided by the incubation time in the presence of the analogs. At least 100 fibers were analyzed per sample. (F) Western blots of the lysates of EUFA316+EV and EUFA316+G cells after treatment with hydroxyurea (HU) and (+)-JQ1 for 24 h. (G) Survival of the FANCG-deficient EUFA316+EV and EUFA316+G cells exposed to increased concentrations of MMC and (+)-JQ1 (50 nM) for 5 days. The experiment was performed three times and the data from a representative experiment are shown. Data in (C), (D) and (G) are represented as mean ± SEM. Data in (E) are represented as boxplots. p-values of 0.01 to 0.05 were considered significant (*), p-values of 0.001 to 0.01 were considered very significant (**) and p-values of <0.001 were considered extremely significant (***, ****). See also Supplementary Figure 5.
Figure 6.
Figure 6.. Physiological/inflammatory stress activates the MYC pathway in Fancd2−/− mice and causes BM failure.
(A) Wild-type (WT) and Fancd2−/− mice were injected with pI:pC (5 mg/kg) twice per week for 1 month and bone marrow was analyzed. (B) Flow cytometric plots (left panel) and the quantitation (right panel) for Myc expression in LT-HSCs of the bone marrow from wild-type or Fancd2−/− mice (n=3 mice per group) after pI:pC treatment as shown in panel A. (C) Wild-type (WT) and Fancd2−/− mice were treated with pI:pC (5 mg/kg) and (+)-JQ1 and 48 h after the treatment BM was analyzed. (−)-JQ1 was used as a negative control. (n=3 mice per group) (D) Wild-type or Fancd2−/− mice were treated with pI:pC and (+)-JQ1 as shown in panel C and peripheral blood was analyzed for cytokines. (E) Wild-type or Fancd2−/− mice were treated with pI:pC and (+)-JQ1 as shown in panel C and Myc expression in LSK cells from BM was analyzed using flow cytometry. (F) Cytokine levels in the BM plasma of FA patients and or healthy donors. FA n=19, Healthy n=9. (G) Representative flow cytometry plots for MYC staining (upper panels) and quantitation of MYC expression (lower panel) in BM CD34+ cells from healthy donors after in vitro culture for 24 h with IFNγ (20 ng/ml) and/or JQ1 (50 nM). (n= 4) (H) Representative flow cytometry plots for MYC staining (left panels) and quantitation of MYC expression (right panel) in cord blood CD34+ with CRISPR-mediated knockout of FANCA (FANCA-KO) after in vitro culture for 24 h with TNF-α and/or JQ1. Data in (B), (E) and (H) are represented as boxplots. Data in (G) are represented as mean ± SEM. p-values of 0.01 to 0.05 were considered significant (*), p-values of 0.001 to 0.01 were considered very significant (**) and p-values of <0.001 were considered extremely significant (***, ****). See also Supplementary Figure 6.
Figure 7.
Figure 7.. Physiological stress-induced MYC overexpression predisposes FA HSPCs to egress from the BM.
(A) High MYC expression significantly correlates with reduced expression of the HSPC adhesion molecule CXCR4. Gene expression profiles of “High-TP53” and “High-MYC” expressing HSPCs were compared and DEG were obtained. Heat map for the gene expression in High-TP53 and High-MYC expressing HSPCs is shown in the lower panel. Note that both cellular states have totally opposite gene expression profiles. “High-MYC” expressing cells downregulate several cell adhesion genes including CXCR4 and VIM. (B) Representative FACS plots (left panel) and quantitation (right panel) of the percentage of CD34+ cells in peripheral blood of healthy donors and FA patients. (C) Representative FACS plots (left panel) and quantitation (right panel) of Lin+ cells from the CD34+ cells of peripheral blood MNC, (i) Lin+ cell production in liquid myeloid promoting culture conditions, (ii) NK-cell (CD56+) production in MS-5 supporting stroma. (iii) B-cell (CD19+) production in MS-5 supporting stroma, (iv) T-cell (CD3+) production in OP9-DL4 supporting stroma. Note that the circulating CD34+ cells from FA patients show multilineage potential while the healthy counterpart shows preferential T-cell potential. (D) MYC expression in CD34+ cells from peripheral blood or bone marrow as analyzed by flow cytometry. n= 8 FA samples and 2 healthy samples. (E) CXCR4 expression in CD34+ cells from peripheral blood or bone marrow as analyzed by flow cytometry. n= 6 FA samples and 2 healthy samples. (F) Quantitation of LSK- cells (left panel) and CFU content (right panel) in peripheral blood (PB) of WT or Fancd2−/− mice after two weeks treatment with pI:pC. Representative images of the hematopoietic colonies are also shown. (G) Working model: MYC has a pro-survival role for the HPSC pool of patients with FA, driving the cells through S phase at the expense of DNA damage. Inflammatory episodes might hyperactivate the MYC pathway and precipitate bone marrow failure by increasing replicative stress and reducing adhesion of the HSPCs to their niche. In the FA context, MYC must be a counteracting force against the previously described growth suppressive activities of p53 and TGFβ pathways. The Supplemental Table 3 describes the characteristics of the FA patients whose bone marrow or peripheral blood samples were used in the experiments described in panels B-E.Data in (B), (D), (E) and (F) are represented as boxplots. Data in (C) are represented as mean ± SEM. p-values of 0.01 to 0.05 were considered significant (*), p-values of 0.001 to 0.01 were considered very significant (**) and p-values of <0.001 were considered extremely significant (***, ****). See also Supplementary Figure 7.

Comment in

References

    1. ADAMO A, COLLIS SJ, ADELMAN CA, SILVA N, HOREJSI Z, WARD JD, MARTINEZ-PEREZ E, BOULTON SJ & LA VOLPE A 2010. Preventing nonhomologous end joining suppresses DNA repair defects of Fanconi anemia. Mol Cell, 39, 25–35. - PubMed
    1. AGUDA BD, KIM Y, KIM HS, FRIEDMAN A & FINE HA 2011. Qualitative network modeling of the Myc-p53 control system of cell proliferation and differentiation. Biophys J, 101, 2082–91. - PMC - PubMed
    1. AIBAR S, GONZALEZ-BLAS CB, MOERMAN T, HUYNH-THU VA, IMRICHOVA H, HULSELMANS G, RAMBOW F, MARINE JC, GEURTS P, AERTS J, VAN DEN OORD J, ATAK ZK, WOUTERS J & AERTS S 2017. SCENIC: single-cell regulatory network inference and clustering. Nat Methods, 14, 1083–1086. - PMC - PubMed
    1. ALTER BP 2014. Fanconi anemia and the development of leukemia. Best Pract Res Clin Haematol, 27, 214–21. - PMC - PubMed
    1. BAHR C, VON PALESKE L, USLU VV, REMESEIRO S, TAKAYAMA N, NG SW, MURISON A, LANGENFELD K, PETRETICH M, SCOGNAMIGLIO R, ZEISBERGER P, BENK AS, AMIT I, ZANDSTRA PW, LUPIEN M, DICK JE, TRUMPP A & SPITZ F 2018. A Myc enhancer cluster regulates normal and leukaemic haematopoietic stem cell hierarchies. Nature, 553, 515–520. - PubMed

Publication types

Substances