. 2020 Oct 15;183(2):522-536.e19.
doi: 10.1016/j.cell.2020.09.011. Epub 2020 Sep 29.

A Thalamic Orphan Receptor Drives Variability in Short-Term Memory

Affiliations

A Thalamic Orphan Receptor Drives Variability in Short-Term Memory

Kuangfu Hsiao et al. Cell. .

Abstract

Working memory is a form of short-term memory that involves maintaining and updating task-relevant information toward goal-directed pursuits. Classical models posit persistent activity in prefrontal cortex (PFC) as a primary neural correlate, but emerging views suggest additional mechanisms may exist. We screened ∼200 genetically diverse mice on a working memory task and identified a genetic locus on chromosome 5 that contributes to a substantial proportion (17%) of the phenotypic variance. Within the locus, we identified a gene encoding an orphan G-protein-coupled receptor, Gpr12, which is sufficient to drive substantial and bidirectional changes in working memory. Molecular, cellular, and imaging studies revealed that Gpr12 enables high thalamus-PFC synchrony to support memory maintenance and choice accuracy. These findings identify an orphan receptor as a potent modifier of short-term memory and supplement classical PFC-based models with an emerging thalamus-centric framework for the mechanistic understanding of working memory.

Keywords: GPCR; RNA; genetic Variation/genetics; genome/genetics; memory/physiology; messenger/analysis; mice; neural pathways/physiology; outbred; prefrontal cortex/physiology; quantitative trait loci/genetics; thalamus/cytology; thalamus/physiology; transcriptome/genetics.


Conflict of interest statement

Declaration of Interests The authors declare no competing interests.

Figures

Figure 1.
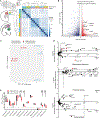
Figure 1.. Identification of a Quantitative Trait Locus (QTL) Linked to Working Memory
(A) Outbreeding scheme to generate the DO and CC mice. (B) Working memory performance of DO mice (n = 193) compared with C57BL/6J mice (n = 35) aggregated throughout the study. Mean, quartiles, minimum, and maximum are indicated. High- (red) and low- (blue) quartile-performing mice were selected for RNA-seq (in Figure 3). (C–F) Correlations between spontaneous alternation performance and number of arm entries (C), latency to first arm entry (D), stereotypic movement (E), and contextual memory retrieval in fear conditioning (F). No significant Pearson’s correlations. High- (red) and low- (blue) quartile performers from (B). (G) Example haplotype reconstruction for one DO mouse demonstrating genetic mosaicism of parental lines and substantial allelic heterozygosity. (H) QTL analysis (by miQTL) for spontaneous alternation. Significance thresholds after 1,000x permutations of genotype, blue: 90%, red: 95%. (I) Mapping analyses performed using both R/qtl2 (black) and miQTL (red) revealing minimal fluctuation in LOD score across imputations (overlapping bands). See also Figure S1.
Figure 2.
Figure 2.. Smart1 Locus Confers Performance Variation in Working Memory
(A) Effect of each founder allele on spontaneous alternation performance along chromosome 5 (Chr 5) (x axis), as measured by the founder coefficients from the linkage model (y axis). Coefficients diverge substantially at the peak QTL. LOD score at each chromosomal position shown. (B) Heatmap where each dashed line depicts an individual mouse, with row indicating founder haplotype allele contribution at Chr 5 locus, and column indicating boxcox transformed performance score on spontaneous alternation. (C) Similar to (B) but displaying haplotype representation at the Chr 5 locus and corresponding Z scored phenotypes, quantified as mean ± SEM. (D) Overview of the breeding scheme to create CC mouse strains. (E) CC mice bearing CAST diplotype at Smart1 locus (CC046 and CC012) were compared respectively with mice bearing B6 diplotype at the same locus (CC004 and C57BL/6J) in spontaneous alternation. p < 0.05, unpaired t test with Welch’s correction. (F) Schematic illustration of DNMP. Performance (% correct) shown for CC012 (n = 7) versus C57 (n = 8) during training (10 trials/day). No significant differences, two-way ANOVA with repeated measures. (G) % correct by CC012 (n = 7 mice) and C57 mice (n = 8) for variable delays (10 trials/day). Data are mean ± SEM. *p(20 s) = 0.027, **p(30 s) = 0.002, two-way ANOVA with repeated measures followed by Bonferroni’s test. See also Figure S1.
Figure 3.
Figure 3.. Distinct Patterns of Thalamic Gene Expression Distinguish Performance
(A) Left: schematic of dissected brain regions for RNA-seq. Right: heatmap of hierarchical clustering by Euclidean distance among gene expression profiles in DO high (n = 3) and low performers (n = 3) as highlighted in Figure 1B and from three brain regions per mouse: PFC, mediodorsal thalamus, and HPC. Clustering is visible by brain region and performance. (B) Volcano plots showing the significance and p value distribution after differential gene expression analysis in mediodorsal thalamus using DESeq2. n = 6, biologically independent samples. Black dots highlight calcium channels with expression in thalamus. (C) Principal component analysis of performance-divided mediodorsal thalamus gene expression in two distinct groups (red, high performers; blue, low performers). (D) Volcano plots displaying differential expression of all genes within Smart1 (black dots) between high and low performers. Dashed vertical lines indicate significance threshold (adjusted p < 0.01) and dashed horizontal lines indicate threshold for differential expression (log2FC > 0.5 or < −0.5). Red dots indicate genes that cross significance and differential expression thresholds and have a DESeq2-normalized read-count >1000. (E) Differential expression of four chosen genes (red dots in D) by qPCR (n = 6 ea.). *p < 0.05, **p < 0.01, by paired t test with Welch’s correction. See also Figure S2.
Figure 4.
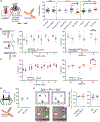
Figure 4.. Thalamic Orphan Receptor Gpr12 Promotes Working Memory
(A) Left: schematic of AAV used and brain regions tested. Right: effects on behavior in spontaneous alternation. Initially n = 10 per group, but some groups diminished because of animal death or absence of viral targeting. The Gpr12 group is a mix of two independent cohorts where each cohort achieved significance independently. Data are mean ± SEM. **p < 0.01 by one-way ANOVA, ***p < 0.001, by unpaired t test with Welch’s correction. (B) Left: % correct during training (10 trials/day) in CC012 mice with knockdown (n = 8) or scrambled control (n = 7) in thalamus. No significant differences by two-way ANOVA with repeated measures. Right: % correct during testing at variable delays (10 trials/day). *p < 0.05, **p < 0.01, two-way ANOVA with repeated measures followed by Bonferroni’s test. (C) Left: % correct during training (10 trials/day) in C57 mice with overexpression of Gpr12 in thalamus (n = 10 grouped over two cohorts) or mCherry alone (n = 8 grouped over two cohorts). Right: half mice from both cohorts received 6 days of training. % correct during testing at variable delays (10 trials/day). Data are mean ± SEM. *p(20 s) = 0.015, ***p(30 s) < 0.001, two-way ANOVA with repeated measures followed by Bonferroni’s test. (D) AAV-based overexpression of Gpr12 in HPC showed no significant differences. n = 11. Data are mean ± SEM p = 0.8724 by t test. (E) Left top: diagram of Object Place Memory task. Left bottom: example traces from one mouse in each cohort in the presence of novel (N) and familiar (F) objects. Right: no significant differences in long-term spatial memory between mCherry (7 mice, 13 trials) and mdTH-Gpr12 (7 mice, 14 trials), p = 0.7749 Unpaired t test; neither between C57(B6) (6 mice, 12 trials) and CC012 (6 mice, 12 trials), p = 0.7705 Unpaired t test. See also Figures S3 and S4.
Figure 5.
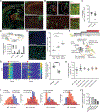
Figure 5.. Gpr12 Expresses in Thalamocortical Neurons and Facilitates Calcium Responses
(A) Immuo-histochemistry with anti-Gpr12 (green) and anti-parvalbumin (red) antibodies showing endogenous Gpr12 distribution. Images were collected with ×10 objective and tiled together to generate high-resolution images of brain sections. The acquired images were processed using the NIS-Elements (Nikon). dt, dorsal thalamus; vt, ventral thalamus; ca2, hippocampus; L2/3 and 5, Cortex. Left scale: 1 mm; Right scale: 500 μm. (B) In situ hybridization of Gpr12 mRNA (left), control probes for GFP mRNA (right top) and d2GPF mRNA (right bottom) in thalamus (red), and overlay with retrograde virus from mPFC (rgAAV-GFP) (green). Arrowheads point to significant overlay. Images were collected with ×10 or ×40 objectives and tiled together to generate high-resolution images of brain sections. The acquired images were processed using the Zen (Zeiss). Scale bars left: 500 μm (top), 100 μm (bottom); right: 50 μm. (C) Fraction of GFP+ neurons (green) that are Gpr12+ (red). n = 4 slices in first experiment, n = 5 slices in second experiment. Data are mean ± SEM. (D) Top: schematic of neural differentiation of HT-22. Bottom: increased expression of neuronal genes after differentiation. Data are mean ± S.E.M, n = 4 experiments. (E) Left: Vector only control transfection and Gpr12 overexpression using a CMV promoter in HT22 cells; scale bar: 250 mm. Right: glutamate-induced calcium events during 2 min bath application of glutamic acid (10 mM) in cells with vector only, hSyn-driven Gpr12, and CMV-driven Gpr12. Data are mean ± SD, n = 50–80 cells. ***p < 0.001, ****p < 0.0001, t test. (F) Schematic and timeline of experiment performed. (G) Heatmap of Z scored calcium events before and after bath application of 10 mM glutamic acid (red triangle), in wild-type and Gpr12 knockout cells. Data are mean ± SEM, n = 4 experiments, unpaired t test, **p = 0.0012. (H) Quantifications of spontaneous calcium events in a 15 s window after 5 min bath application of T-type or L-type VGCC block (n = 4) or vehicle control (DMSO, 1000x dilution, n = 5). Data are mean ± SEM. No significant differences, unpaired t test. (I) Frequency of glutamic-acid-induced calcium responses during bath application of blockers or vehicle in neurons derived from wild-type or Gpr12 knockout HT22. (J) Quantification of each VGCC blockade in (I). Gpr12-dependent effect is represented by (WTblocker / WTvehicle) over (KOblocker / KOvehicle). See also Figure S4.
Figure 6.
Figure 6.. Smart1CAST Display High Thalamocortical Synchrony during Memory Maintenance Predictive of Performance
(A) Schematic of three-region fiber photometry. Top: coronal slices depicting fiber placements and corresponding viral constructs targeted to each region. Bottom: simultaneous 470 nm and 405 nm recordings of each region in C57 or CC012 strains. (B) DNMP performance from two independent experiments: CC012 v B6, n = 7 ea., **p(30 s) = 0.008; Gpr12 v RFP, n = 8 ea., ***p(30 s) < 0.001, two-way ANOVA with repeated measures followed by Bonferroni’s test. (C) Example GCaMP6f traces from three brain regions aligned to one trial of DNMP. (D) Endogenous Gpr12 transcript levels in mdTH, HPC, PFC by qPCR, normalized to γTub and shown as mean ± SEM, *p < 0.05, **p < 0.005, t test. (E) Top: average activity (area under Z scored responses) in home cage (CC012 versus C57, n = 8 ea., 1 min recording). Bottom: pairwise Pearson’s correlations during 1 min home cage recording. No significant differences, two-way ANOVA followed by Sidak’s test. Data are mean ± SEM. (F) Pairwise Pearson’s correlations during each task phase for C57 and CC012 (n = 7 ea). Individual trials shown in Figure S6C at 10 trials/mouse. Individual mice shown, including mean ± SEM. *p < 0.05, **p < 0.01, ***p < 0.001 by two-way ANOVA with repeated measures and Sidak’s multiple comparisons. (G) Pairwise Pearson’s correlations during each task phase for mdTH-Gpr12 overexpression (Gpr12OE) and RFP (RFP) control injection (n = 8 ea). Individual trials shown in Figure S6F at 10 trials/mouse. Individual mice shown, including mean ± SEM. *p < 0.05, **p < 0.01, ***p < 0.001 by two-way ANOVA with repeated measures and Sidak’s multiple comparisons test. (H) The combined correlations of encoding and delay phases were separated by correct and incorrect trials. n = 16 mice, 10 trials per mouse, p < 0.001, Welch’s t test. (I) Averaged Z scored PFC GCaMP6f activity on correct and incorrect trials. Individual data points show, including mean. ****p(C’D) < 0.0001, Sidak’s multiple comparisons. (J) Suggested model of working memory consistent with the data: brief bouts of persistent activity, in thalamocortical neurons, interleaved with periods of short-term plasticity. See also Figures S5 and S6.

Comment in

References

    1. Akrami A, Kopec CD, Diamond ME, and Brody CD (2018). Posterior parietal cortex represents sensory history and mediates its effects on behaviour. Nature 554, 368–372. - PubMed
    1. Arnsten AF, and Jin LE (2014). Molecular influences on working memory circuits in dorsolateral prefrontal cortex. Prog. Mol. Biol. Transl. Sci 122, 211–231. - PubMed
    1. Baddeley A (2003). Working memory: looking back and looking forward. Nat. Rev. Neurosci 4, 829–839. - PubMed
    1. Baddeley A (2012). Working memory: theories, models, and controversies. Annu. Rev. Psychol 63, 1–29. - PubMed
    1. Baddeley AD, and Hitch G (1974). Working Memory. Psychology of Learning & Motivation 8, 47–89.

Publication types

Substances