. 2020 Sep 29;32(13):108189.
doi: 10.1016/j.celrep.2020.108189.

Single-Nucleus RNA-Seq Is Not Suitable for Detection of Microglial Activation Genes in Humans

Affiliations

Single-Nucleus RNA-Seq Is Not Suitable for Detection of Microglial Activation Genes in Humans

Nicola Thrupp et al. Cell Rep. .

Abstract

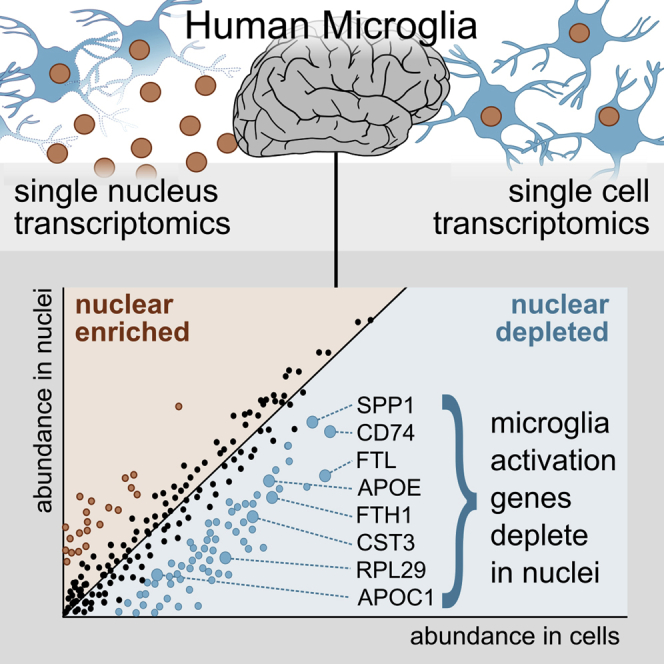
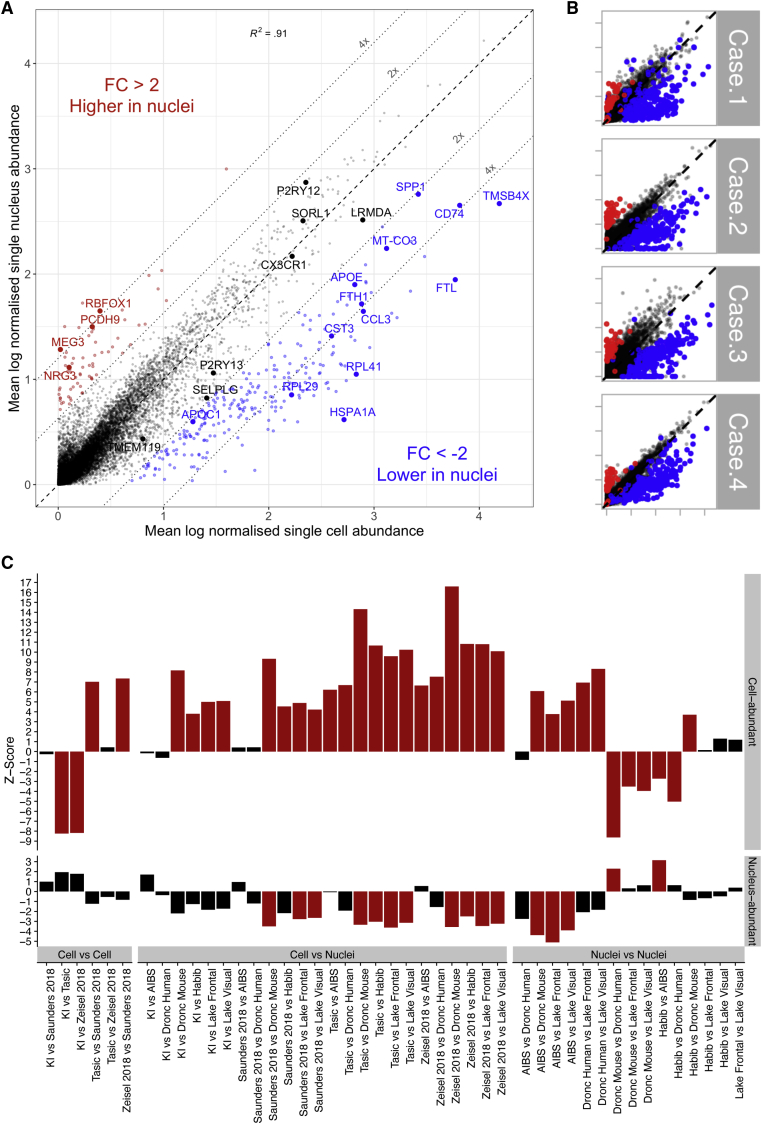
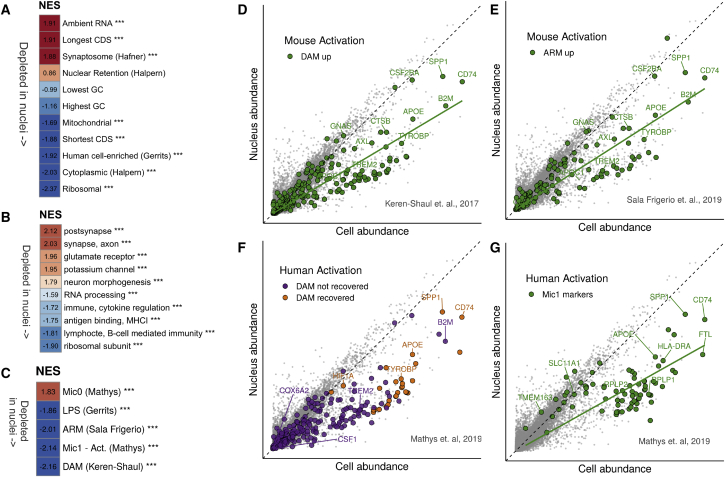
Single-nucleus RNA sequencing (snRNA-seq) is used as an alternative to single-cell RNA-seq, as it allows transcriptomic profiling of frozen tissue. However, it is unclear whether snRNA-seq is able to detect cellular state in human tissue. Indeed, snRNA-seq analyses of human brain samples have failed to detect a consistent microglial activation signature in Alzheimer's disease. Our comparison of microglia from single cells and single nuclei of four human subjects reveals that, although most genes show similar relative abundances in cells and nuclei, a small population of genes (∼1%) is depleted in nuclei compared to whole cells. This population is enriched for genes previously implicated in microglial activation, including APOE, CST3, SPP1, and CD74, comprising 18% of previously identified microglial-disease-associated genes. Given the low sensitivity of snRNA-seq to detect many activation genes, we conclude that snRNA-seq is not suited for detecting cellular activation in microglia in human disease.

Keywords: ARM; Alzheimer’s disease; activation; microglia; microglial activation; single-cell RNA-seq; single-nucleus RNA-seq.


Conflict of interest statement

Declaration of Interests P.M.M. has been reimbursed for service on a Scientific Advisory Board to Ipsen Pharmaceuticals. He has received consultancy fees from Roche, Adelphi Communications, Celgene, Neurodiem, and Medscape. He has received honoraria or speakers’ fees from Novartis and Biogen and has received research or educational funds from Biogen, Novartis, and GlaxoSmithKline.

Figures

None
Graphical abstract
Figure 1
Figure 1
Gene Abundance in Single Microglial Cells versus Single Microglial Nuclei of Human Cortical Tissue (A) Mean normalized gene abundance in cells (x axis) and nuclei (y axis). A total of 3,721 nuclei and 14,435 cells were extracted from the cortical tissue of 4 human patients. Red, genes with significantly higher abundance in nuclei (padj < 0.05, fold change > 2); blue, genes that are significantly less abundance in nuclei (padj < 0.05, fold change < −2). Genes were normalized to read depth (per cell), scaled by 10,000, and log-transformed using the natural log. MALAT1 (which had normalized abundance levels of 6.0 and 6.9, respectively, in cells and nuclei) has been removed for visualization purposes. The black dashed line represents no fold change; the gray dotted lines represent 2- and 4-fold differences between cells and nuclei. FC, fold change; R2, correlation coefficient. Full results are available in Table S1. (B) Scatterplot as in (A), per patient (with the same genes highlighted). (C) Each bar represents a comparison between two datasets (X versus Y), with the bootstrapped Z scores representing the extent to which cell-enriched genes (top panel) and nuclear-enriched genes (bottom panel) have lower specificity for microglia in dataset Y relative to that in dataset X. Larger Z scores indicate greater depletion of genes, and red bars indicate a statistically significant depletion (padj < 0.05, by bootstrapping). KI, Karolinska Institutet; AIBS, Allen Institute for Brain Science. See also Figure S1 and S2A and Table S1.
Figure 2
Figure 2
Functional Analysis of Genes That Are Enriched or Depleted in Nuclei (A) Gene set enrichment analysis (GSEA) of gene sets related to cellular location and gene coding sequence (CDS) length. Background genes were ranked according to log fold change of nuclei (3,721 nuclei) versus cells (14,435 cells). Red, higher normalized enrichment score (NES), i.e., more genes associated with nuclear enrichment; blue, negative NES scores (depletion in nuclei). ∗∗∗ represents significance (padj < 0.0005). GC, GC content. (B) GSEA of super-Gene Ontology gene sets against ranked nucleus-cell log fold changes. Only top and bottom categories (according to NES) are shown. Colors as in (A). MHCI, major histocompatibility complex class I. (C) GSEA of selected gene sets from previous studies of microglial activation, against log fold change as in (A). ∗∗∗ represents significance (padj < 0.0005). Mic0, markers of microglial cluster 0 in human brain tissue; Mic1, markers of microglial cluster 1 (activation response to plaques) defined by Mathys et al., 2019 in human brain tissue. ARM, activation response microglia (Sala Frigerio et al., 2019); DAM, disease-associated microglia (Keren-Shaul et al., 2017); LPS, lipopolysaccharide (Gerrits et al., 2019). (D) Scatterplot as in Figure 1A, highlighting in green the DAM genes. A regression line for the highlighted genes is shown in green (slope = 0.60). (E) Scatterplot as in (D), highlighting in green the ARM genes. A regression line for the highlighted genes is shown in green (slope = 0.64). (F) Scatterplot as in (D), highlighting the DAM genes recovered in the study of human activation in AD (Mathys et al., 2019). Purple, DAM genes not recovered in their study; orange, DAM genes recovered in their study. (G) Scatterplot as in (D); green, human activation marker genes defined by Mathys et al. (2019). Gene sets, results of GO clustering, and results of GSEA analysis are available in Table S1. See also Figures S2B–S2G.

References

    1. Bahar Halpern K., Caspi I., Lemze D., Levy M., Landen S., Elinav E., Ulitsky I., Itzkovitz S. Nuclear Retention of mRNA in Mammalian Tissues. Cell Rep. 2015;13:2653–2662. - PMC - PubMed
    1. Bakken T.E., Hodge R.D., Miller J.A., Yao Z., Nguyen T.N., Aevermann B., Barkan E., Bertagnolli D., Casper T., Dee N. Single-nucleus and single-cell transcriptomes compared in matched cortical cell types. PLoS One. 2018;13:e0209648. - PMC - PubMed
    1. Butler A., Hoffman P., Smibert P., Papalexi E., Satija R. Integrating single-cell transcriptomic data across different conditions, technologies, and species. Nat. Biotechnol. 2018;36:411–420. - PMC - PubMed
    1. Chen W.-T., Lu A., Craessaerts K., Pavie B., Sala Frigerio C., Corthout N., Qian X., Laláková J., Kühnemund M., Voytyuk I. Spatial Transcriptomics and In Situ Sequencing to Study Alzheimer’s Disease. Cell. 2020;182:976–991.e19. - PubMed
    1. Del-Aguila J.L., Li Z., Dube U., Mihindukulasuriya K.A., Budde J.P., Fernandez M.V., Ibanez L., Bradley J., Wang F., Bergmann K. A single-nuclei RNA sequencing study of Mendelian and sporadic AD in the human brain. Alzheimers Res. Ther. 2019;11:71. - PMC - PubMed

Publication types

MeSH terms