. 2020 Sep 28;9(10):929.
doi: 10.3390/antiox9100929.

Microvesicle Formation Induced by Oxidative Stress in Human Erythrocytes

Affiliations

Microvesicle Formation Induced by Oxidative Stress in Human Erythrocytes

Julia Sudnitsyna et al. Antioxidants (Basel). .

Abstract

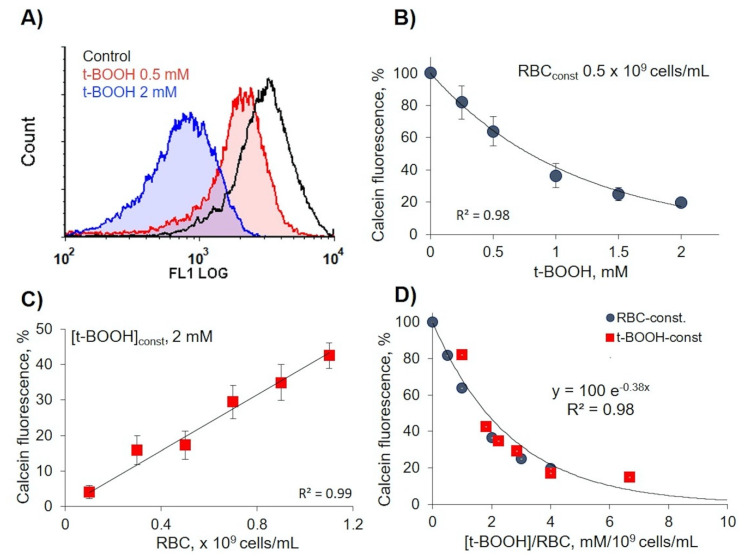
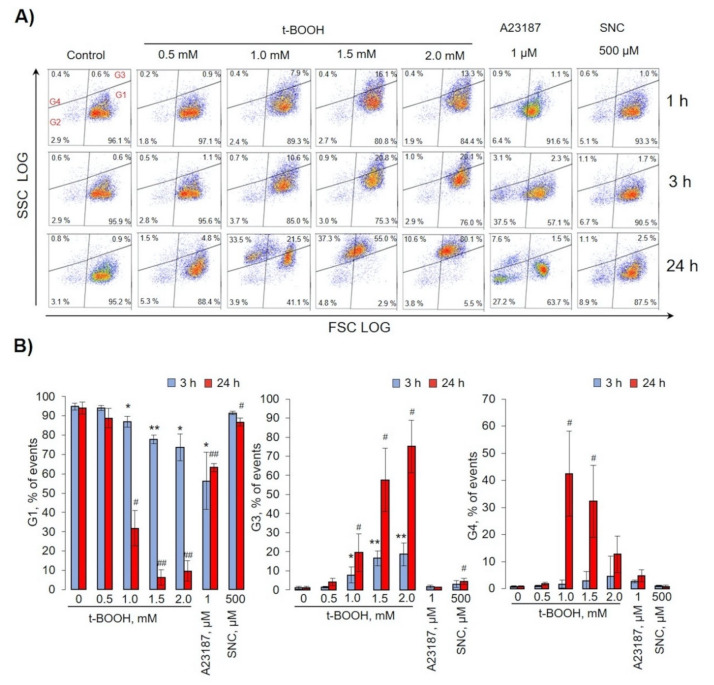
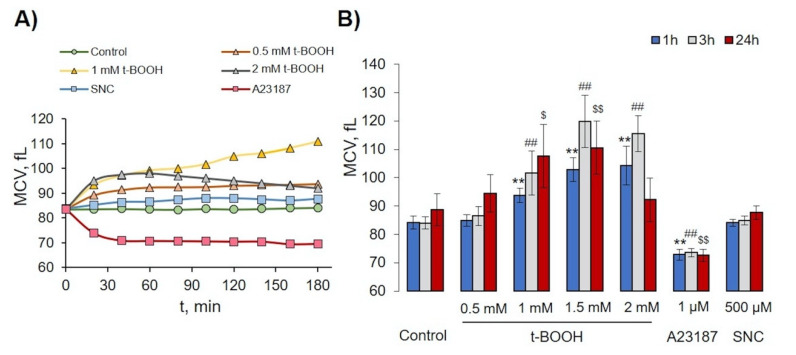
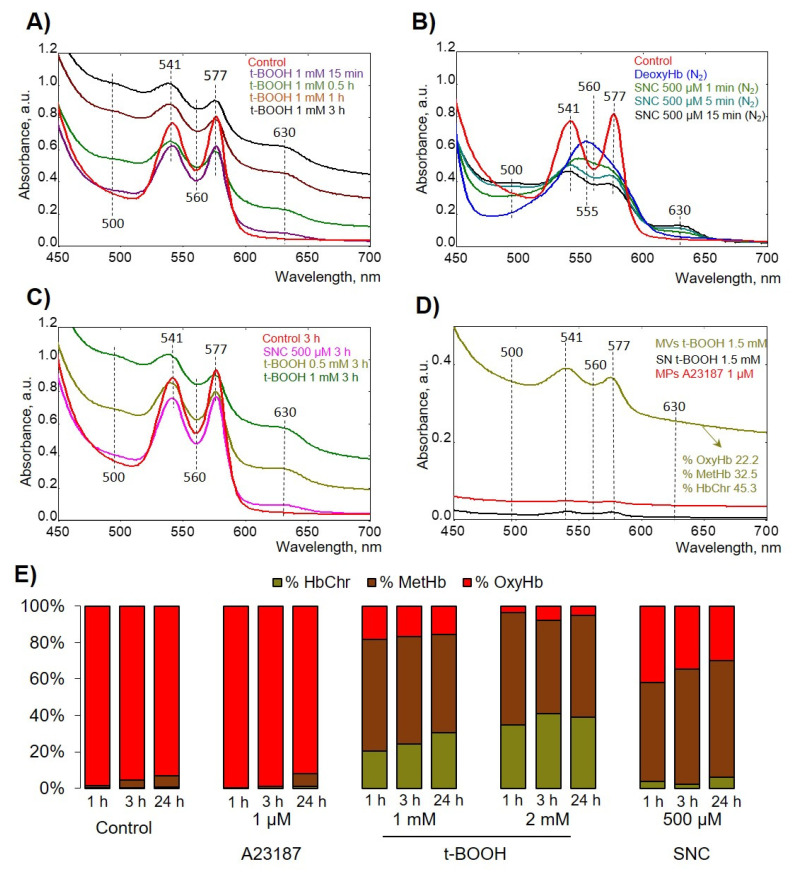
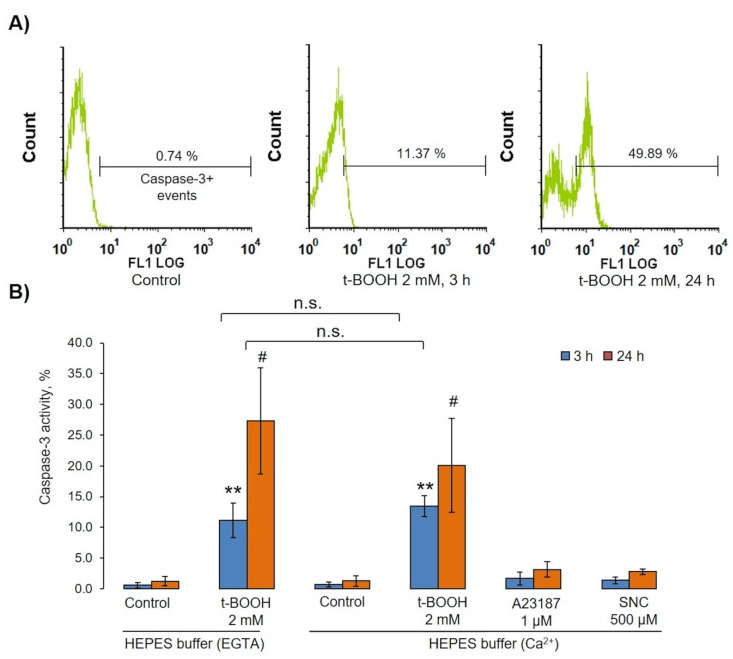
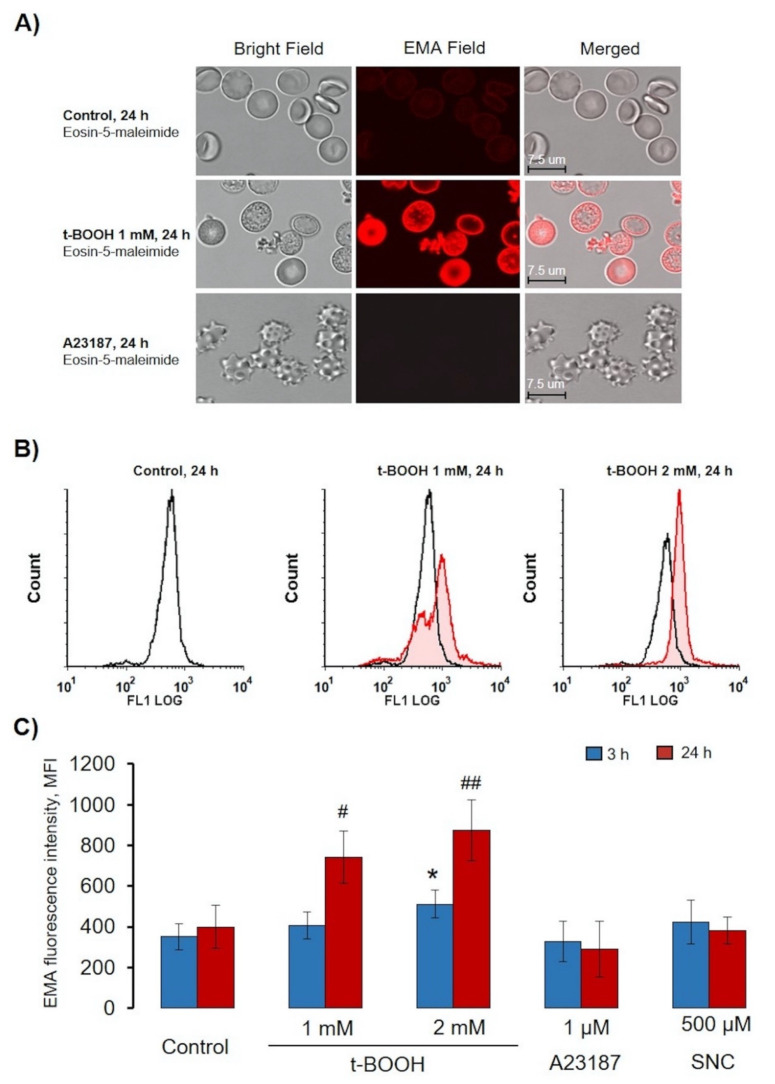
Extracellular vesicles (EVs) released by different cell types play an important role in many physiological and pathophysiological processes. In physiological conditions, red blood cell (RBC)-derived EVs compose 4-8% of all circulating EVs, and oxidative stress (OS) as a consequence of different pathophysiological conditions significantly increases the amount of circulated RBC-derived EVs. However, the mechanisms of EV formation are not yet fully defined. To analyze OS-induced EV formation and RBC transformations, we used flow cytometry to evaluate cell esterase activity, caspase-3 activity, and band 3 clustering. Band 3 clustering was additionally analyzed by confocal microscopy. Two original laser diffraction-based approaches were used for the analysis of cell deformability and band 3 activity. Hemoglobin species were characterized spectrophotometrically. We showed that cell viability in tert-Butyl hydroperoxide-induced OS directly correlated with oxidant concentration to cell count ratio, and that RBC-derived EVs contained hemoglobin oxidized to hemichrome (HbChr). OS induced caspase-3 activation and band 3 clustering in cells and EVs. Importantly, we showed that OS-induced EV formation is independent of calcium. The presented data indicated that during OS, RBCs eliminated HbChr by vesiculation in order to sacrifice the cell itself, thereby prolonging lifespan and delaying the untimely clearance of in all other respects healthy RBCs.

Keywords: band 3; calcium ionophore A23187; erythrocytes; microparticles; nitric oxide donor; oxidative stress; tert-Bytyl hydroperoxide t-BOOH; vesiculation.


Conflict of interest statement

The authors declare no conflict of interest. The funders had no role in the design of the study; in the collection, analyses, or interpretation of data; in the writing of the manuscript; or in the decision to publish the results.

Figures

Figure 1
Figure 1
Calcein fluorescence intensity strongly depended on oxidant to cell count ratio. Red blood cell (RBC) suspension was incubated with tert-Butyl hydroperoxide (t-BOOH) at indicated concentrations for 1 h, then RBCs were stained with calcein-AM (5 µM, 40 min) and analyzed for calcein fluorescence intensity by flow cytometry at FL1 (logarithmic scale). (A) Representative histograms from five independent experiments. (B) Dependence of calcein fluorescence intensity in constant RBC count from t-BOOH concentrations. (C) Dependence of calcein fluorescence intensity in constant t-BOOH concentration from RBC count. (D) Exponential dependency between calcein fluorescence intensity and the ratio of oxidant concentration/cell count ([t-BOOH]/RBC). Data in (B,C) are presented as means ± SD, n = 5.
Figure 2
Figure 2
Oxidative stress induced by t-BOOH-triggered RBC transformations and microvesicle formation. RBCs (0.5 × 10⁹ cells/mL) were incubated at indicated concentrations of t-BOOH, A23187, and S-nitroso-L-cysteine (SNC) at the indicated times. Gate 1 represents control RBCs, gate 2—microparticles (MPs), gate 3—transformed RBCs, and gate 4—microvesicles (MVs). (A) Representative dot plots out of six independent experiments. (B) Quantification of presented data expressed as mean ± SD, n = 6. One-way ANOVA, Tamhane T2 (G1, G2 24 h, G4), or Tukey HSD post hoc (G2 3 h) were used where appropriate. * p < 0.05, ** p < 0.001 compared to control (t-BOOH 0mM, 3 h); # p < 0.05, ## p < 0.001 compared to control (t-BOOH 0mM, 24 h).
Figure 3
Figure 3
Effects of t-BOOH, A23187, and SNC on RBC volume changes. RBCs (0.5 × 10⁹ cells/mL) were incubated with indicated concentration of t-BOOH, A23187, and SNC for indicated times and were analyzed by hematological analyzer. (A) Representative histogram of mean cell volume (MCV) changes for one donor for 3 h; symbols indicate time of analysis. (B) Quantitative data from 10 independent experiments (10 donors). Data are presented as mean ± SD (n = 10), one-way ANOVA, Levene’s test < 0.05, and Tamhane T2 post hoc. ** p < 0.001 compared to 1h control; ##, p < 0.001 compared to 3 h control; $, p < 0.05, $$, p < 0.001 compared to 24 h control.
Figure 4
Figure 4
t-BOOH induced hemichrome (HbChr) formation. Spectral scans from 450 to 700 nm captured the different oxidation states of hemoglobin (Hb) identified by characteristic peaks in the visible region. (A) Representative spectra of free Hb oxidation by 1mM t-BOOH (ferric, 500 and 630 nm; ferryl/HbChr, 545 nm, 576 nm, and a flattened region between 600 and 700 nm) in comparison with intact Hb spectra (ferrous, 541 and 576 nm) in HEPES-buffer at 25 °C in kinetics. (B) Representative spectra of free Hb oxidation by 500 µM SNC in deoxygenated by N2 HEPES buffer at 25 °C in kinetics. Free oxyHb was deoxygenated by N2 and then SNC was added for the indicated time. (C) Spectra of Hb from hypoosmotically lysed RBCs after 3 h treatment with indicated compounds at indicated concentrations. (D) After 24 h of RBC incubation with indicated compounds, we collected the MVs and MPs, as described in the Materials and Methods section, and then MVs/MPs and supernatant (SN) from the last washing step were analyzed. (E) Representative bar chart of Hb species calculated from one donor.
Figure 5
Figure 5
Oxidative stress (OS)-induced decrease in osmotic fragility of RBCs. RBCs (0.5 × 10⁹ cells/mL) were incubated with the indicated substances for 1h, and then aliquots (10 µL, 106 cells/mL final concentration) of samples were resuspended in HEPES buffer with EGTA to register light scattering intensity corresponding to control. Then, the osmolality was gradually reduced by H2O supplementation, from 300 to 70 mOsm/kg H2O, to maintain the RBC concentration, and the corresponding number of cells was added at each step of H2O supplementation. (A) Representative osmotic hemolysis curves from the osmotic fragility test (OFT). (B) Quantification of percentage of hemolysis from osmotic fragility test calculated from six independent experiments. (C) Quantification of MCV during osmotic fragility test calculated from six independent experiments.
Figure 6
Figure 6
OS dose-dependently decreased RBCs’ deformability and inhibited band 3 function. Representative hemolysis curves of ammonium stress test one of eight experiments. RBCs (0.5 × 10⁹ cells/mL) were incubated with the indicated compounds for 1 h, and then aliquots (10 µL, 106 cells/mL final concentration) of samples were resuspended in HEPES buffer to register light scattering intensity corresponding to control. Then aliquots (10 µL, 106 cells/mL final concentration) of samples were resuspended in NH4+ buffer for ammonium stress test. Arrows indicate the start of the ammonium stress test. Quantitation of these data is presented in Table 3.
Figure 7
Figure 7
OS-induced RBC transformation and MV formation were calcium-independent. RBCs (0.5 × 10⁹ cells/mL) were incubated with the indicated concentration of t-BOOH in HEPES buffer containing 2 mM calcium, or 2 mM EGTA, for indicated times and were analyzed by flow cytometry. (A) Representative SSC/FSC dot plots of one out of six independent experiments for 24 h. Template and gating correspond to Section 3.2. (BD) Calculation of events distributed in the corresponding gates. Data are presented as mean ± SD (n = 7), paired t-test; n.s., not significant.
Figure 8
Figure 8
OS-induced annexin-V binding was calcium-independent. RBCs (0.5 × 10⁹ cells/mL) were incubated with indicated concentrations of t-BOOH, A23187, and SNC in HEPES buffer containing 2 mM Ca2+ or 2 mM EGTA for indicated times. Annexin-V (0.1 µg/mL, 15 min, 25 °C) was added to treated cells and analyzed by flow cytometry. (A) Representative annexin V/FSC dot plots of one out of six independent experiments for 24 h. Gate G1 corresponds to control cells; G2 to annexin-V-negative EVs; G3 to annexin-V-positive cells; G4, annexin-V-positive EVs. (B,C) Calculation of annexin-V-positive events in G3 and G4. Data in (BD) are presented as the mean ± SD, in (B)—paired t-test; ** p < 0.001, compared to 3h in HEPES buffer with Ca2+; ## p < 0.001, compared to 3 h in HEPES buffer with EGTA; n.s.—not significant. In (C)—one-way ANOVA, Levene’s test < 0.05, Tamhane’s T2 post hoc; * p < 0.05, ** p < 0.001, compared to 3 h control; # p < 0.05, ## p < 0.001, compared to 24 h control.
Figure 9
Figure 9
t-BOOH-induced OS activated caspase 3 in RBCs. RBCs (0.5 × 10⁹ cells/mL) were incubated with indicated concentrations of t-BOOH, A23187, and SNC in HEPES buffer containing 2 mM calcium or 2 mM EGTA for indicated times. After we incubated them with indicated compounds, cells were fixed by 1% (final concentration) of methanol-free formaldehyde, permeabilized by 0.5% Tween for 20 min, and then anti-active caspase-3 antibodies were added for 30 min, with caspase-3 activation being measured by flow cytometry according to the manufacturer’s instructions. (A) Original histograms from one of seven independent experiments. (B) Data quantification based on seven independent experiments. Data are presented as the mean ± SD (n = 7), one-way ANOVA (HEPES buffer with EGTA both 3 h and 24 h), Tukey HSD post hoc (HEPES buffer with Ca2+ 3 h), Tamhane T2 post hoc (HEPES buffer with Ca2+ 24 h); paired t-test HEPES buffer (EGTA) and HEPES buffer (Ca2+), ** p < 0.001 compared to corresponding control, # p < 0.05 compared to corresponding control, n.s.— not significant.
Figure 10
Figure 10
t-BOOH-induced oxidative stress led to band 3 clustering and MV formation. RBCs (0.5 × 10⁹ cells/mL) were incubated as indicated with t-BOOH, A23187, and SNC at the indicated times, followed by EMA staining (0.07 mM, 40 min). (A) Representative confocal images of t-BOOH transformed RBCs. RBCs were processed for confocal microscopic analysis as described in the Materials and Methods section (Section 2.2.7). (B) Original histograms of EMA fluorescence intensity after 24 h t-BOOH treatment. (C) Quantification of flow cytometry data. Data are presented as mean ± SD (n = 7), one-way ANOVA, Levene’s test > 0.05, Tukey HSD post hoc (3 h) was used, * p < 0.05, compared to 3 h control; Levene’s test < 0.05, Tamhane T2 post hoc (24 h) was used, # p < 0.05, ## p < 0.001 compared to 24 h control.

Similar articles

Cited by

References

    1. Rosa-Fernandes L., Rocha V.B., Carregari V.C., Urbani A., Palmisano G.A. Perspective on Extracellular Vesicles Proteomics. Front. Chem. 2017;5:102. doi: 10.3389/fchem.2017.00102. - DOI - PMC - PubMed
    1. Alexandru N., Costa A., Constantin A., Cochior D., Georgescu A. Microparticles: From Biogenesis to Biomarkers and Diagnostic Tools in Cardiovascular Disease. Curr. Stem Cell Res. 2017;12:89–102. doi: 10.2174/1574888X11666151203224058. - DOI - PubMed
    1. Said A.S., Rogers S.C., Doctor A. Physiologic Impact of Circulating RBC Microparticles upon Blood-Vascular Interactions. Front. Physiol. 2018;8:1120. doi: 10.3389/fphys.2017.01120. - DOI - PMC - PubMed
    1. Shah M.D., Bergeron A.L., Dong J.F., López J.A. Flow cytometric measurement of microparticles: Pitfalls and protocol modifications. Platelets. 2008;19:365–372. doi: 10.1080/09537100802054107. - DOI - PubMed
    1. Hattangadi S.M., Lodish H.F. Regulation of erythrocyte lifespan: Do reactive oxygen species set the clock? J. Clin. Investig. 2007;117:2075–2077. doi: 10.1172/JCI32559. - DOI - PMC - PubMed