. 2020 Sep 30;6(40):eabc6521.
doi: 10.1126/sciadv.abc6521. Print 2020 Sep.

Adaptive optics two-photon endomicroscopy enables deep-brain imaging at synaptic resolution over large volumes

Affiliations

Adaptive optics two-photon endomicroscopy enables deep-brain imaging at synaptic resolution over large volumes

Zhongya Qin et al. Sci Adv. .

Abstract

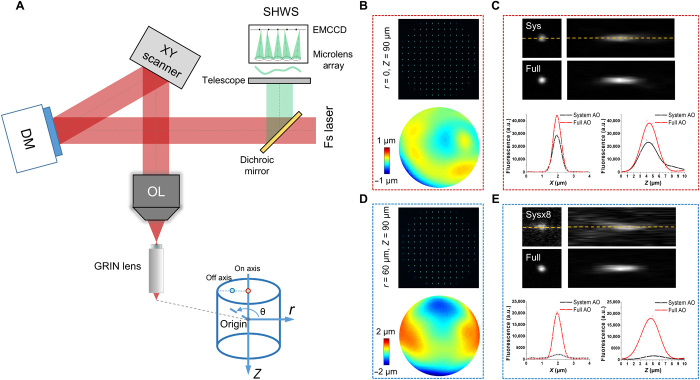
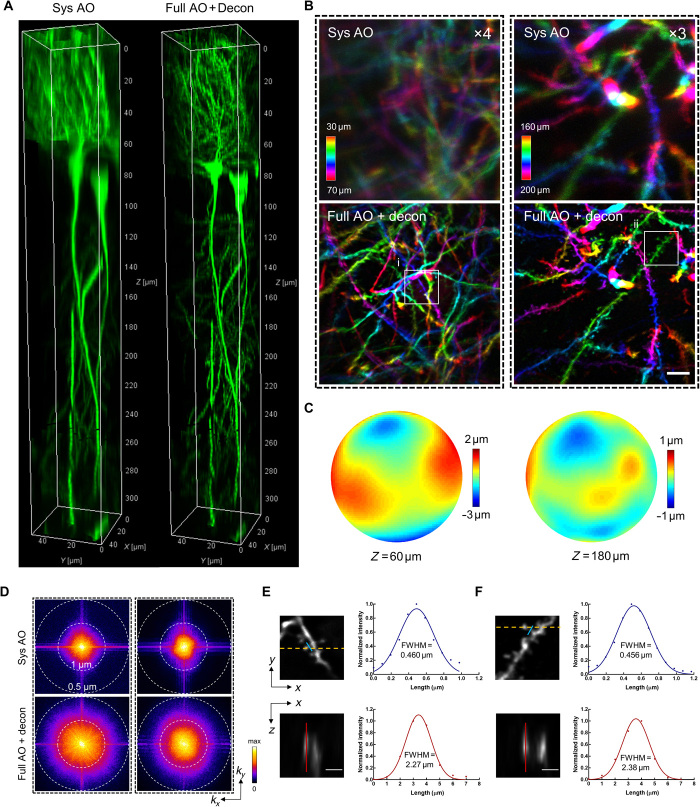
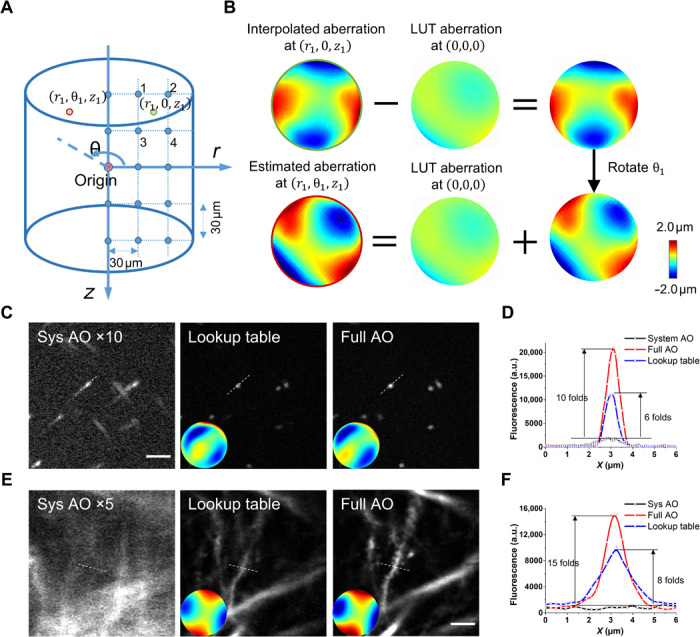
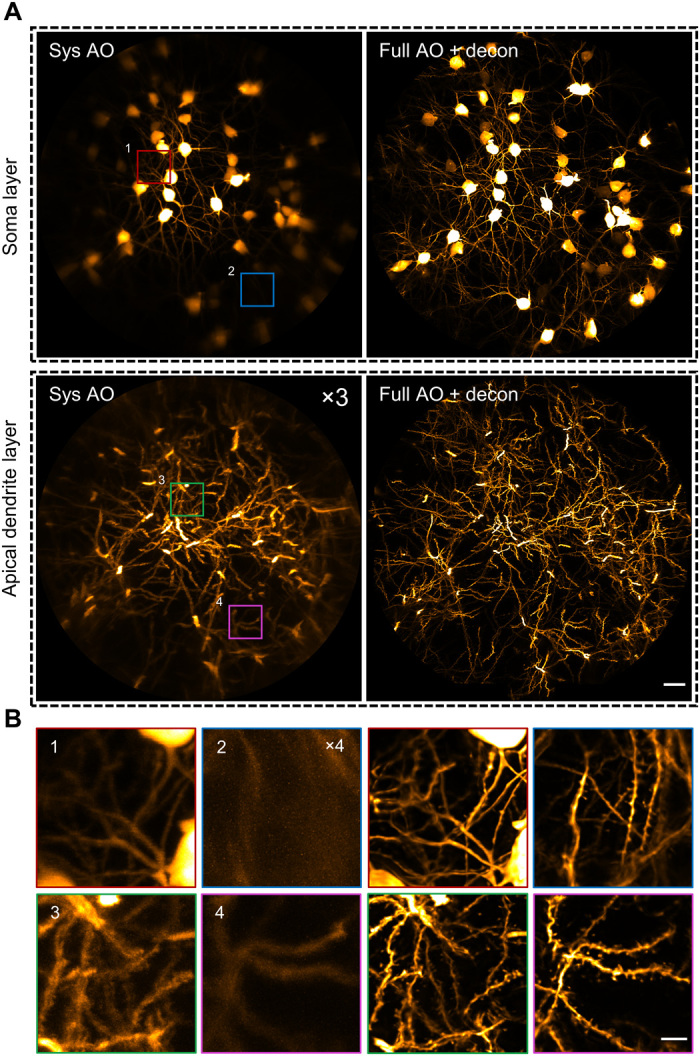
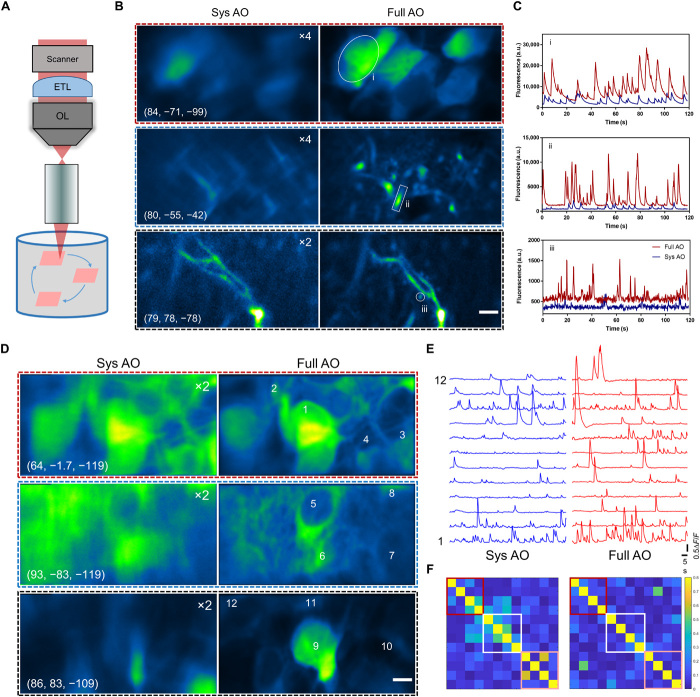
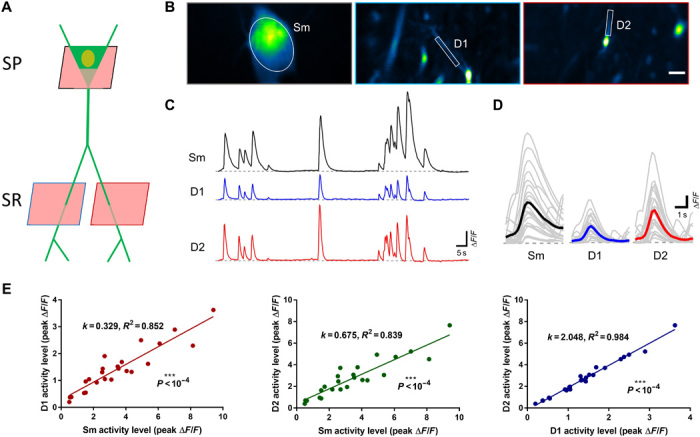
Optical deep-brain imaging in vivo at high resolution has remained a great challenge over the decades. Two-photon endomicroscopy provides a minimally invasive approach to image buried brain structures, once it is integrated with a gradient refractive index (GRIN) lens embedded in the brain. However, its imaging resolution and field of view are compromised by the intrinsic aberrations of the GRIN lens. Here, we develop a two-photon endomicroscopy by adding adaptive optics based on direct wavefront sensing, which enables recovery of diffraction-limited resolution in deep-brain imaging. A new precompensation strategy plays a critical role to correct aberrations over large volumes and achieve rapid random-access multiplane imaging. We investigate the neuronal plasticity in the hippocampus, a critical deep brain structure, and reveal the relationship between the somatic and dendritic activity of pyramidal neurons.


Figures

Fig. 1
Fig. 1. Simplified AO two-photon endomicroscope schematic diagram and characterization of the intrinsic aberrations of the GRIN lens.
(A) AO two-photon endomicroscope based on close-loop direct wavefront sensing of the nonlinear fluorescent guide star. A cylindrical coordinate (r, θ, z) was introduced in the sample space with two dots of red and blue circles indicating on- and off-axis positions, respectively. OL, objective lens; Fs laser, femtosecond laser. (B) Spot pattern displayed on SHWS measured from an on-axis position (0, 0, −90 μm) and the corresponding reconstructed aberration wavefront. (C) Lateral and axial PSF measured with 200-nm-diameter fluorescent beads at the same on-axis position as in (B) with only system or full AO correction. The intensity profiles along the yellow dashed line in (C) were plotted for both system and full AO correction. (D and E) Measurement of spot pattern, aberration wavefront, and PSF as in (B) and (C) but from an off-axis position (60 μm, 180, −90 μm). a.u., arbitrary units.
Fig. 2
Fig. 2. Direct wavefront sensing AO effectively restores diffraction-limited resolution at depth during in vivo brain imaging.
(A) 3D reconstruction of a column (center located at r = 60 μm) of hippocampal CA1 pyramidal neurons in Thy1-GFP mice imaged with our two-photon endomicroscope with system correction only (left) and with full correction plus subsequent deconvolution (right). Full AO correction is performed every 30 μm of depth. (B) Depth color-coded xy maximum intensity projection (MIP) of the stack images (left column: 30 to 70 μm; right column: 160 to 200 μm) from 3D images in Fig. 1A. The images with system correction have been digitally enhanced four- and threefold as indicated for better visualization. Scale bar, 5 μm. (C) Corrective wavefronts of the DM used for full AO correction of the stack images in (B). (D) Spectral power in spatial frequency space (kx, ky) for the images in (B). (E and F) Magnified views of the dendritic spines corresponding to the boxed regions (i and ii) in (B). The spines are shown in lateral (xy) and axial (xz) views. The axial view is shown through the plane defined by the yellow dashed line. Intensity profiles along the blue and red lines are plotted with the curve fitted by a Gaussian function. Scale bars, 2 μm. FWHM, full width at half maximum.
Fig. 3
Fig. 3. Lookup table–based precompensation for GRIN lens aberrations.
(A) Calibration of the lookup table. The cylindrical coordinate system was used to describe the imaging location. The origin is defined as the center located at the designed working distance of the GRIN lens. The entire imaging FOV had a radius of 150 μm and a depth of 300 μm. We measured the intrinsic aberration of the GRIN lens in the θ = 0 subplane at 30-μm intervals, shown as blue dots. (B) Estimation of GRIN lens–induced aberration using the lookup table. To find the aberration at location (r1, θ1, z1) [red circle in (A)], we first estimate the aberration at the rotational symmetrical point (r1, 0, z1) using linear interpolation of the aberrations nearby (the blue dots labeled 1 to 4). Then, the aberration at the origin is subtracted from the interpolated wavefront distortion, and the resulting wavefront is rotated by the angle θ1 and added back to the aberration at the origin. LUT, lookup table. (C and D) In vitro imaging using fluorescent beads of 200 nm in diameter. (C) Fluorescence images with system AO, lookup table, and full AO correction. The insets show the corresponding corrective wavefront. (D) Intensity profile along the dashed lines in (C). (E and F) In vivo imaging of hippocampal neurons in mice. (E) Fluorescence images with system AO, lookup table, and full AO correction. Scale bar, 5 μm. (F) Intensity profile along the dashed lines in (E).
Fig. 4
Fig. 4. AO two-photon endomicroscope enables in vivo imaging of the mouse hippocampus at synaptic resolution over a large FOV.
(A) MIP images of different layers of hippocampal CA1 pyramidal neurons in Thy1-GFP mice with only system correction (left column) and with full correction plus subsequent deconvolution (right column). Depth range of projection for soma layer: 90 to 120 μm; apical dendrite layer: 160 to 190 μm. The images with system correction were enhanced for better visualization. Scale bar, 20 μm. (B) Left: Four magnified views of the subregions indicated by the numbered boxes in (A). Right: Views of corresponding subregions with full AO corrections. Scale bar, 5 μm.
Fig. 5
Fig. 5. Random-access multiplane Ca2+ imaging of hippocampal neurons in vivo.
(A) Schematic diagram of random-access multiplane imaging. Three image planes over the entire imaging volume of 0.3 mm × 0.3 mm × 0.3 mm can be randomly selected and sequentially scanned at 5 Hz with synchronized ETL and xy galvanometer scanners. (B) Multiplane Ca2+ imaging of neuronal somata, dendrites, and spines at various locations with system correction (left) and with full correction (right). The virus AAV-CaMKII-GCaMP6s was injected into the hippocampus CA1 of C57/B6 mice. Images are shown as average-intensity projection of 600 frames. The images with system correction were enhanced as indicated for better visualization. The cylinder coordinates: (μm, degree, μm). Scale bar, 5 μm. (C) Fluorescence traces for the ROIs indicated in (B). (D) Ca2+ imaging of pyramidal neurons in hippocampus CA1 with system and full AO correction. Images are shown as average-intensity projections of 600 frames. Scale bar, 5 μm. (E) Calcium transients (∆F/F) of the selected neurons as shown in (A). (F) Correlation coefficient matrices calculated from ∆F/F traces of all neurons in (B). Colored boxes refer to the three ROIs as shown in (A).
Fig. 6
Fig. 6. AO-assisted multiplane Ca2+ imaging of somato-dendritic activity in hippocampus CA1.
(A) Experimental approach to target the dendrites and soma for single neuron recording in hippocampus CA1. SP, stratum pyramidale; SR, stratum radiatum. (B) Quasi-simultaneous Ca2+ imaging of spontaneous activity from the soma (Sm) and two dendrites (D1 and D2) in awake behaving mice. Images are shown as SD projection of 600 frames. Scale bar, 5 μm. (C) Calcium transients (∆F/F) of the soma and dendrites as shown in (B). (D) Firing events of soma (Sm) and dendrites (D1 and D2) as shown in (B). Gray and colored curves represent the individual and average events, respectively. (E) Relationship between activity strength of the soma-dendrite pairs and dendrite-dendrite pair.

References

    1. Helmchen F., Denk W., Deep tissue two-photon microscopy. Nat. Methods 2, 932–940 (2005). - PubMed
    1. Svoboda K., Yasuda R., Principles of two-photon excitation microscopy and its applications to neuroscience. Neuron 50, 823–839 (2006). - PubMed
    1. Horton N. G., Wang K., Kobat D., Clark C. G., Wise F. W., Schaffer C. B., Xu C., In vivo three-photon microscopy of subcortical structures within an intact mouse brain. Nat. Photonics 7, 205–209 (2013). - PMC - PubMed
    1. Tischbirek C., Birkner A., Jia H., Sakmann B., Konnerth A., Deep two-photon brain imaging with a red-shifted fluorometric Ca2+ indicator. Proc. Natl. Acad. Sci. U.S.A. 112, 11377–11382 (2015). - PMC - PubMed
    1. Barretto R. P. J., Messerschmidt B., Schnitzer M. J., In vivo fluorescence imaging with high-resolution microlenses. Nat. Methods 6, 511–512 (2009). - PMC - PubMed

Publication types

LinkOut - more resources