. 2020 Sep 30;12(563):eaay3575.
doi: 10.1126/scitranslmed.aay3575.

Blockade of immune checkpoints in lymph nodes through locoregional delivery augments cancer immunotherapy

Affiliations

Blockade of immune checkpoints in lymph nodes through locoregional delivery augments cancer immunotherapy

David M Francis et al. Sci Transl Med. .

Abstract

Systemic administration of immune checkpoint blockade (ICB) monoclonal antibodies (mAbs) can unleash antitumor functions of T cells but is associated with variable response rates and off-target toxicities. We hypothesized that antitumor efficacy of ICB is limited by the minimal accumulation of mAb within tissues where antitumor immunity is elicited and regulated, which include the tumor microenvironment (TME) and secondary lymphoid tissues. In contrast to systemic administration, intratumoral and intradermal routes of administration resulted in higher mAb accumulation within both the TME and its draining lymph nodes (LNs) or LNs alone, respectively. The use of either locoregional administration route resulted in pronounced T cell responses from the ICB therapy, which developed in the secondary lymphoid tissues and TME of treated mice. Targeted delivery of mAb to tumor-draining lymph nodes (TdLNs) alone was associated with enhanced antitumor immunity and improved therapeutic effects compared to conventional systemic ICB therapy, and these effects were sustained at reduced mAb doses and comparable to those achieved by intratumoral administration. These data suggest that locoregional routes of administration of ICB mAb can augment ICB therapy by improving immunomodulation within TdLNs.


Conflict of interest statement

Competing interests: The authors declare that they have no competing interests.

Figures

Fig. 1.
Fig. 1.. Intratumoral administration of ICB promotes systemic antitumor immunity.
After B16F10 implantation, mice were administered 150 μg each of aPD-1 and aCTLA-4 (9H10) mAb on days 5, 7, and 9 after tumor implantation i.p. or i.t. (A) Tumor growth curve of primary tumor (day 0 tumor implant). (B) Tumor growth curve of secondary tumor (day 2 tumor implant, nontreated tumor). (C) Survival curves of mice. Combined data of two independent repeats (total n = 10). Statistical analyses were done using ANOVA with Tukey’s test. Log-rank (Mantel-Cox) test for survival curves. *P < 0.05, **P < 0.01, and ****P < 0.0001. Data are represented as means + SEM.
Fig. 2.
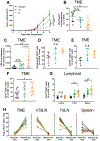
Fig. 2.. Tumor-bearing mice intratumorally administered ICB exhibit distinct T cell changes in TME, TdLN, and spleen.
(A) B16F10 tumor growth over 12 days with 150 μg of each ICB mAb [combination of aPD-1 and aCTLA-4 (9H10)] administered on days 5, 7, and 9 after tumor implantation. (B) Frequencies of CD4+FoxP3+ T cells. (C) Frequencies of CD8+ T cells in TME. Frequencies of granzyme B+ (D) and KLRG1+ (E) CD8+ T cells in TME. Frequencies of Ki-67+CD8+ T cells in TME (F) and lymphoid tissues (G). (H) Frequencies of “stem-like” (Tcf1+Tim3) versus “effector-like” (Tcf1Tim3+) CD8 T cells, pregated on PD-1+ cells, in the TME, nTdLNs, TdLNs, and spleen. (B to H) End point analyses of tissues on day 12. (D) to (F) represent one independent experiment (n = 5); (A) to (C), (F), and (G) represent two independent experiments (total n = 10). Statistical analyses were done using ANOVA with Tukey’s test. *P < 0.05, **P < 0.01, and ***P < 0.001. n.s., not significant. Data are represented by means + SEM (A) or ± SD (B to G).
Fig. 3.
Fig. 3.. Directed mAb delivery to various tissue combinations with different routes of administration.
Measured tissue concentrations of Alexa Fluor 647–labeled aPD-1 or aCTLA-4 (9H10) mAb. (A) Injection sites and color scheme. (B) mAb signal (IVIS quantification) in TME over 24 hours after injection. (C) mAb concentration in tumor, blood, and spleen 24 hours after injection. (D and E) Representative IVIS images of mAb accumulation in spleens (scale bar, 0.5 cm) (D) and LNs (scale bar, 0.25 cm) (E). (F) mAb concentrations in LNs 24 hours after injection. (G and H) Measured concentrations of Alexa Fluor 647–labeled aPD-1 or aCTLA-4 in TdLNs using different mAb doses. (G) Representative IVIS images of mAb accumulation in TdLNs after i.l. administration (scale bar, 0.25 cm). (H) Quantification of (G). (I) Concentration of aCD3 (purple, left axis) and frequencies of T cell labeling of injected aCD3 (black, right axis) in LNs draining forelimb i.d. injection. Data represent two independent experiments (total n = 5). Statistical analyses were done using ANOVA with Tukey’s test. ***P < 0.001; n.s., not significant. Data are represented by means ± SD.
Fig. 4.
Fig. 4.. ICB directed toward TdLNs potentiates ICB therapeutic effects in melanoma.
B16F10 tumor growth and animal survival after aPD-1 monotherapy (A and B), aCTLA-4 (9H10) monotherapy (C and D), and aPD-1 + aCTLA-4 (9H10) therapy (E and F) using 150 μg of each mentioned mAb. Tumor growth is shown in (A), (C), and (E), and animal survival is shown in (B), (D), and (F). (A) to (D) represent one independent experiment (n = 5); (E) and (F) represent three independent experiments (total n = 15). Statistical analyses were done using ANOVA with Tukey’s test. Log-rank (Mantel-Cox) test for survival curves. *P < 0.05, **P < 0.01, and ****P < 0.0001. Data are represented by means + SEM.
Fig. 5.
Fig. 5.. ICB directed to TdLNs alone or in combination with the TME improves therapeutic effects of vaccination.
(A) B16F10-OVA treatment schedule and color scheme. Vaccination was performed by i.d. administration of 3 μg of CpG and 10 μg of OVA in each limb on days 4 and 10. One-hundred fifty micrograms of each ICB mAb [aPD-1 and aCTLA-4 (9H10) in combination] using the indicated administration routes on days 5, 8, 11, and 14. (B) Tumor growth during the treatment window. (C) Animal survival curves. (D to F) Tumor volume (x axis) versus T cell infiltration (y axis): (D) CD8+/CD4+FoxP3+ TIL ratio, (E) CD8+ frequency of CD3+ TILs, and (F) CD4+FoxP3+ frequency of CD3+ TILs. (G) Frequencies of Ki-67+CD4+FoxP3+ in TME. (H) Frequencies of CD8+ T cells in TME. Frequencies of Ki-67+CD8+ T cells in TME (I) and lymphoid tissues (J). (B) represents three independent experiments (total n = 14); (C) represents one (vaccine control) or two (all groups excluding vaccine control) independent experiments (total n = 4 to 8); (D) to (J) represent two (vaccine control, ICB i.p., and ICB i.t.) or three (PBS control and ICB i.d.) independent experiments (total n = 8 to 14). Statistical analyses were done using ANOVA with Tukey’s test. Log-rank (Mantel-Cox) test for survival curves. *P < 0.05, **P < 0.01, ***P < 0.001, and ****P < 0.0001. Data are represented by means + SEM (B) or ± SD (G to J).
Fig. 6.
Fig. 6.. ICB directed to TdLNs alone or in combination with the TME potentiates ICB therapeutic effects independent of trTreg depletion.
B16F10 tumor growth and animal survival after ICB therapy using 150, 50, or 12.5 μg of each aPD-1 (clone RMP1–14) in combination with aCTLA-4 (clone 4F10); (A and B) i.p. administration, (C and D) c.l. administration, (E and F) i.l. administration, and (G and H) i.t. administration. Tumor growth is shown in (A), (C), (E), and (G), and animal survival is shown in (B), (D), (F), and (H). Combined data of two independent repeats (total n = 10). Statistical analyses were done using ANOVA with Tukey’s test. Log-rank (Mantel-Cox) test for survival curves. *P < 0.05, **P < 0.01, ***P < 0.001, and ****P < 0.0001. Data are represented by means +SEM.
Fig. 7.
Fig. 7.. ICB directed to TdLNs elicits robust antitumor therapeutic effects in breast tumor models.
(A) Image of administration sites and color scheme. mAb concentrations in (B) TME, (C) spleen, and (D) LNs in E0771 tumor-bearing animals 24 hours after injection. (E) Growth curves of E0771 tumors treated with a single 100-μg dose of each aPD-1 and aCTLA-4 (clone 9H10) when tumors reached approximately 100 mm3. (F) Survival of animals treated in (E). (G) Growth curves of E0771 tumors treated with 30 μg of each aPD-1 and aCTLA-4 (clone 4F10) therapy on days 10, 14, and 20. (H) Survival of animals treated in (G). (I) Growth curves of 4T1 tumors treated with 50 μg of each aPD-1 and aCTLA-4 (clone 4F10) on day 7. (J) Survival of animals treated in (I). (B) and (D) to (F) represent two independent experiments (total n = 9 to 11); (C) and (G) to (J) represent one experiment (total n = 4 to 8). Statistical analyses were done using ANOVA with Tukey’s test. Log-rank (Mantel-Cox) test for survival curves. *P < 0.05, **P < 0.01, and ***P < 0.001; n.s., not significant. Data are represented by means + SEM (E, G, and I) or ± SD (B to D).
Fig. 8.
Fig. 8.. Locoregional administration reduces ICB-associated toxicities and improves TdLN-dependent effects of sustained mAb release.
Serum alanine transaminase (ALT) concentrations 12 days after B16F10 implantation and 22 days after E0771 implantation (A) and 16 days after tumor implantation in vaccinated B16F10-OVA–bearing animals (B). (A) Closed circles, B16F10; open circles, E0771. Naïve: tumor-free mouse. PBS was administered i.t. (C) Liver mAb concentrations 24 hours after i.p. administration at various total doses. (D) mAb signal (IVIS quantification) in forelimb over 72 hours after injection. (E) dLN mAb concentrations 30 and 72 hours after injection. B16F10 tumor growth (F) and animal survival (G) after ICB therapy with 25 μg of each aPD-1 (clone RMP1–14) and aCTLA-4 (clone 9H10). (A) represents one experiment in each tumor model (total n = 10); (B) represents two (PBS control, vaccine control, ICB i.p., and ICB i.d.) or three (ICB i.t. and naïve) independent experiments (total n = 6 to 16); (C) to (G) represent one experiment [C and E, n = 2; D, n = 4; F and G, n = 4 (controls) or n = 8 (ICB groups)]. Statistical analyses were done using ANOVA with Tukey’s test. *P < 0.05, **P < 0.01, ***P < 0.001. Data are represented by means + SEM (F) or ± SD (A, B, and D).

References

    1. Pardoll DM, The blockade of immune checkpoints in cancer immunotherapy. Nat. Rev. Cancer 12, 252–264 (2012). - PMC - PubMed
    1. Hargadon KM, Johnson CE, Williams CJ, Immune checkpoint blockade therapy for cancer: An overview of FDA-approved immune checkpoint inhibitors. Int. Immunopharmacol 62, 29–39 (2018). - PubMed
    1. Intlekofer AM, Thompson CB, At the bench: Preclinical rationale for CTLA-4 and PD-1 blockade as cancer immunotherapy. J. Leukoc. Biol 94, 25–39 (2017). - PMC - PubMed
    1. Simpson TR, Li F, Montalvo-Ortiz W, Sepulveda MA, Bergerhoff K, Arce F, Roddie C, Henry JY, Yagita H, Wolchok JD, Peggs KS, Ravetch JV, Allison JP, Quezada SA, Fc-dependent depletion of tumor-infiltrating regulatory T cells co-defines the efficacy of anti-CTLA-4 therapy against melanoma. J. Exp. Med 210, 1695–1710 (2013). - PMC - PubMed
    1. Selby MJ, Engelhardt JJ, Quigley M, Henning KA, Chen T, Srinivasan M, Korman AJ, Anti-CTLA-4 antibodies of IgG2a isotype enhance antitumor activity through reduction of intratumoral regulatory T cells. Cancer Immunol. Res 1, 32–42 (2013). - PubMed

Publication types