

Identification of Microorganisms by Liquid Chromatography-Mass Spectrometry (LC-MS1) and in Silico Peptide Mass Libraries
- PMID: 32998977
- PMCID: PMC7710138
- DOI: 10.1074/mcp.TIR120.002061
Identification of Microorganisms by Liquid Chromatography-Mass Spectrometry (LC-MS1) and in Silico Peptide Mass Libraries
Abstract
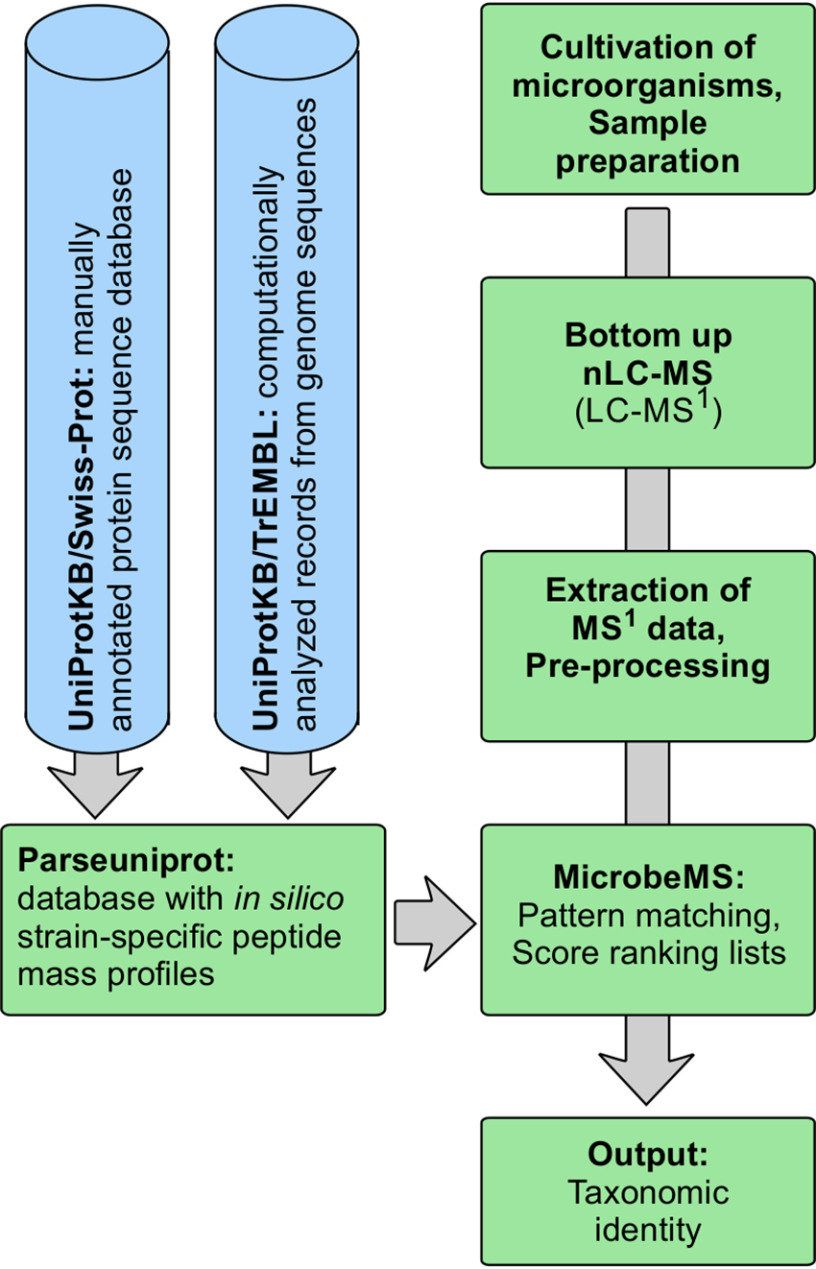
Over the past decade, modern methods of MS (MS) have emerged that allow reliable, fast and cost-effective identification of pathogenic microorganisms. Although MALDI-TOF MS has already revolutionized the way microorganisms are identified, recent years have witnessed also substantial progress in the development of liquid chromatography (LC)-MS based proteomics for microbiological applications. For example, LC-tandem MS (LC-MS2) has been proposed for microbial characterization by means of multiple discriminative peptides that enable identification at the species, or sometimes at the strain level. However, such investigations can be laborious and time-consuming, especially if the experimental LC-MS2 data are tested against sequence databases covering a broad panel of different microbiological taxa. In this proof of concept study, we present an alternative bottom-up proteomics method for microbial identification. The proposed approach involves efficient extraction of proteins from cultivated microbial cells, digestion by trypsin and LC-MS measurements. Peptide masses are then extracted from MS1 data and systematically tested against an in silico library of all possible peptide mass data compiled in-house. The library has been computed from the UniProt Knowledgebase covering Swiss-Prot and TrEMBL databases and comprises more than 12,000 strain-specific in silico profiles, each containing tens of thousands of peptide mass entries. Identification analysis involves computation of score values derived from correlation coefficients between experimental and strain-specific in silico peptide mass profiles and compilation of score ranking lists. The taxonomic positions of the microbial samples are then determined by using the best-matching database entries. The suggested method is computationally efficient - less than 2 mins per sample - and has been successfully tested by a test set of 39 LC-MS1 peak lists obtained from 19 different microbial pathogens. The proposed method is rapid, simple and automatable and we foresee wide application potential for future microbiological applications.
Keywords: Bacteria; LC-MS1; bioinformatics software; diagnostic; diagnostics; identification of microorganisms; mass spectrometry; microbiology.
© 2020 Lasch et al.
Conflict of interest statement
Conflict of interest—The authors have declared a conflict of interest. A.S., J.D., and P.L. are the inventors of SPEED and have submitted patent applications related to SPEED.
Figures


Similar articles
-
Typing and Characterization of Bacteria Using Bottom-up Tandem Mass Spectrometry Proteomics.Mol Cell Proteomics. 2017 Jun;16(6):1052-1063. doi: 10.1074/mcp.M116.061721. Epub 2017 Apr 18. Mol Cell Proteomics. 2017. PMID: 28420677 Free PMC article.
-
[Analysis and identification of suspected snake venom samples using nano-ultra-high performance liquid chromatography-high resolution mass spectrometry].Se Pu. 2023 Feb;41(2):122-130. doi: 10.3724/SP.J.1123.2022.08009. Se Pu. 2023. PMID: 36725708 Free PMC article. Chinese.
-
Fast and Accurate Bacterial Species Identification in Urine Specimens Using LC-MS/MS Mass Spectrometry and Machine Learning.Mol Cell Proteomics. 2019 Dec;18(12):2492-2505. doi: 10.1074/mcp.TIR119.001559. Epub 2019 Oct 4. Mol Cell Proteomics. 2019. PMID: 31585987 Free PMC article.
-
Potential of MALDI-TOF mass spectrometry as a rapid detection technique in plant pathology: identification of plant-associated microorganisms.Anal Bioanal Chem. 2012 Sep;404(4):1247-55. doi: 10.1007/s00216-012-6091-7. Epub 2012 May 30. Anal Bioanal Chem. 2012. PMID: 22644150 Review.
-
Proteotyping: Proteomic characterization, classification and identification of microorganisms--A prospectus.Syst Appl Microbiol. 2015 Jun;38(4):246-57. doi: 10.1016/j.syapm.2015.03.006. Epub 2015 Apr 11. Syst Appl Microbiol. 2015. PMID: 25933927 Review.
Cited by
-
Multiplexing the Identification of Microorganisms via Tandem Mass Tag Labeling Augmented by Interference Removal through a Novel Modification of the Expectation Maximization Algorithm.J Am Soc Mass Spectrom. 2024 Jun 5;35(6):1138-1155. doi: 10.1021/jasms.3c00445. Epub 2024 May 13. J Am Soc Mass Spectrom. 2024. PMID: 38740383 Free PMC article.
-
MALDI-TOF Mass Spectroscopy Applications in Clinical Microbiology.Adv Pharmacol Pharm Sci. 2021 May 7;2021:9928238. doi: 10.1155/2021/9928238. eCollection 2021. Adv Pharmacol Pharm Sci. 2021. PMID: 34041492 Free PMC article. Review.
-
Identification of Microbial Strains via 2D Cross-Correlation of LC-MS Data.J Am Soc Mass Spectrom. 2024 Jun 5;35(6):1352-1362. doi: 10.1021/jasms.4c00101. Epub 2024 May 14. J Am Soc Mass Spectrom. 2024. PMID: 38742647 Free PMC article.
-
Proteomic Diversity in Bacteria: Insights and Implications for Bacterial Identification.Mol Cell Proteomics. 2025 Mar;24(3):100917. doi: 10.1016/j.mcpro.2025.100917. Epub 2025 Jan 27. Mol Cell Proteomics. 2025. PMID: 39880082 Free PMC article.
-
Utilizing Quantitative Proteomics to Identify Species-Specific Protein Therapeutic Targets for the Treatment of Leishmaniasis.ACS Omega. 2022 Apr 4;7(15):12580-12588. doi: 10.1021/acsomega.1c05792. eCollection 2022 Apr 19. ACS Omega. 2022. PMID: 35474788 Free PMC article.
References
-
- Seng P., Drancourt M., Gouriet F., La Scola B., Fournier P. E., Rolain J. M., and Raoult D. (2009) Ongoing revolution in bacteriology: routine identification of bacteria by matrix-assisted laser desorption ionization time-of-flight mass spectrometry. Clin. Infect. DIS. 49, 543–551 - PubMed
-
- Nomura F. (2015) Proteome-based bacterial identification using matrix-assisted laser desorption ionization-time of flight mass spectrometry (MALDI-TOF MS): A revolutionary shift in clinical diagnostic microbiology. Biochim. Biophys. Acta 1854, 528–537 - PubMed
-
- Schubert S., and Kostrzewa M. (2017) MALDI-TOF MS in the Microbiology Laboratory: Current Trends. Curr. Issues Mol. Biol. 23, 17–20 - PubMed
-
- Welker M., Van Belkum A., Girard V., Charrier J. P., and Pincus D. (2019) An update on the routine application of MALDI-TOF MS in clinical microbiology. Expert Rev. Proteomics 16, 695–710 - PubMed
-
- Sandrin T. R., Goldstein J. E., and Schumaker S. (2013) MALDI TOF MS profiling of bacteria at the strain level: a review. Mass Spectrom. Rev. 32, 188–217 - PubMed
MeSH terms
Substances
LinkOut - more resources
Full Text Sources
Other Literature Sources
Molecular Biology Databases
Miscellaneous
