. 2020 Nov 15;205(10):2786-2794.
doi: 10.4049/jimmunol.2000784. Epub 2020 Sep 30.

Non-Cell-Autonomous Activity of the Hemidesmosomal Protein BP180/Collagen XVII in Granulopoiesis in Humanized NC16A Mice

Affiliations

Non-Cell-Autonomous Activity of the Hemidesmosomal Protein BP180/Collagen XVII in Granulopoiesis in Humanized NC16A Mice

Lin Lin et al. J Immunol. .

Abstract

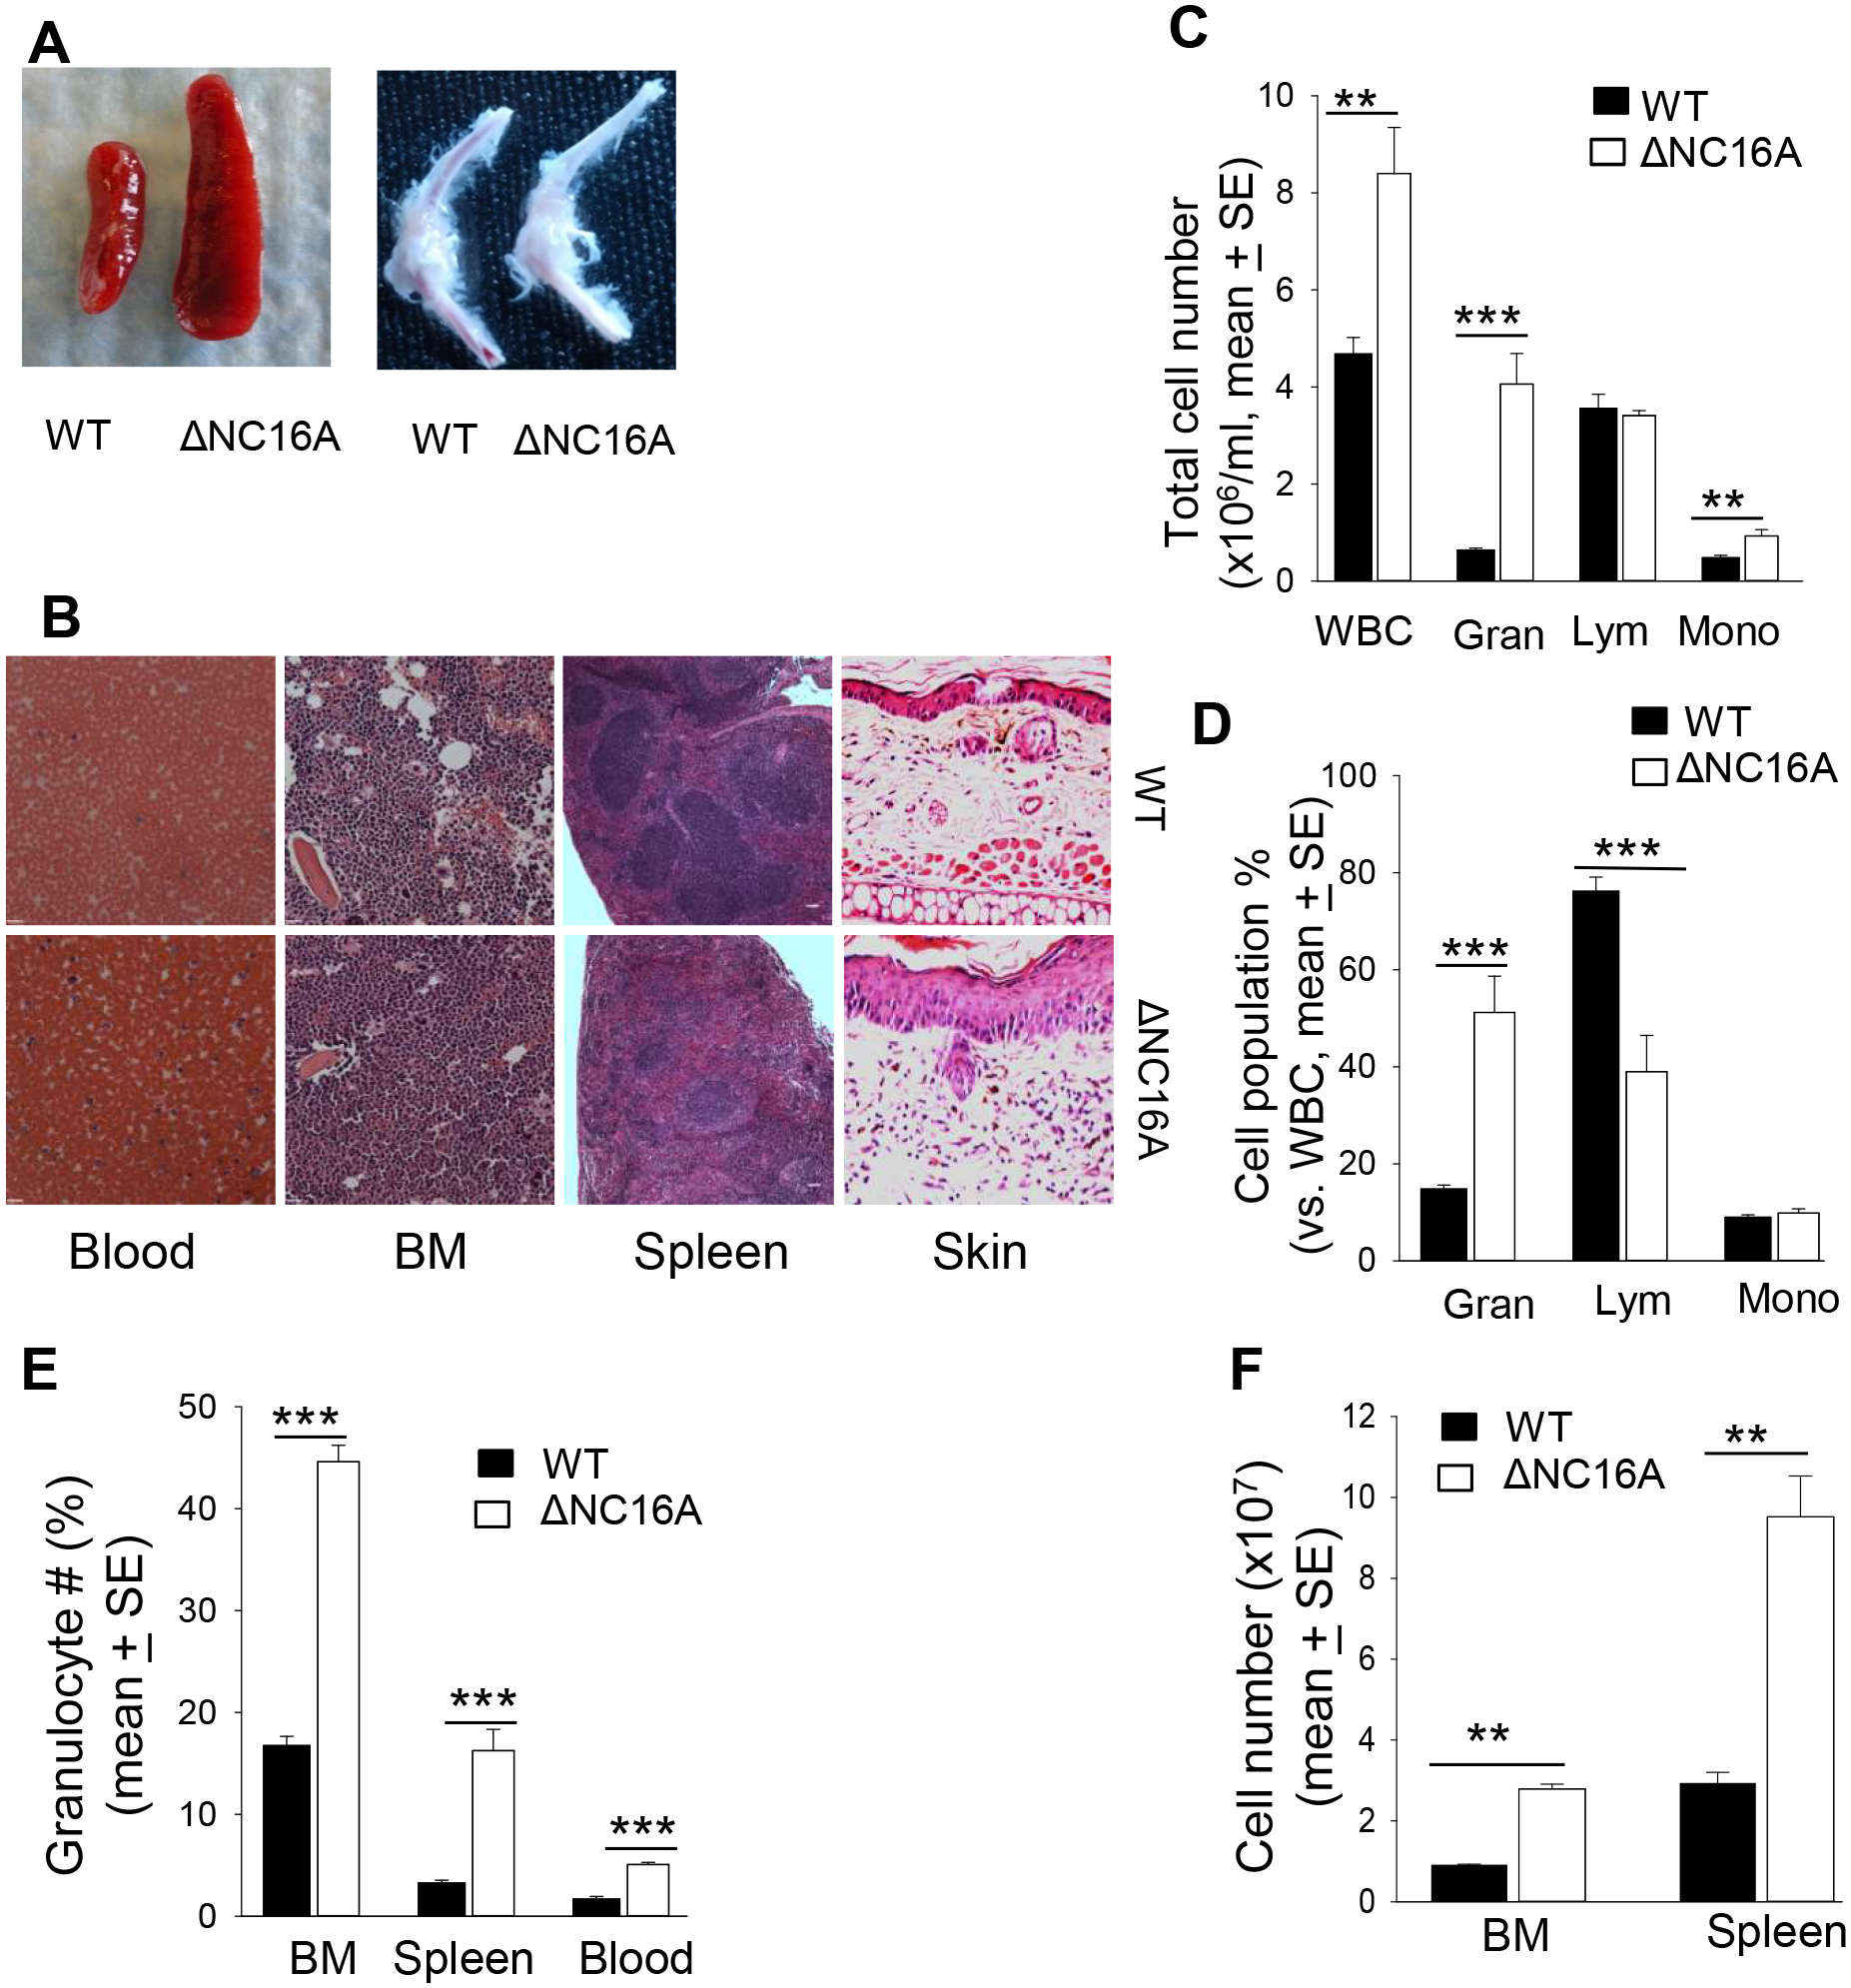
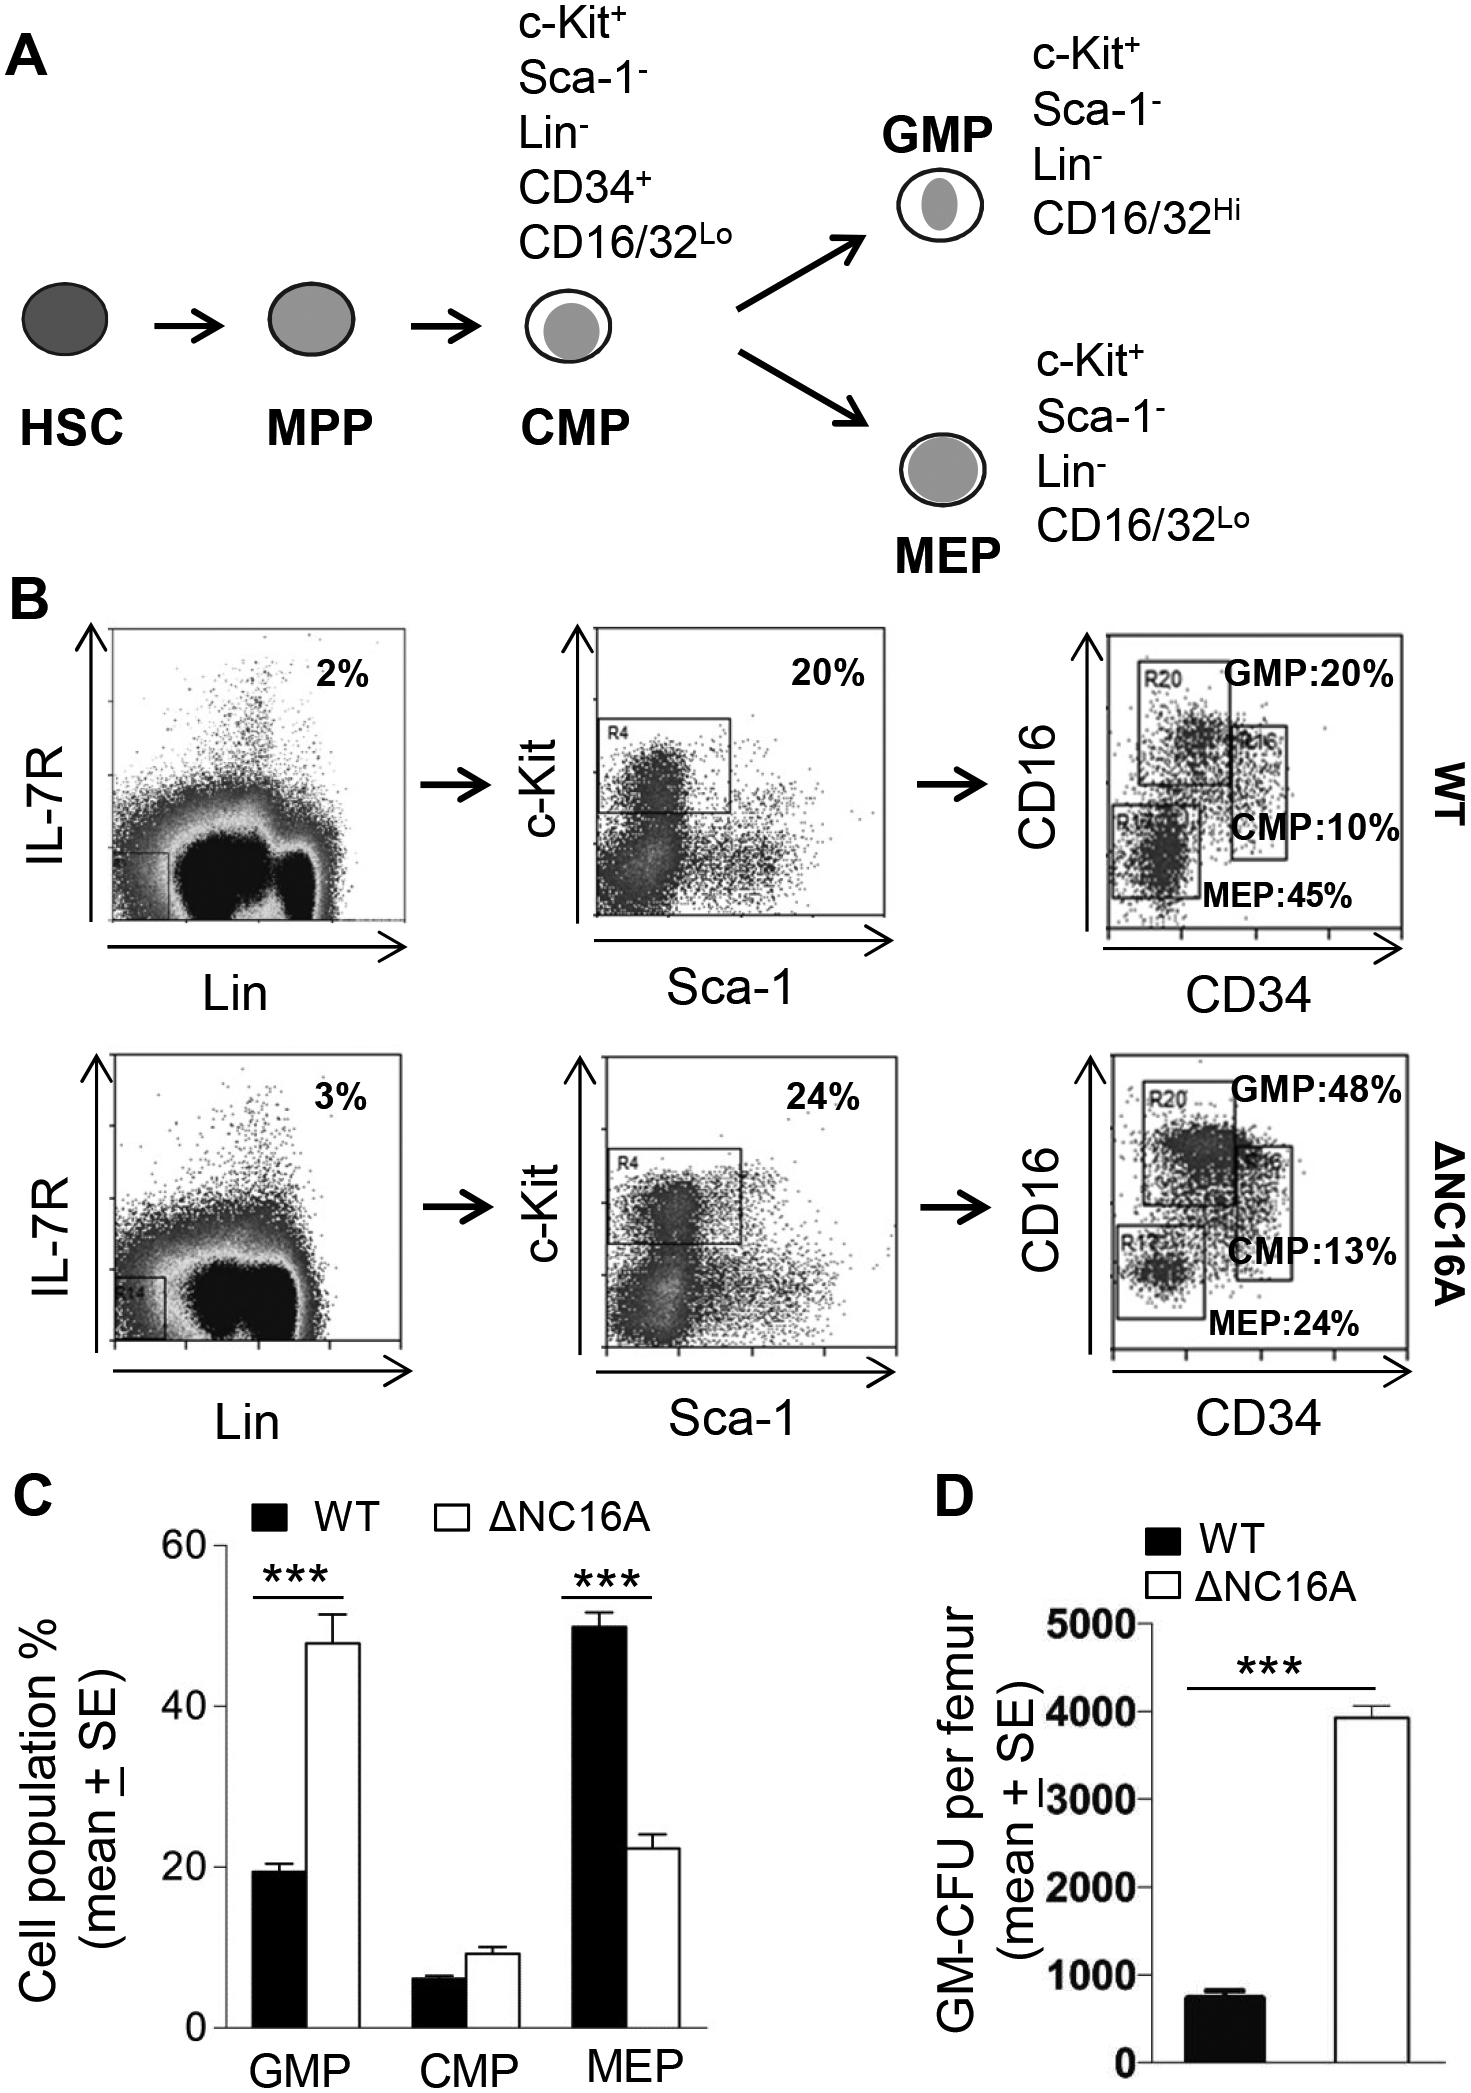
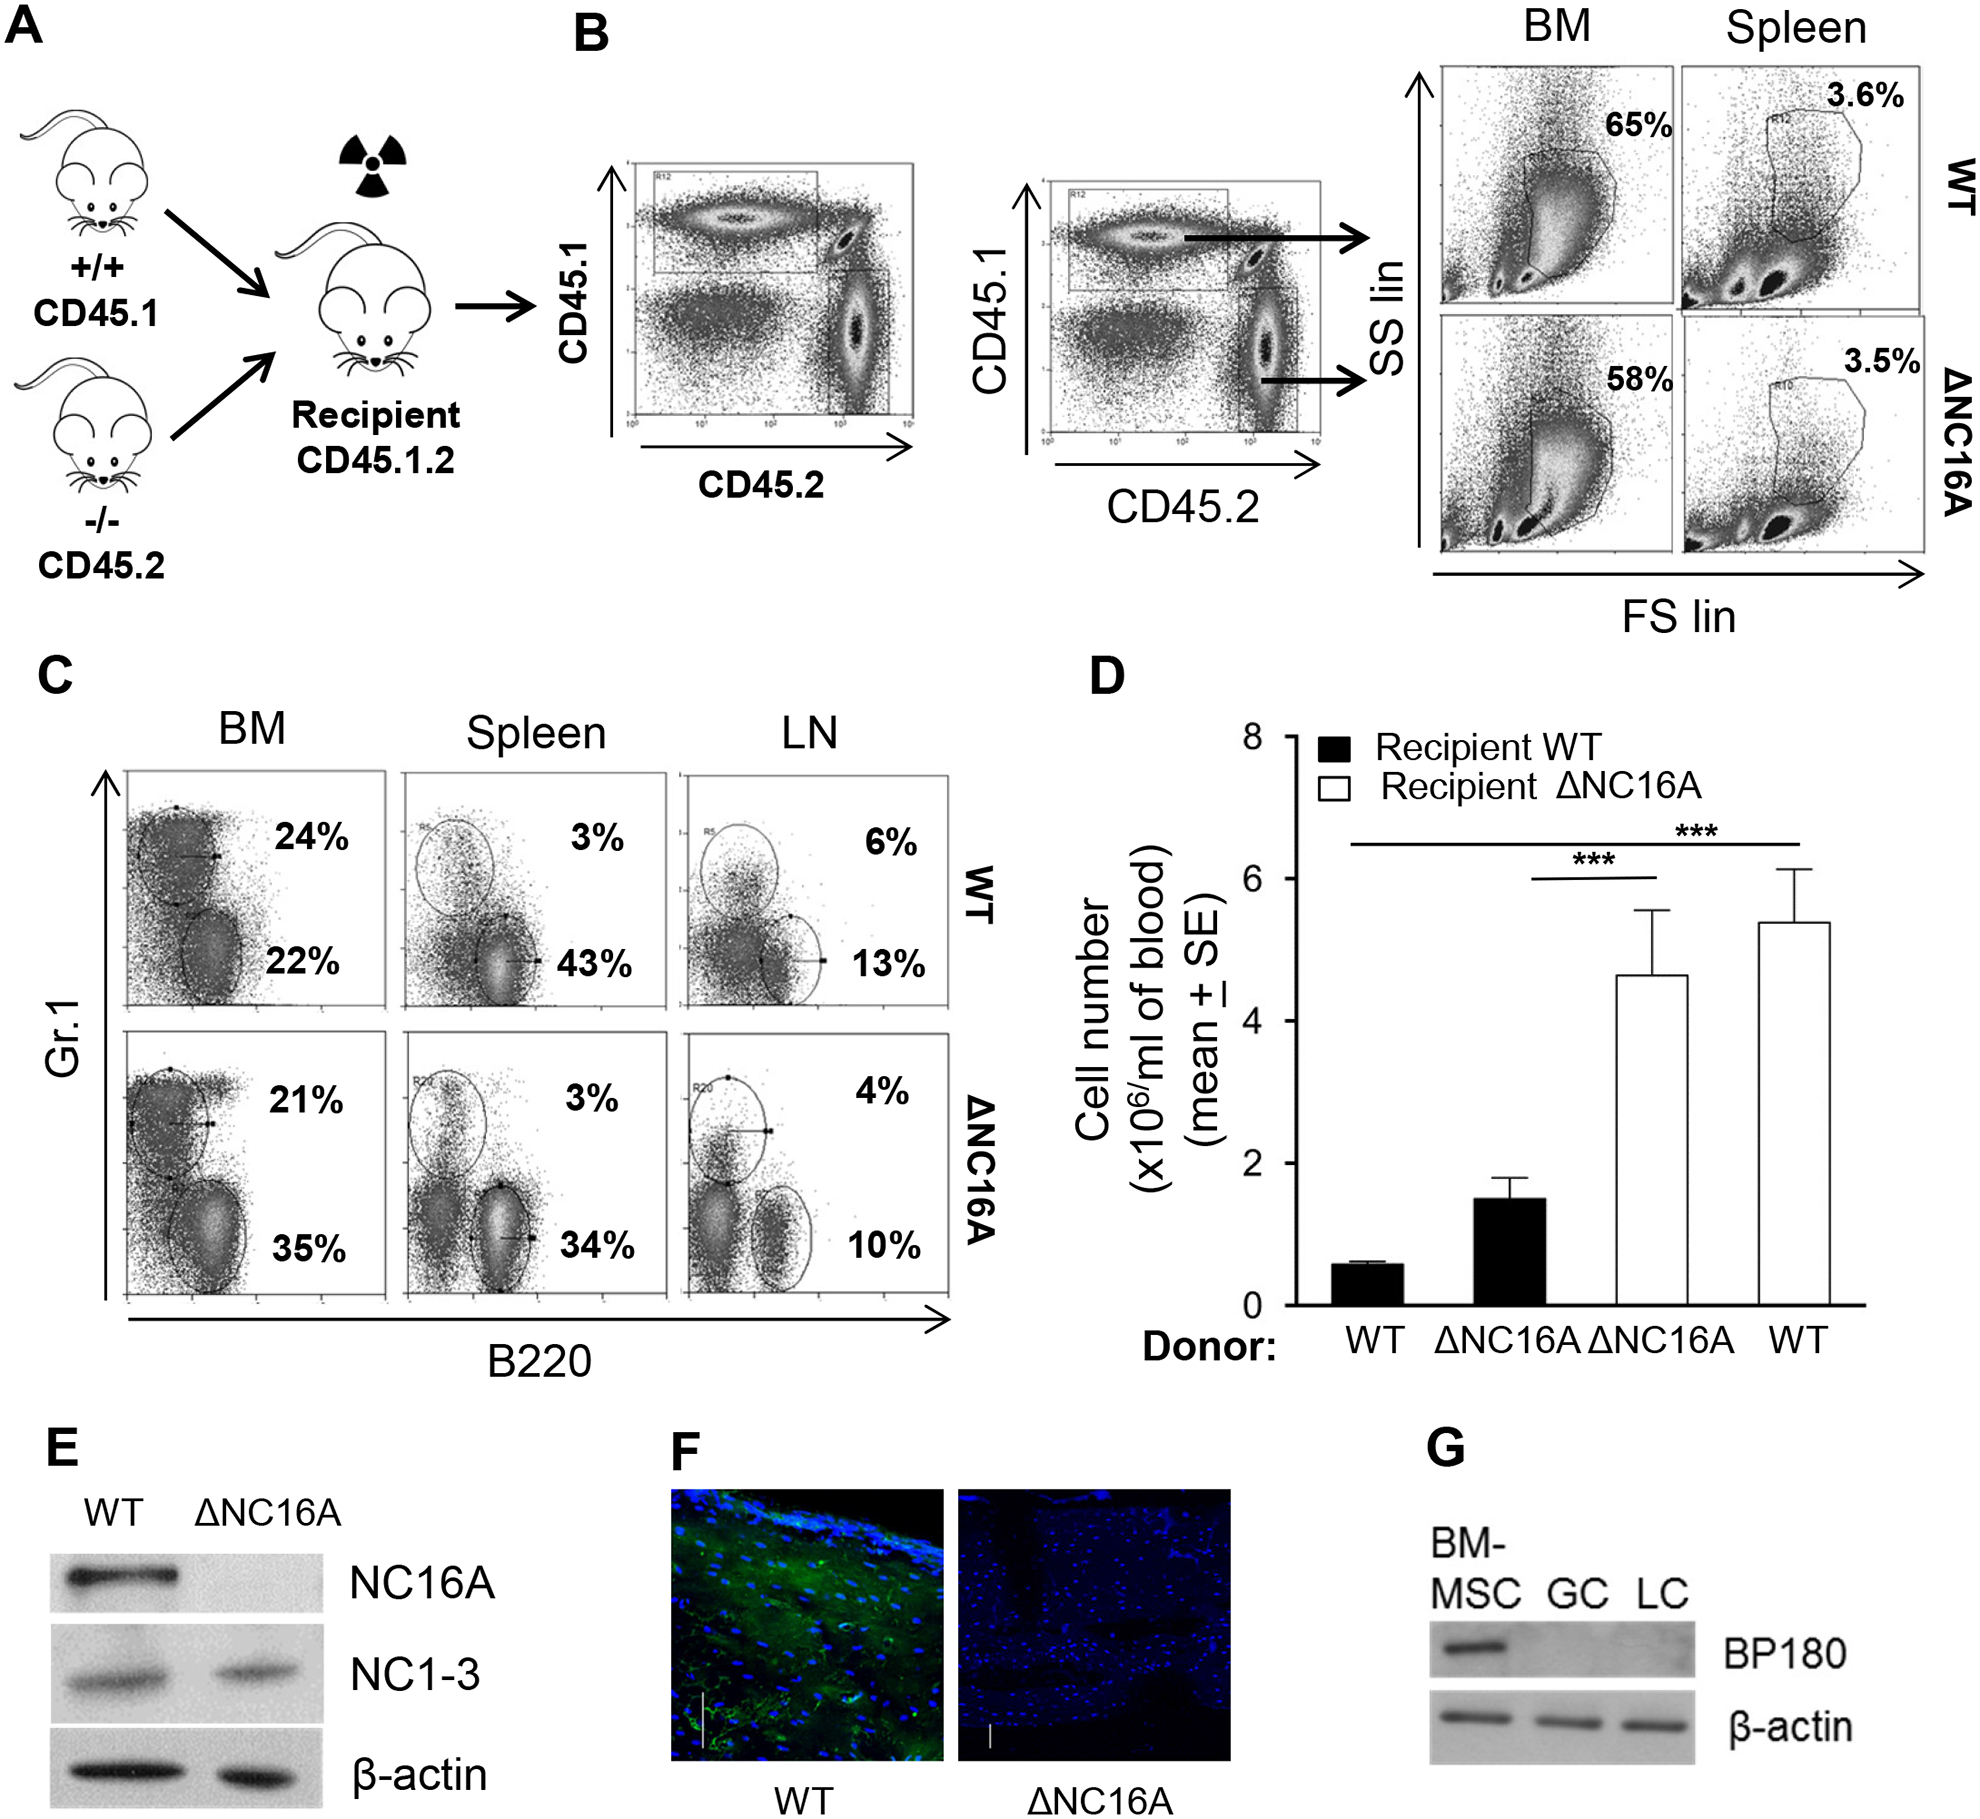
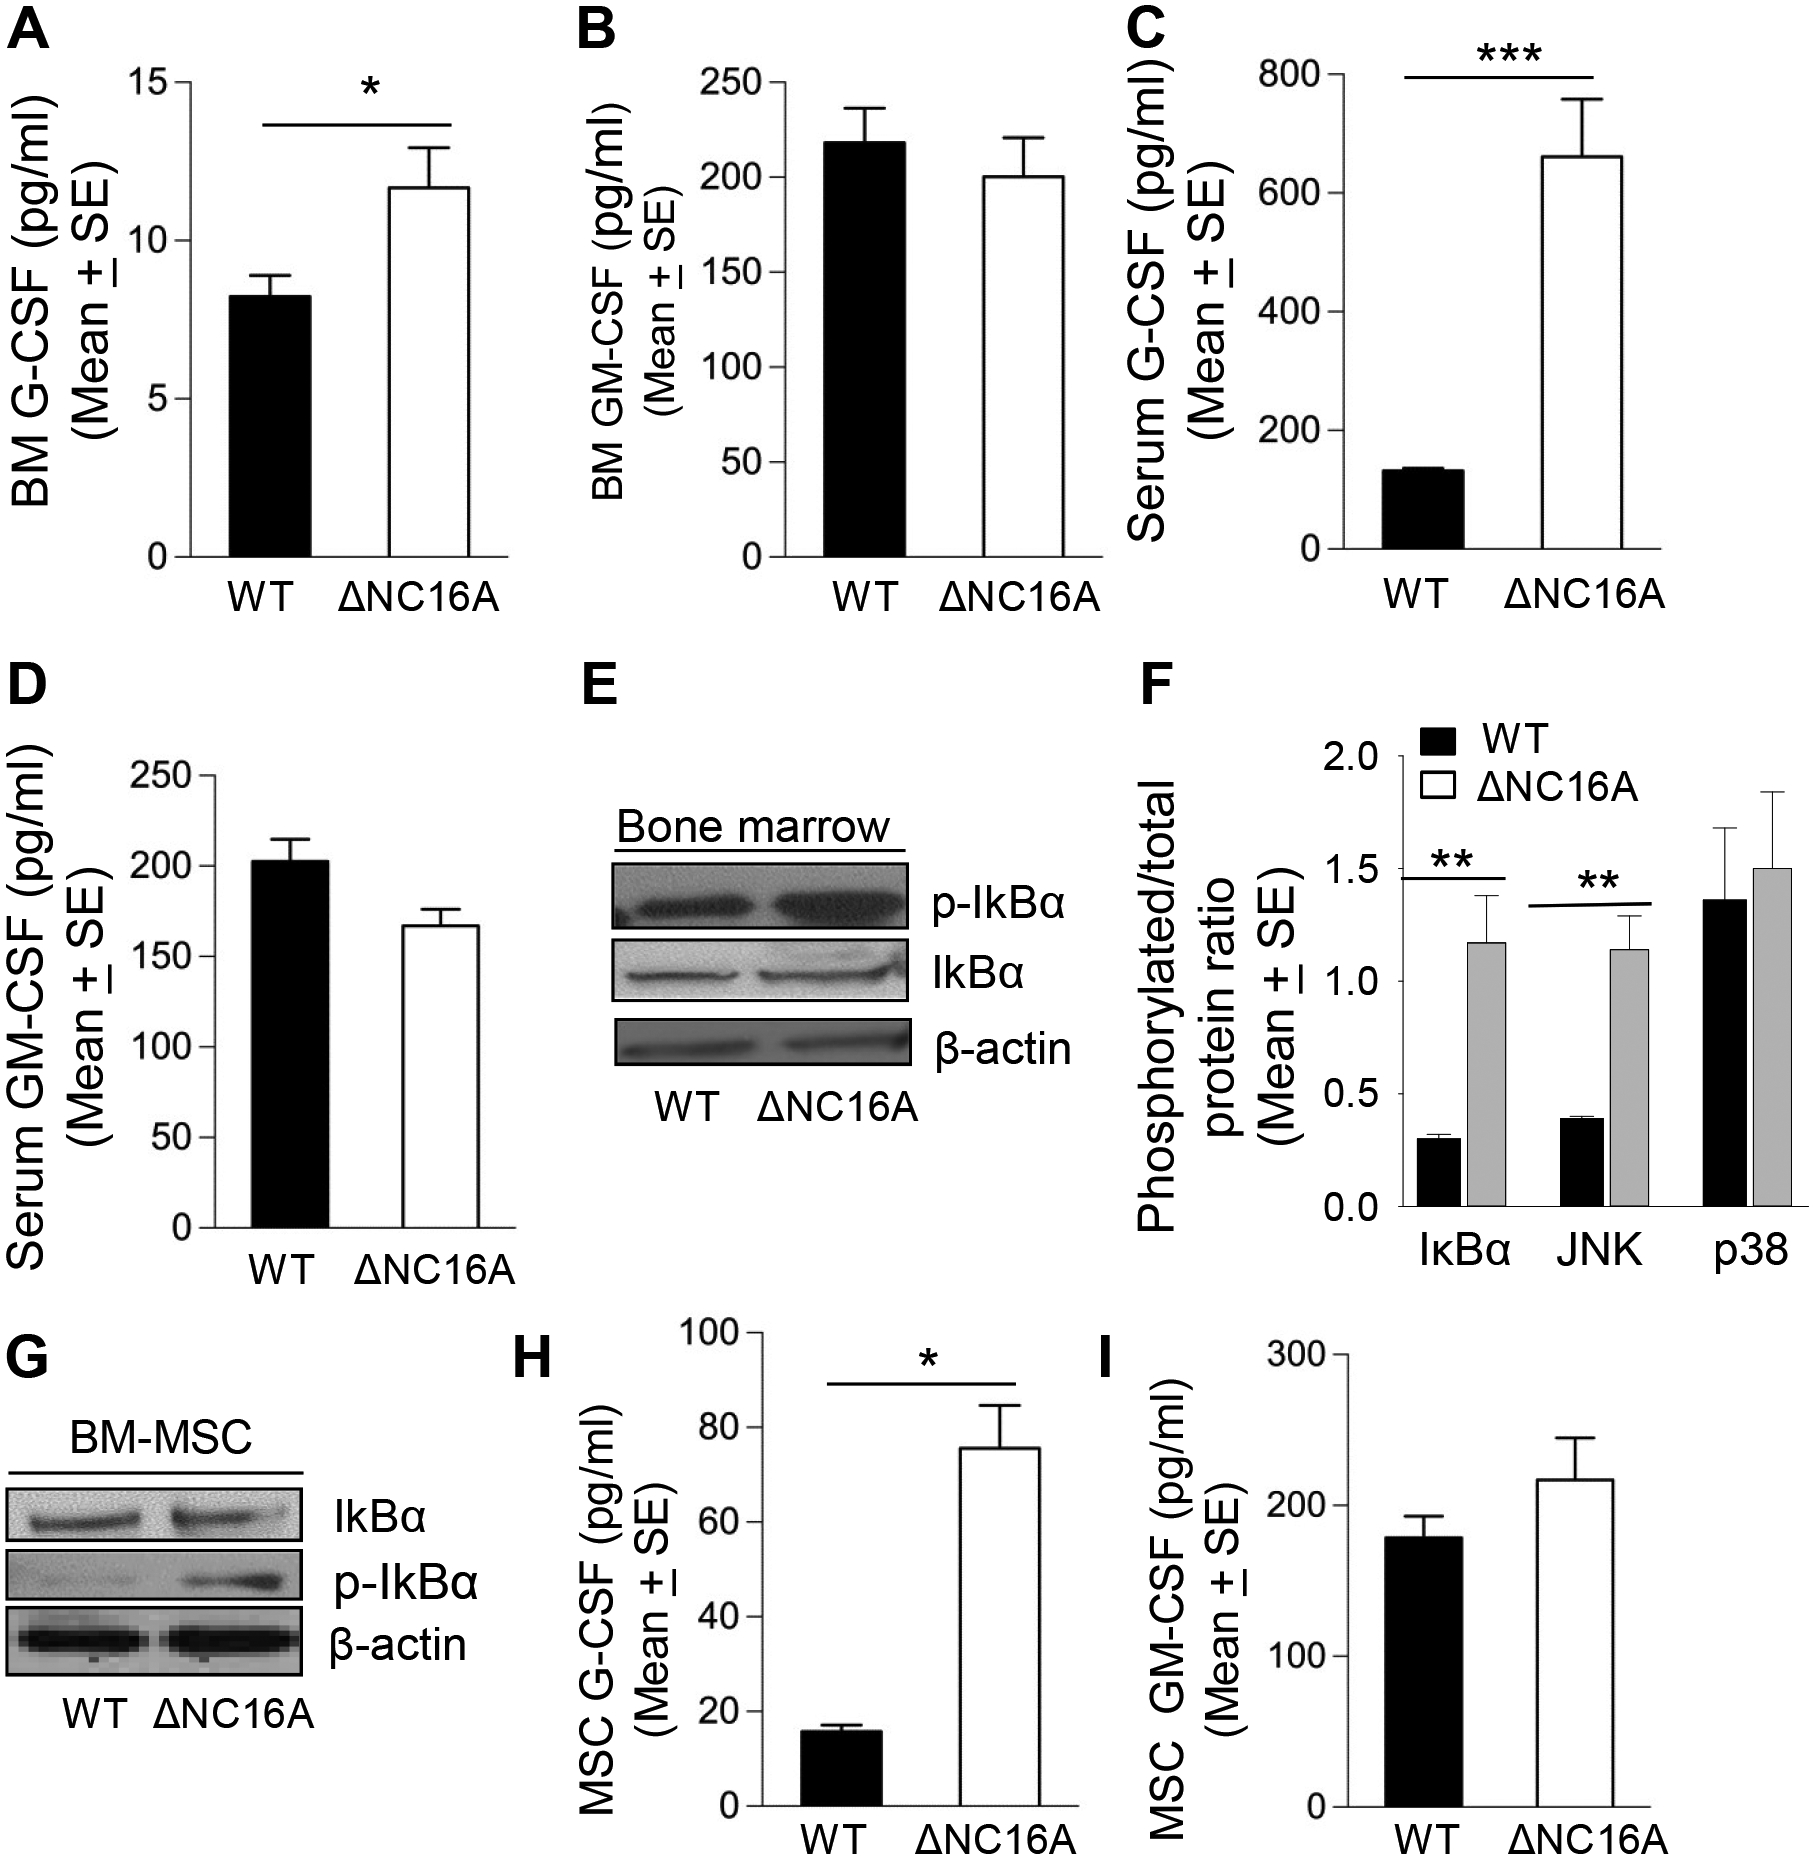
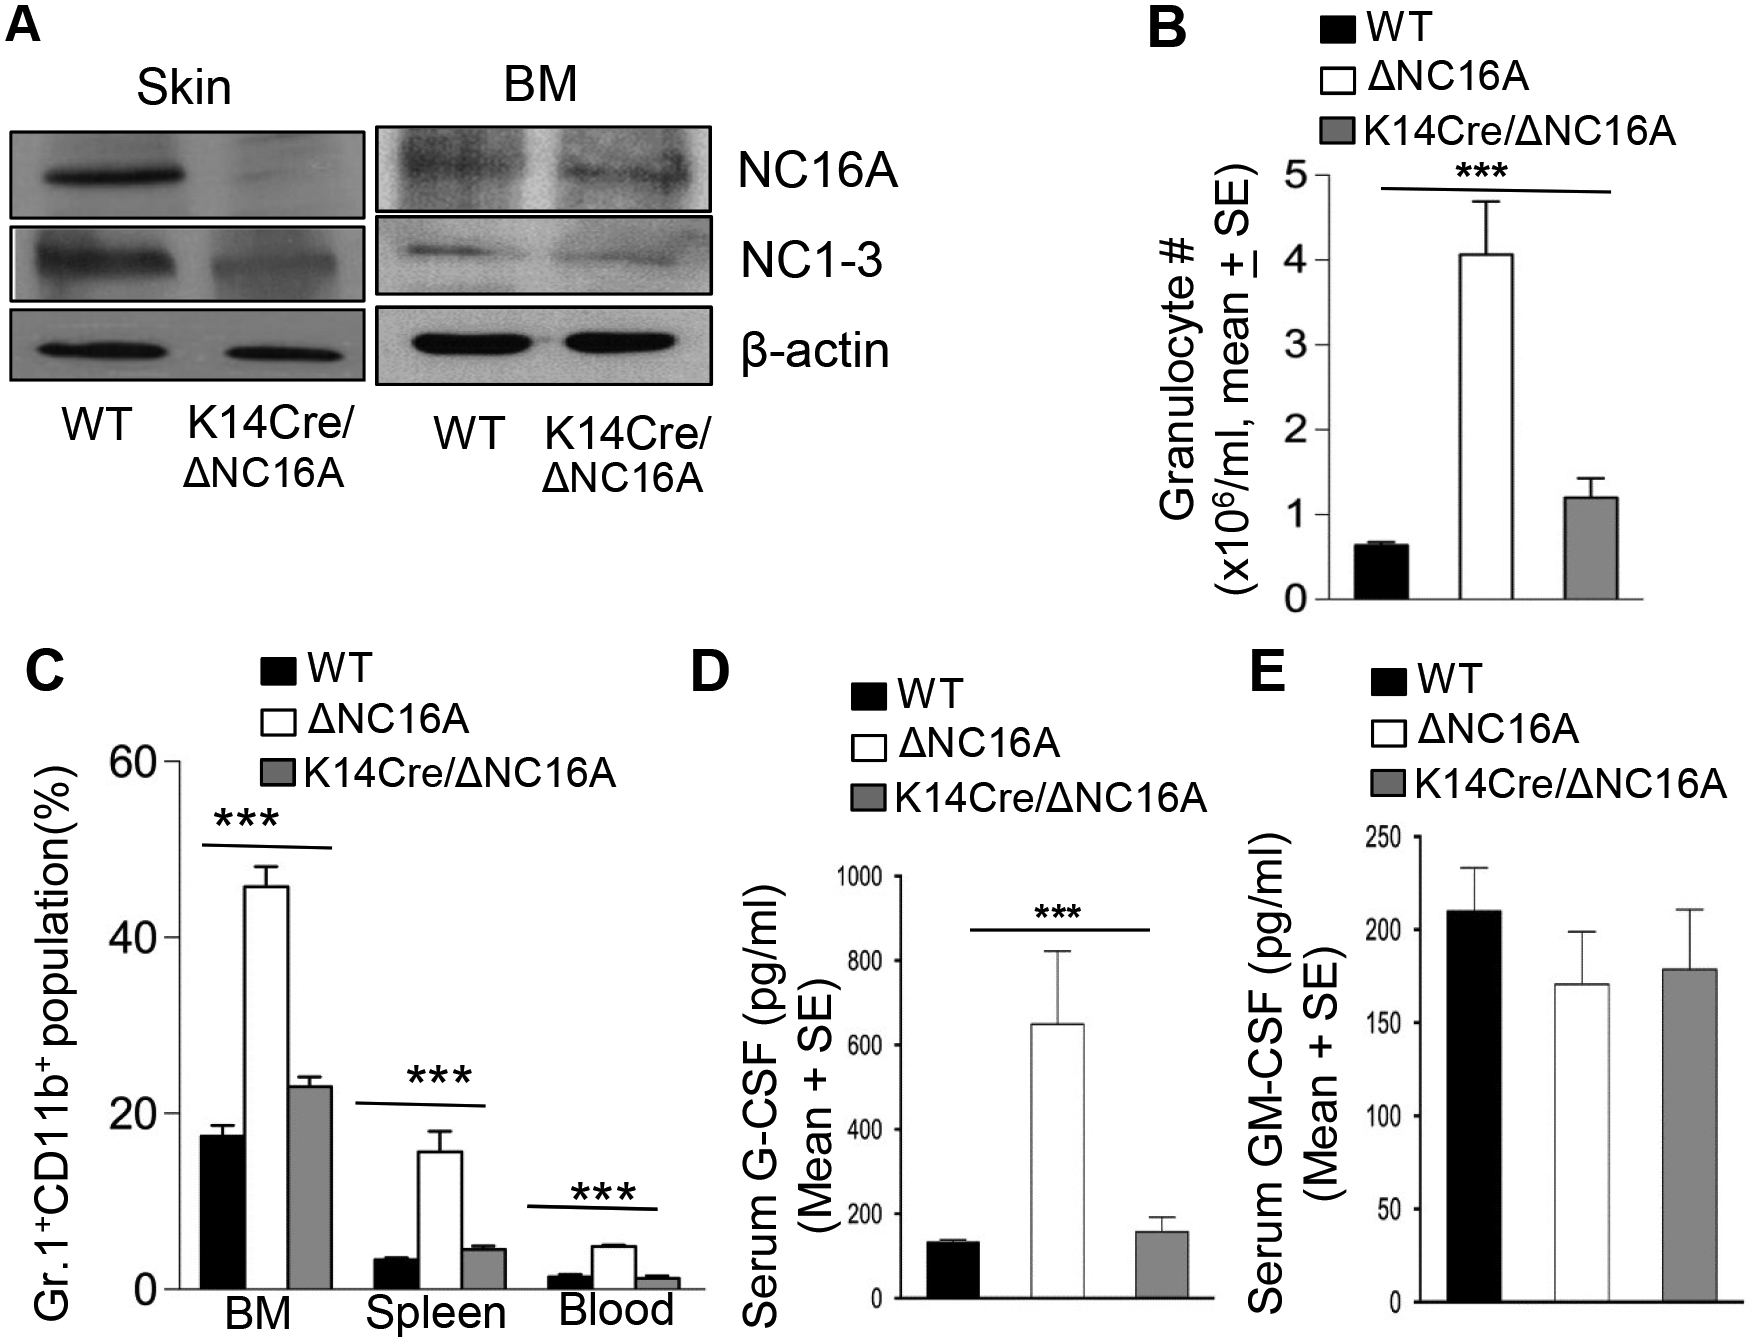
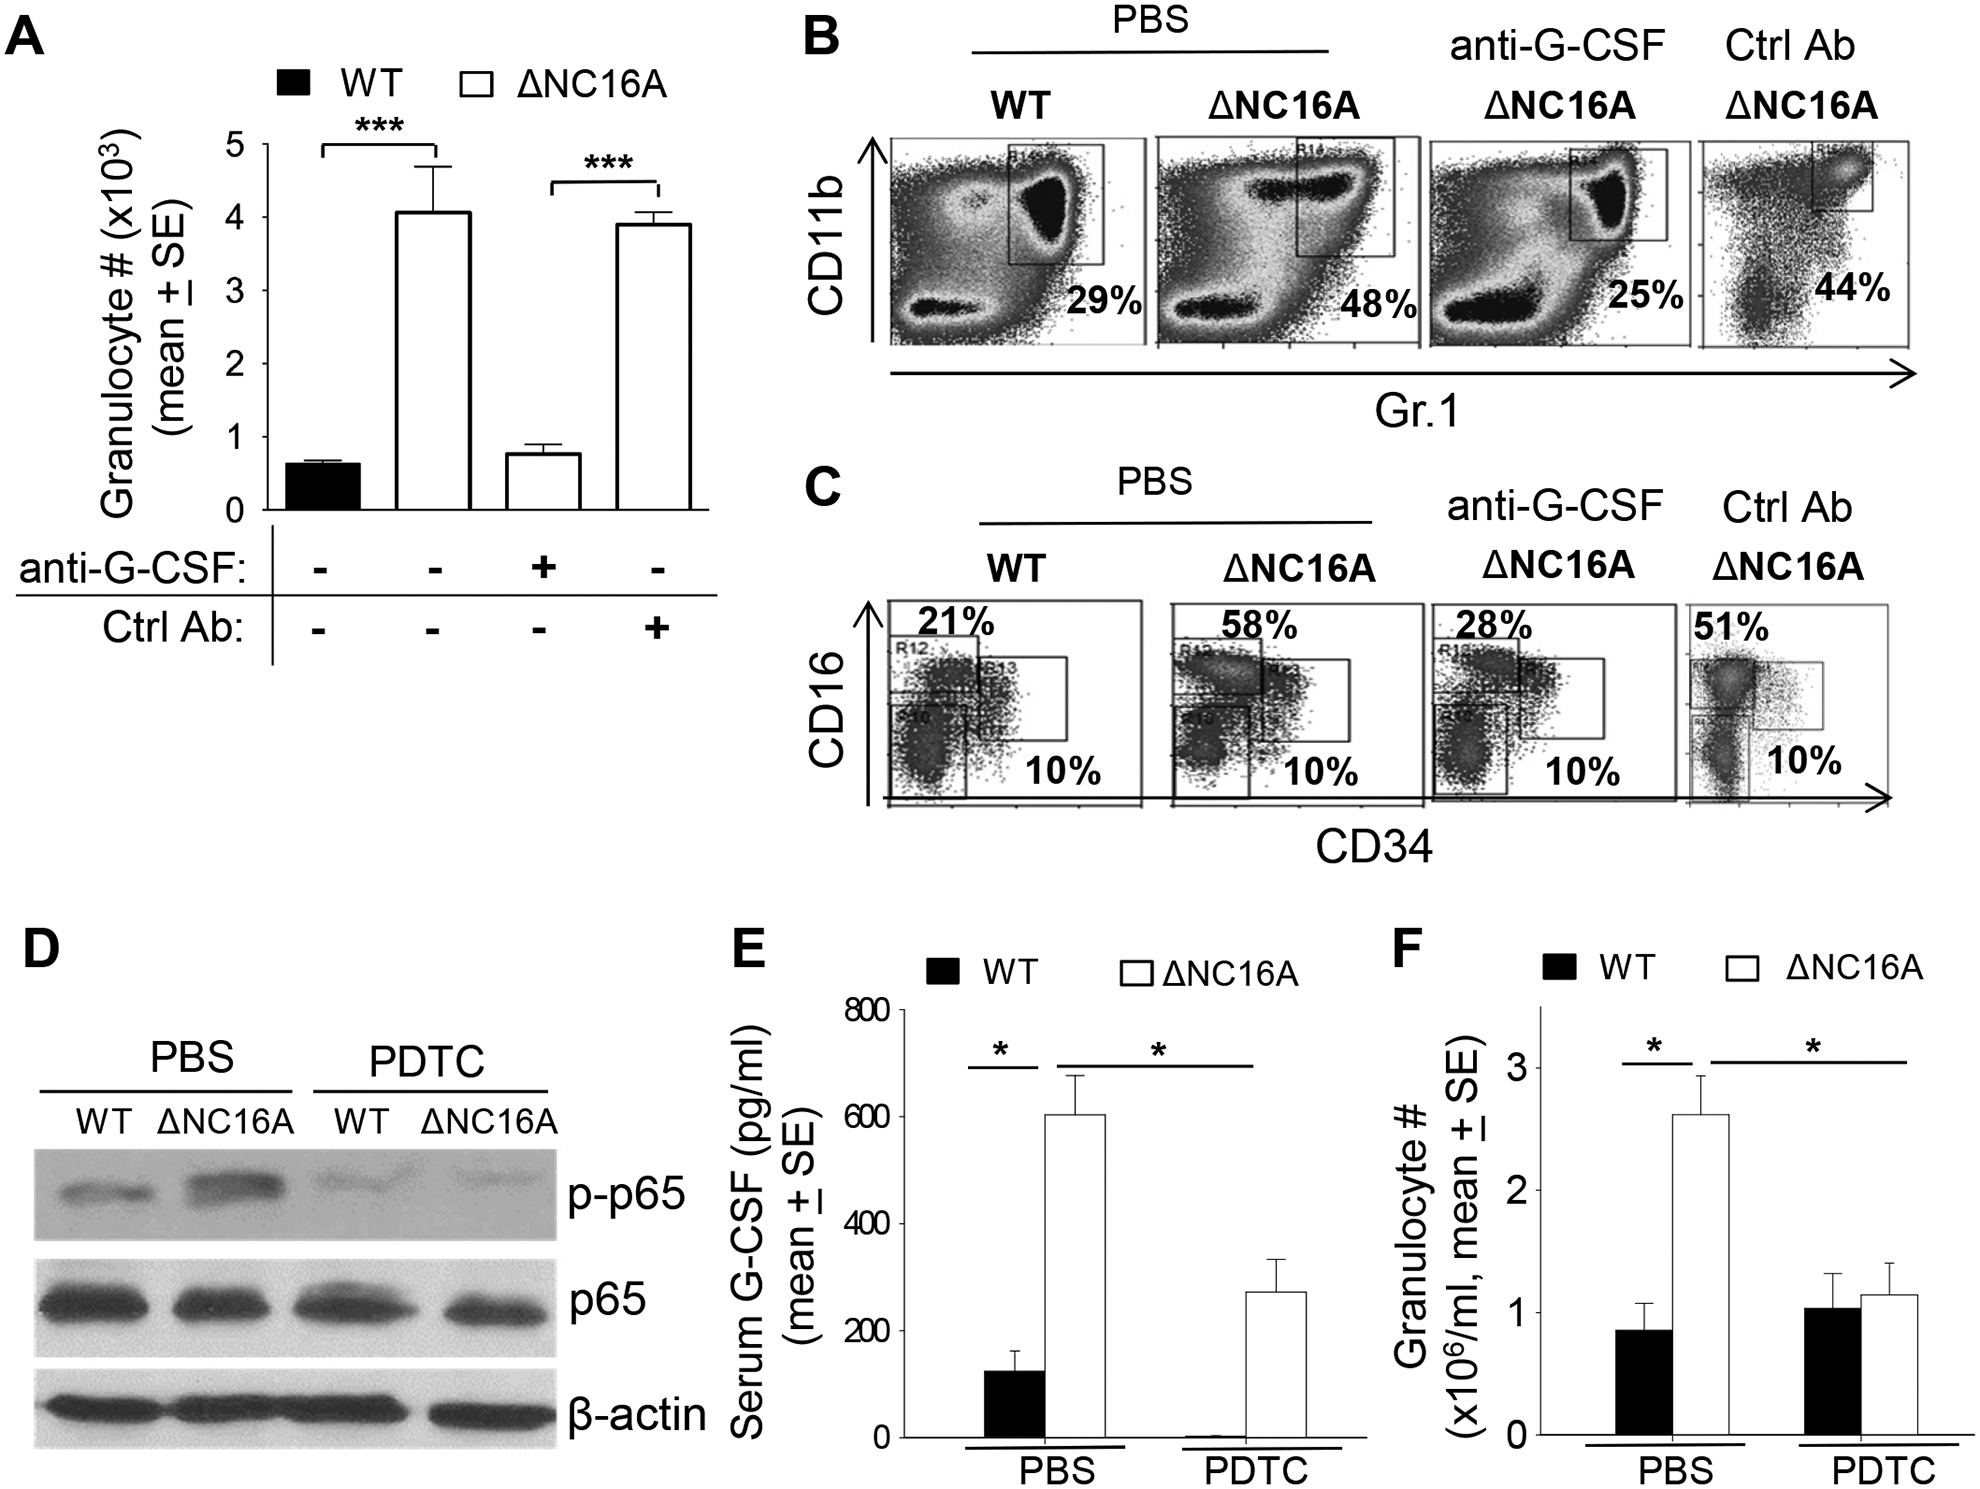
BP180 (also termed type XVII collagen) is a hemidesmosomal protein and plays a critical role in cell-cell matrix adhesion in the skin; however, its other biological functions are largely unclear. In this study, we generated a BP180 functional-deficient mouse strain by deleting its extracellular domain of humanized NC16A (termed ΔNC16A mice). We found that BP180 is expressed by bone marrow mesenchymal stem cells (BM-MSC), and its functional deficiency leads to myeloid hyperplasia. Altered granulopoiesis in ΔNC16A mice is through bone marrow stromal cells evidenced by bone marrow transplantation. Furthermore, the level of G-CSF in bone marrow and circulation were significantly increased in ΔNC16A mice as compared with wild-type mice. The increased G-CSF was accompanied by an increased activation of the NF-κB signaling pathway in bone marrow and BM-MSC of ΔNC16A mice. Blockade of G-CSF restored normal granulopoiesis in ΔNC16A mice. Inhibition of NF-κB signaling pathway significantly reduces the release of G-CSF from ΔNC16A BM-MSC in vitro and the level of serum G-CSF in ΔNC16A mice. To our knowledge, these findings provide the first direct evidence that BP180 plays an important role in granulopoiesis through regulating NF-κB signaling pathway in BM-MSC.


Figures

Figure 1.
Figure 1.. Granulocyte hyperplasia in ΔNC16A mice.
(A) Biopsy examination of spleen and bone. Representatives of gross anatomy of spleen and bone marrow of WT and ΔNC16A mice. Splenomegaly was observed in ΔNC16A mice at age of 8–12 weeks, and the bone of ΔNC16A mice was less red than WT mice. (B) Granulocyte infiltration. H/E staining showed increased granulocytes in blood, increased cellularity in bone marrow (BM), increased red pulp in spleen, and increased infiltrating granulocytes in dermis of ΔNC16A mice compared to WT mice. (C) Hematological examination. Complete blood count showed significantly increased white blood cells, granulocytes and monocytes in peripheral blood of ΔNC16A mice compared to WT mice (n=8, **p<0.01, ***p<0.001). WBC, white blood cell; Lym, lymphocyte; Mono, monocyte. (D) Relative cell population. Percentage of granulocyte populations was also increased significantly, while lymphocyte population was significantly decreased in peripheral blood of ΔNC16A mice compared to WT mice (n=8, ***p<0.001). (E) Granulocyte cell frequency. Granulocytes in bone marrow, spleen and blood of WT and ΔNC16A mice were analyzed by flow cytometry using forward scatter (cell size) and side scatter (granularity). Granulocyte populations in these three immune sites were around 3 folds increased in ΔNC16A mice than WT mice, and the increase was statistically significant (n=6, ***p<0.001). (F) Granulocyte cell number. Neutrophil numbers were quantified by flow cytometry using neutrophil specific surface markers CD11b and Gr-1. Neutrophils were significantly increased in ΔNC16A mice than WT mice, and the difference is statistically significant (n=6, **p<0.01).
Figure 2.
Figure 2.. Increased granulocyte-monocyte progenitor in ΔNC16A mice.
(A) Diagram showing different stages of granulopoiesis and surface markers expressed in different developmental stages. HSC, hematopoietic stem cell; MMP, multipotent progenitor; CMP, common myeloid progenitor; GMP, granulocyte-monocyte progenitor; MEP, megakaryocyte-erthrocyte progenitor. (B) Flow cytometry. Bone marrow cells were gated on Lin and IL-7R double negative cells, and c-Kit positive and Sca-1 negative cell population was used for further analysis. CD34 and CD16 were stained to distinguish GMP, CMP and MEP. Using LinSca-1 c-Kit+CD34+ CD16lo panel as common myeloid progenitor (CMP) population markers and Lin Sca-1 c-Kit+ CD16hi as granulocyte-monocyte progenitor(GMP) markers, GMP were more than 2 folds increased in bone marrow of ΔNC16A mice than WT. (C) Statistical analysis showed significantly increased GMP in bone marrow of ΔNC16A mice than WT, in contrast MEP were decreased in ΔNC16A mice than WT (n=6, ***p<0.001). (D) Bone marrow cells were cultured by methycellulose-based media, colonies were counted after 12 days culture. ΔNC16A mice have more granulocyte/monocyte colony-forming units (GM-CFU) than WT mice (n=6, ***p<0.001).
Figure 3.
Figure 3.. Granulocyte hyperplasia in ΔNC16A mice were caused by extrinsic factors.
(A) Diagram of bone marrow chimera experiment. Bone marrows from WT CD45.1 and ΔNC16A CD45.2 mice were mixed by 1:1 ratio and were transferred to sublethally irradiated(700cGy) recipient CD45.1.2 mice by i.v. Eight weeks post reconstitution, surface markers were used for determining different populations of cells by flow cytometry. Granulocyte populations from WT and ΔNC16A mice in bone marrow and spleen were comparable tested by forward scatter (cell size) and side scatter (granularity) (B) and by using granulocytes specific marker Gr-1+ (C). (D) Reciprocal transplantation experiment. WT CD45.1 bone marrow was transferred to sublethally irradiated (700cGy) recipient ΔNC16A CD45.2 mice, while ΔNC16A CD45.2 bone marrow was transferred to WT CD45.1 sublethally irradiated (700cGy) recipient mice. Total blood granulocytes were counted by hematological examination 8 weeks post bone marrow transplantation (50ul of blood were used for counting). WT recipients receiving bone marrow cells either from WT or ΔNC16A mice had normal granulocyte numbers, while ΔNC16A recipients receiving bone marrow cells either from WT or ΔNC16A mice exhibited significantly higher number of granulocytes (n=6, ***p<0.001). (E) Immunoblotting showed full-length BP180 in WT bone marrow and NC16A truncated BP180 in ΔNC16A bone marrow. (F) Indirect immunofluorescence exhibited anti-NC16A antibody staining in WT and not ΔNC16A bone marrow. (G) Immunoblotting identified BP180 in MSC and not granulocytes (GC) and lymphocytes (LC).
Figure 4.
Figure 4.. ΔNC16A mice showed elevated G-CSF level and increased activation of NF-κB signaling pathway in bone marrow.
ELISA assays revealed significantly elevated levels of G-CSF in bone marrow (A) and blood (B) of ΔNC16A mice as compared to WT control, whereas levels of GM-CSF in bone marrow (C) and blood (D) of both WT and ΔNC16A mice were compatible (n=8, *p<0.05, ***p<0.001). (E) Protein extracts made from total bone marrow cells (whole bone marrow flush) of WT and ΔNC16A mice were analyzed by immunoblotting. Higher levels of phospho-IκBα were seen in ΔNC16A mice than in WT mice. (F) Phosphorylated IκBα and JNK were significantly increased in bone marrow of ΔNC16A mice than in WT mice as determined by densitometry analysis of the phosphorylated vs. total signaling proteins (n=4, **p<0.01). (G) Bone marrow-derived mesenchymal stem cells (MSC) from ΔNC16A mice showed increased activation of NF-κB pathway. (H) ELISA assay of MSC culture medium revealed significantly higher levels of G-CSF in bone marrow derived MSC of ΔNC16A mice as compared to WT control (n=6, ***p<0.001). (I) Levels of bone marrow derived MSC-released GM-CSF were similar between WT and ΔNC16A mice.
Figure 5.
Figure 5.. K14Cre/ΔNC16A mice had normal granulopoiesis.
(A) Immunoblotting confirmed that keratinocyte-specific ΔNC16A (K14Cre/ΔNC16A) mice express NC16A truncated BP180 in the skin and full-length BP180 in bone marrow. (B) Hematological examination showed that K14Cre/ΔNC16A mice had significantly lower periphery granulocytes compared to ΔNC16A mice (n=6, ***p<0.001), which is similar to WT. (C) By flow cytometry for Gr.1 and CD11b double positive cell, K14Cre/ΔNC16A and WT mice had compatible granulocyte populations in bone marrow, spleen and blood, which are significantly lower than Gr1+CD11b+ cells in ΔNC16A mice (n=6, ***p<0.001). ELISA assays also revealed similar levels of serum G-CSF (D) and GM-CSF (E) between K14Cre/ΔNC16A and WT mice (n=6, ***p<0.001, K14Cre/ΔNC16A vs. ΔNC16A).
Figure 6.
Figure 6.. Blocking G-CSF and NF-κB restored normal granulopoiesis in ΔNC16A mice.
WT and ΔNC16A mice were i.p. treated with anti-G-CSF neutralizing antibody or matched control antibody. PBS-treated WT and ΔNC16A mice were also included as control. Granulocytes and granulocyte monocyte progenitor (GMP) were analyzed by hematological examination and flow cytometry at day 12 post treatment. (A) Complete cell count. Hematological test showed that anti-G-CSF antibody and not control antibody treatment reduced granulocyte population in ΔNC16A mice down to level similar to WT mice (n=6. ***p<0.001). (B) Flow cytometry using CD11b and Gr.1 surface markers showed that anti-G-CSF neutralizing antibody and not control antibody treatment restored granulocyte level in ΔNC16A mice comparable to WT control mice. (C) Flow cytometry using Lin, Sca-1, c-Kit CD16 and CD34 markers showed that GMP level in bone marrow of ΔNC16A mice was also restored to the level of WT control 12 days after anti-G-CSF antibody and not control antibody treatment. (D) WT and ΔNC16A mice were i.p injected daily for 7 days with PDTC or PBS vehicle control. (A) Western blotting showed that PDTC significantly reduced NF-κB activation (p65 phosphorylation) in bone marrow cells of ΔNC16A mice. (E) ELISA assay showed that PDTC treated ΔNC16A mice had serum G-CSF similar to WT control. (F) Hematological test showed that granulocyte level of PDTC treated ΔNC16A mice reduced to a similar level as WT mice (n=6, * p<0.05).

Similar articles

Cited by

References

    1. Hammers CM, and Stanley JR. 2016. Mechanisms of Disease: Pemphigus and Bullous Pemphigoid. Annu. Rev. Pathol. Mech. Dis 11: 175–197. - PMC - PubMed
    1. Koster J, Geerts D, Favre B, Borradori L, and Sonnenberg A. 2003. Analysis of the interactions between BP180, BP230, plectin and the integrin alpha6beta4 important for hemidesmosome assembly. J. Cell Sci 116: 387–399. - PubMed
    1. Hopkinson SB, and Jones JC. 2000. The N terminus of the transmembrane protein BP180 interacts with the N-terminal domain of BP230, thereby mediating keratin cytoskeleton anchorage to the cell surface at the site of the hemidesmosome. Mol Biol Cell 11: 277–286. - PMC - PubMed
    1. Margadant C, Frijns E, Wilhelmsen K, and Sonnenberg A. 2008. Regulation of hemidesmosome disassembly by growth factor receptors. Curr. Opin. Cell Biol 20: 589–596. - PubMed
    1. Diaz LA, Ratrie H, Saunders WS, Futamura S, Squiquera HL, Anhalt GJ, and Giudice GJ. 1990. Isolation of a human epidermal cDNA corresponding to the 180-kD autoantigen recognized by bullous pemphigoid and herpes gestationis sera: Immunolocalization of this protein to the hemidesmosome. J. Clin. Invest 86: 1088–1094. - PMC - PubMed

Publication types

MeSH terms

LinkOut - more resources