

Genetic variant effects on gene expression in human pancreatic islets and their implications for T2D
- PMID: 32999275
- PMCID: PMC7528108
- DOI: 10.1038/s41467-020-18581-8
Genetic variant effects on gene expression in human pancreatic islets and their implications for T2D
Abstract
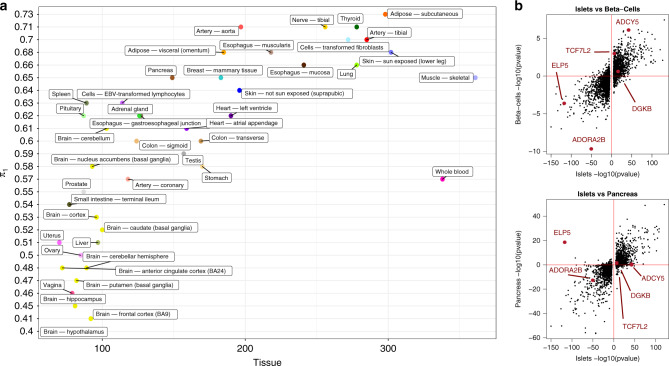
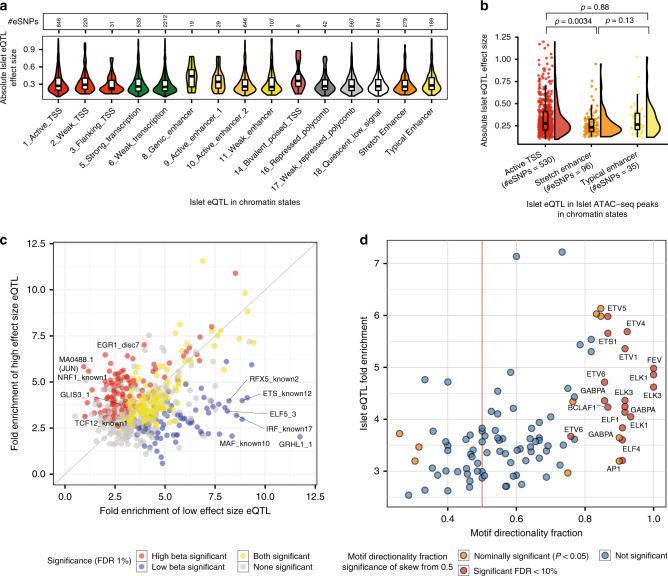
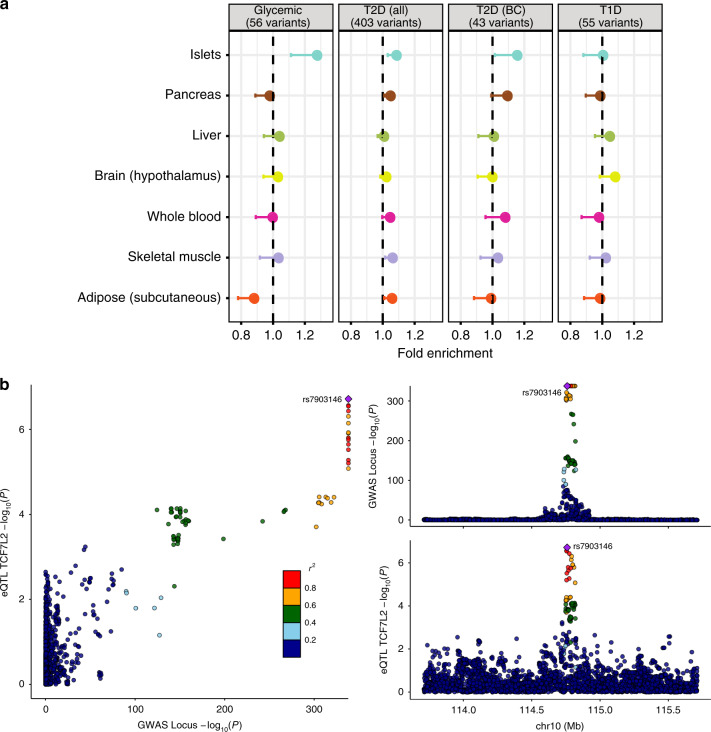
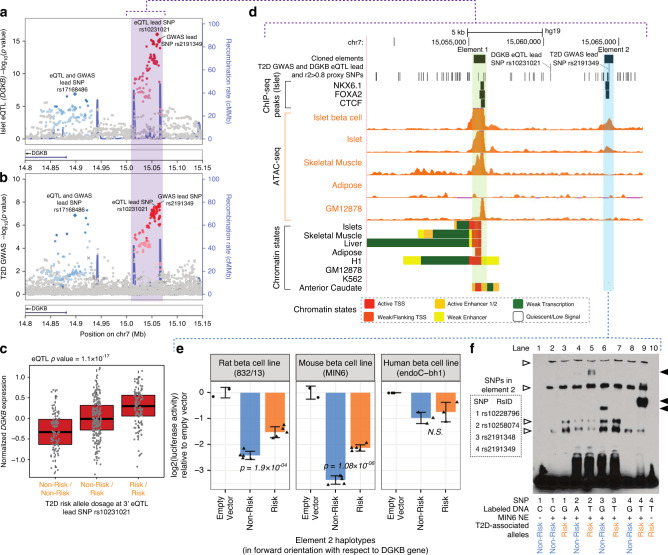
Most signals detected by genome-wide association studies map to non-coding sequence and their tissue-specific effects influence transcriptional regulation. However, key tissues and cell-types required for functional inference are absent from large-scale resources. Here we explore the relationship between genetic variants influencing predisposition to type 2 diabetes (T2D) and related glycemic traits, and human pancreatic islet transcription using data from 420 donors. We find: (a) 7741 cis-eQTLs in islets with a replication rate across 44 GTEx tissues between 40% and 73%; (b) marked overlap between islet cis-eQTL signals and active regulatory sequences in islets, with reduced eQTL effect size observed in the stretch enhancers most strongly implicated in GWAS signal location; (c) enrichment of islet cis-eQTL signals with T2D risk variants identified in genome-wide association studies; and (d) colocalization between 47 islet cis-eQTLs and variants influencing T2D or glycemic traits, including DGKB and TCF7L2. Our findings illustrate the advantages of performing functional and regulatory studies in disease relevant tissues.
Conflict of interest statement
M.I.M. has served on advisory panels for Pfizer, Novo Nordisk, and Zoe Global; received honoraria from Merck, Pfizer, Novo Nordisk, and Eli Lilly; and received research funding from Abbvie, Astra Zeneca, Boehringer Ingelheim, Eli Lilly, Janssen, Merck, Novo Nordisk, Pfizer, Roche, Sanofi Aventis, Servier, and Takeda. As of June 2019, he is an employee of Genentech, and a holder of Roche stock. M.v.d.B. is an employee of Novo Nordisk A/S, although all experimental work was carried out under employment at the University of Oxford.
Figures
Similar articles
-
Genetic regulatory signatures underlying islet gene expression and type 2 diabetes.Proc Natl Acad Sci U S A. 2017 Feb 28;114(9):2301-2306. doi: 10.1073/pnas.1621192114. Epub 2017 Feb 13. Proc Natl Acad Sci U S A. 2017. PMID: 28193859 Free PMC article.
-
Modeling islet enhancers using deep learning identifies candidate causal variants at loci associated with T2D and glycemic traits.Proc Natl Acad Sci U S A. 2023 Aug 29;120(35):e2206612120. doi: 10.1073/pnas.2206612120. Epub 2023 Aug 21. Proc Natl Acad Sci U S A. 2023. PMID: 37603758 Free PMC article.
-
Multi-omics analysis for identifying cell-type-specific and bulk-level druggable targets in Alzheimer's disease.J Transl Med. 2025 Jul 13;23(1):788. doi: 10.1186/s12967-025-06739-1. J Transl Med. 2025. PMID: 40653482 Free PMC article.
-
The role of global and regional DNA methylation and histone modifications in glycemic traits and type 2 diabetes: A systematic review.Nutr Metab Cardiovasc Dis. 2016 Jul;26(7):553-566. doi: 10.1016/j.numecd.2016.04.002. Epub 2016 Apr 14. Nutr Metab Cardiovasc Dis. 2016. PMID: 27146363
-
Effect of TCF7L2 on the relationship between lifestyle factors and glycemic parameters: a systematic review.Nutr J. 2022 Sep 26;21(1):59. doi: 10.1186/s12937-022-00813-w. Nutr J. 2022. PMID: 36155628 Free PMC article.
Cited by
-
The landscape of GWAS validation; systematic review identifying 309 validated non-coding variants across 130 human diseases.BMC Med Genomics. 2022 Apr 1;15(1):74. doi: 10.1186/s12920-022-01216-w. BMC Med Genomics. 2022. PMID: 35365203 Free PMC article.
-
Whole genome sequence association analysis of fasting glucose and fasting insulin levels in diverse cohorts from the NHLBI TOPMed program.Commun Biol. 2022 Jul 28;5(1):756. doi: 10.1038/s42003-022-03702-4. Commun Biol. 2022. PMID: 35902682 Free PMC article.
-
Functional interrogation of twenty type 2 diabetes-associated genes using isogenic human embryonic stem cell-derived β-like cells.Cell Metab. 2023 Nov 7;35(11):1897-1914.e11. doi: 10.1016/j.cmet.2023.09.013. Epub 2023 Oct 18. Cell Metab. 2023. PMID: 37858332 Free PMC article.
-
Human pancreatic islet microRNAs implicated in diabetes and related traits by large-scale genetic analysis.Proc Natl Acad Sci U S A. 2023 Feb 14;120(7):e2206797120. doi: 10.1073/pnas.2206797120. Epub 2023 Feb 9. Proc Natl Acad Sci U S A. 2023. PMID: 36757889 Free PMC article.
-
A Transcription Start Site Map in Human Pancreatic Islets Reveals Functional Regulatory Signatures.Diabetes. 2021 Jul;70(7):1581-1591. doi: 10.2337/db20-1087. Epub 2021 Apr 13. Diabetes. 2021. PMID: 33849996 Free PMC article.
References
Publication types
MeSH terms
Substances
Grants and funding
- 098381/WT_/Wellcome Trust/United Kingdom
- Z01 HG000024/ImNIH/Intramural NIH HHS/United States
- U01 DK085545/DK/NIDDK NIH HHS/United States
- 203141/WT_/Wellcome Trust/United Kingdom
- R01 DK072193/DK/NIDDK NIH HHS/United States
- T32 HG000040/HG/NHGRI NIH HHS/United States
- 095101/WT_/Wellcome Trust/United Kingdom
- ZIA HG000024/ImNIH/Intramural NIH HHS/United States
- 212259/WT_/Wellcome Trust/United Kingdom
- R01 MH090941/MH/NIMH NIH HHS/United States
- P30 DK020572/DK/NIDDK NIH HHS/United States
- U01 DK105561/DK/NIDDK NIH HHS/United States
- 200837/Z/16/Z/WT_/Wellcome Trust/United Kingdom
- R01 MH101814/MH/NIMH NIH HHS/United States
- R00 DK092251/DK/NIDDK NIH HHS/United States
- R00 DK099240/DK/NIDDK NIH HHS/United States
- 200837/WT_/Wellcome Trust/United Kingdom
- NF-SI-0617-10090/DH_/Department of Health/United Kingdom
- 106130/WT_/Wellcome Trust/United Kingdom
- MR/L020149/1/MRC_/Medical Research Council/United Kingdom
- R01 DK062370/DK/NIDDK NIH HHS/United States
- U01 DK105535/DK/NIDDK NIH HHS/United States
- U01 DK062370/DK/NIDDK NIH HHS/United States
- 090532/WT_/Wellcome Trust/United Kingdom
- K99 DK092251/DK/NIDDK NIH HHS/United States
- R01 DK117960/DK/NIDDK NIH HHS/United States
LinkOut - more resources
Full Text Sources
Medical
Molecular Biology Databases
