. 2020 Sep 30;10(1):334.
doi: 10.1038/s41398-020-01008-9.

Fluoxetine-induced recovery of serotonin and norepinephrine projections in a mouse model of post-stroke depression

Affiliations

Fluoxetine-induced recovery of serotonin and norepinephrine projections in a mouse model of post-stroke depression

Amin Zahrai et al. Transl Psychiatry. .

Abstract

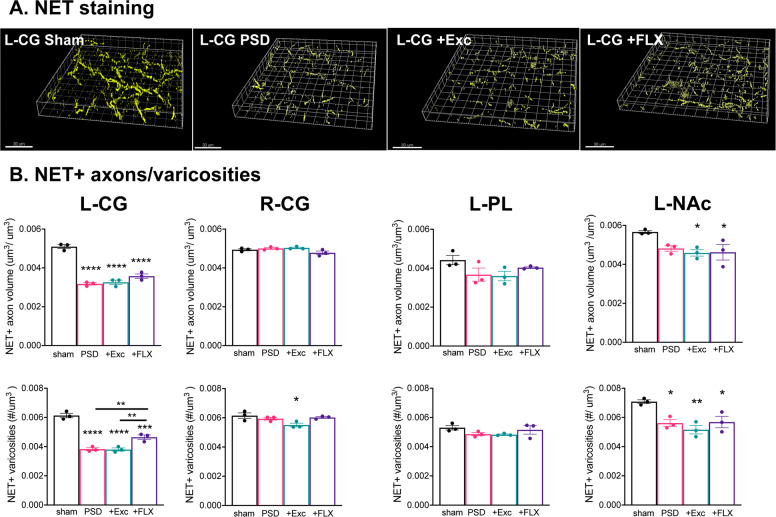
Chronic treatment with fluoxetine (FLX) is required for its antidepressant effects, but the role of serotonin (5-HT) axonal plasticity in FLX action is unknown. To address this, we examined mice with a stroke in the left medial prefrontal cortex (mPFC) resulting in persistent anxiety-like and depression-like behaviors and memory deficits as a model of post-stroke depression. Chronic treatment with FLX (but not exercise) completely reversed the behavioral phenotype and partially reversed changes in FosB-labeled cells in the mPFC, nucleus accumbens, septum, hippocampus, basolateral amygdala (BLA), and dorsal raphe. In these regions, 5-HT or norepinephrine (NE) innervation was quantified by staining for 5-HT or NE transporters, respectively. 5-HT synapses and synaptic triads were identified as synaptophysin-stained sites on 5-HT axons located proximal to gephyrin-stained or PSD95-stained spines. A week after stroke, 5-HT innervation was greatly reduced at the stroke site (left cingulate gyrus (CG) of the mPFC) and the left BLA. Chronically, 5-HT and NE innervation was reduced at the left CG, nucleus accumbens, and BLA, with no changes in other regions. In these areas, pre-synaptic and post-synaptic 5-HT synapses and triads to inhibitory (gephyrin+) sites were reduced, while 5-HT contacts at excitatory (PSD95+) sites were reduced in the CG and prelimbic mPFC. Chronic FLX, but not exercise, reversed these reductions in 5-HT innervation but incompletely restored NE projections. Changes in 5-HT innervation were verified using YFP staining in mice expressing YFP-tagged channelrhodopsin in 5-HT neurons. Thus, FLX-induced 5-HT axonal neuroplasticity of forebrain projections may help mediate recovery from brain injury.


Conflict of interest statement

The authors declare that they have no conflict of interest.

Figures

Fig. 1
Fig. 1. Chronic FLX but not exercise reverses stroke-induced loss of 5-HT projections.
Brain tissues from our previous study were used. Timeline (days): Male C57BL6 mice were individually housed (Housing), microinjected at 11 weeks old with vehicle (Sham-Ctrl) or ET-1 (PSD) in the left mPFC (surg); lesions were verified (MRI); and anxiety like phenotype assessed using the elevated plus maze test (EPM). Then the PSD mice were treated with free running wheel (+Exc) or fluoxetine (+FLX), with fixed wheel and vehicle (Veh) as control (PSD) and compared to Sham-ctrl. Behavioral assays included EPM, open field (OF), forced swim (FST), tail suspension (TS), and novelty suppressed feeding tests (NSF) followed by the Morris water maze spatial memory test (MWM). The mice were then sacrificed (day 50), perfused, and brains recovered, sectioned, and immunofluorescence done on a randomly chosen subset of 4 brains/group as presented below. The PSD mice displayed increase anxiety-like and depression-like behaviors and impaired spatial memory; these phenotypes were reversed with FLX, but not Exc treatment. a Chronic FLX but not exercise (Exc) reverses the reduction in 5-HT projections in the lesion site at 6 weeks post-stroke. Shown are representative reconstructed flattened confocal images of SERT-stained sections of the ipsilesional (left, L) cingulate gyrus (CG) at ×63 magnification. Scale bar, 10 μm. b Quantification of total SERT+ axonal volume normalized to tissue volume. c Quantification of 5-HT varicosity number normalized to tissue volume. Quantification is shown for the ipsilesional (left, L) and contralesional (right, R) CG, left basolateral amygdala (L-BLA) and left nucleus accumbens (L-NAc) of Sham control, PSD, PSD+Exc, and PSD+FLX mice (n = 4). See Supplementary Fig. 3A for additional right brain data. Data are shown as mean ± SEM; *p < 0.05, **p < 0.01, ***p < 0.001, ****p < 0.0001 compared to sham or as indicated; one-way analysis of variance (Tukey’s post-hoc).
Fig. 2
Fig. 2. Chronic FLX induces recovery of ChR2-YFP-labeled 5-HT projections in PSD mice.
Timeline (days): Pet-ChR2 mice expressing ChR2-YFP only in 5-HT neurons were single housed (Housing), given stroke (n = 9) or sham (n = 3) surgery in the left mPFC at day 0 (surg), as done previously (Fig. 1). The mice were examined by 7 T MRI (day 4) and EPM tests before and after stroke (EPM1, EPM2) to verify lesion site and anxiety behavior, an early marker of the PSD phenotype in this model (Supplementary Fig. 2). Three of the PSD mice were sacrificed 6 h after EPM2 (7 day, sac1). The remaining sham and stroke mice were treated with vehicle (drinking water), or half of the stroke mice with 18 mg/kg/day FLX in drinking water (+FLX) for 6 weeks post stroke and sacrificed (sac2). Representative reconstructed ×63 confocal images of left cingulate gyrus of mPFC (L CG) a and L BLA b are shown above, with quantification of left and right sides shown below. Brain sections from sham control mice, 7 days post stroke, PSD and PSD + FLX were co-stained for SERT (red) and YFP (green) to visualize SERT + ChR2-YFP-expressing 5-HT projections. At one week post-stroke there was a loss of both SERT and YFP staining in the left CG a and left BLA b compared to the sham ctrl, with no changes in the right brain regions (see Supplementary Fig. 3B). After 6 weeks, the reduction persisted (PSD) with a complete recovery of SERT-positive and YFP-positive projections after FLX (+FLX) in left CG and BLA compared to sham. Colocalization of YFP/SERT staining was reconstructed using Imaris software and was extensive with a ratio of SERT/YFP+ to total SERT+ processes of 0.9 that did not differ among groups. Size bar, 30 µm. Bars represent mean ± SEM (n = 3), ****p < 0.0001 compared to sham or as indicated; one-way analysis of variance (Tukey’s post-hoc).
Fig. 3
Fig. 3. Chronic FLX but not exercise reverses stroke-induced reductions in 5-HT synapses.
Above: representative reconstructed ×63 confocal images of left mPFC (CG) from sham control co-stained for SERT (green), synaptophysin (blue), and gephryn (red) or PSD95 (purple) to visualize 5-HT synapses with inhibitory and excitatory synapses (within 0.6 µm, circled), respectively, distinct from non-5-HT synapses (dashed circles); synaptophysin, gephyrin, and PSD95 boutons are reconstructed using Imaris software. Size bars, 20 and 8 µm. Below: 5-HT synapses to excitatory and inhibitory synapses were quantified in both ipsilesional left and contralesional right CG, left BLA and left PL of sham, or stroke (PSD), exercise- (+Exc) or FLX-treated (+FLX) stroke mice. a Quantification of 5-HT synapses to inhibitory synapses. Sections were co-stained for SERT, synaptophysin and gephyrin; SERT/synaptophysin+ boutons within 0.6 μm of gephyrin+ puncta were quantified and normalized to tissue volume. b Quantification of 5-HT synapses to excitatory synapses. Sections were co-stained for SERT, synaptophysin and PSD95: SERT/synaptophysin+ boutons within 0.6 μm of PSD95+ puncta were quantified and normalized to tissue volume. Data for right BLA and PL are in Supplementary Fig. 6A. Bars represent mean ± SEM (n = 4). *p < 0.05, **p < 0.01, ***p < 0.001, ****p < 0.0001; one-way analysis of variance (Tukey’s post-hoc).
Fig. 4
Fig. 4. Chronic FLX but not exercise reverses stroke-induced reductions in excitatory and inhibitory 5-HT triadic synapses.
Sections were stained for SERT, synaptophysin and either gephyrin (5-HT inhibitory triads) or PSD95 (5-HT excitatory triads). Above: models showing inhibitory or excitatory pre- and post-synaptic triads. Below: quantification of 5-HT triads is shown for ipsilesional left CG and BLA in sham, or stroke (PSD), exercise- (PSD + Exc) or FLX-treated (PSD + FLX) stroke (see Supplementary Fig. 6B for right CG, BLA). a Inhibitory 5-HT Triads. Synaptophysin/SERT+ boutons within 0.6 μm of inhibitory (SERT−/synaptophysin+ boutons within 0.6 µm of gephyrin+ puncta) synapses were quantified and normalized to tissue volume. b Excitatory 5-HT Triads. Synaptophysin+ boutons within SERT+ fibers located within a distance of 0.6 μm of excitatory (SERT−/synaptophysin+ boutons within 0.6 µm of PSD95+ puncta) were quantified and normalized to tissue volume. Bars represent mean ± SEM (n = 4). *p < 0.05, **p < 0.01, ***p < 0.001, ****p < 0.0001; One-way analysis of variance (Tukey’s post-hoc).
Fig. 5
Fig. 5. Loss of norepinephrine projections after stroke is partially restored by chronic FLX treatment.
a Chronic FLX incompletely reverses the reduction in NE projections at the lesion site at 6 weeks post-stroke. Shown are representative reconstructed confocal images of NET-stained sections of the ipsilesional (left, L) cingulate gyrus (CG), prelimbic cortex (PL), and nucleus accumbens (NAc) of sham, post-stroke (PSD), and chronic FLX-treated post-stroke (FLX) mice (×63 magnification). Scale bar is 30 μm. b Quantification of total NET+ axonal volume normalized to tissue volume (above) and of NET+ varicosity number normalized to tissue volume (below). Quantifications represent the left and right CG, left PL and left NAc of Sham control, or vehicle-treated (PSD), exercise-treated (+Exc) or FLX-treated (+FLX) stroke mice (n = 3), shown as mean ± SEM. See Supplementary Fig. 6C for right PL and NAc data. *p < 0.05, **p < 0.01, ***p < 0.001, ****p < 0.0001; one-way analysis of variance (Tukey’s post-hoc).

Similar articles

Cited by

References

    1. Whiteford HA, et al. Global burden of disease attributable to mental and substance use disorders: findings from the Global Burden of Disease Study 2010. Lancet. 2013;382:1575–1586. doi: 10.1016/S0140-6736(13)61611-6. - DOI - PubMed
    1. WHO. Depression and Other Common Mental Disorders: Global Health Estimates (World Health Organization, Geneva, Switzerland, 2017).
    1. Ayerbe L, Ayis S, Wolfe CD, Rudd AG. Natural history, predictors and outcomes of depression after stroke: systematic review and meta-analysis. Br. J. Psychiatry. 2013;202:14–21. doi: 10.1192/bjp.bp.111.107664. - DOI - PubMed
    1. Hackett ML, Pickles K. Part I: frequency of depression after stroke: an updated systematic review and meta-analysis of observational studies. Int. J. Stroke. 2014;9:1017–1025. doi: 10.1111/ijs.12357. - DOI - PubMed
    1. Jorgensen TS, et al. Incidence of depression after stroke, and associated risk factors and mortality outcomes, in a Large Cohort of Danish patients. JAMA Psychiatry. 2016;73:1032–1040. doi: 10.1001/jamapsychiatry.2016.1932. - DOI - PubMed

Publication types