. 2020 Sep 30;10(1):16136.
doi: 10.1038/s41598-020-73014-2.

Deciphering heterogeneity of septic shock patients using immune functional assays: a proof of concept study

Affiliations

Deciphering heterogeneity of septic shock patients using immune functional assays: a proof of concept study

Chloé Albert Vega et al. Sci Rep. .

Abstract

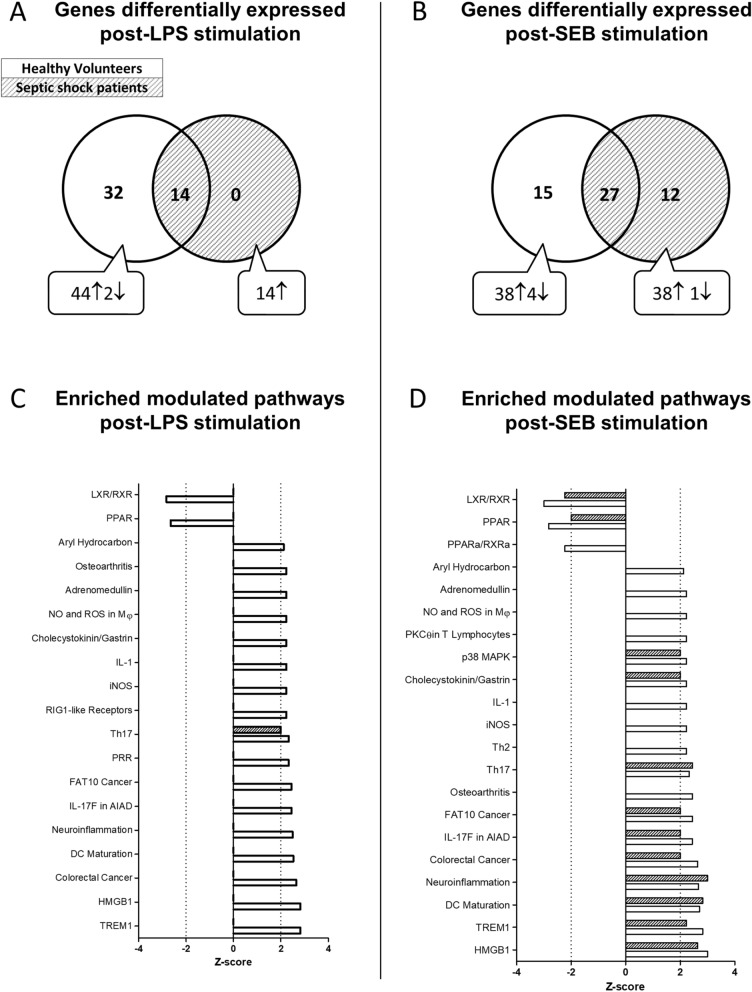
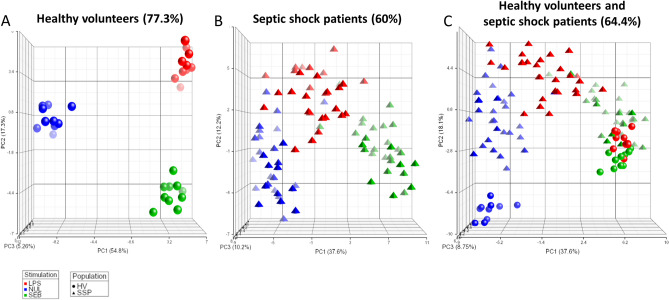
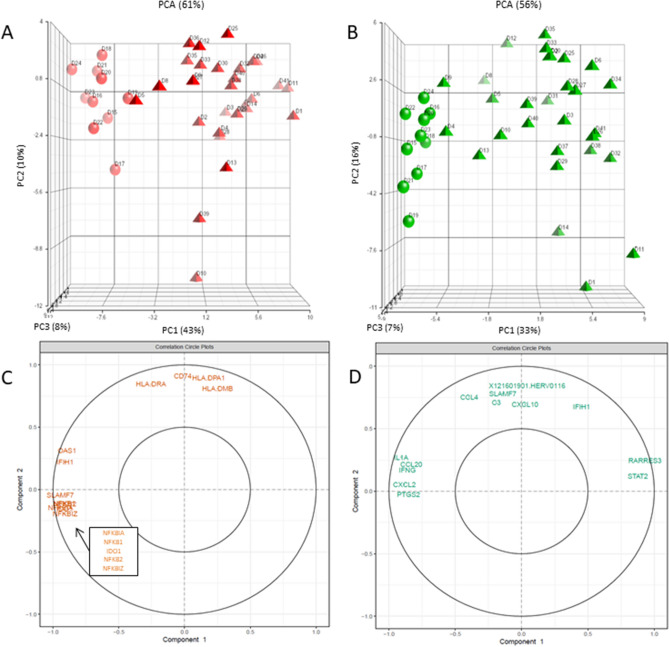
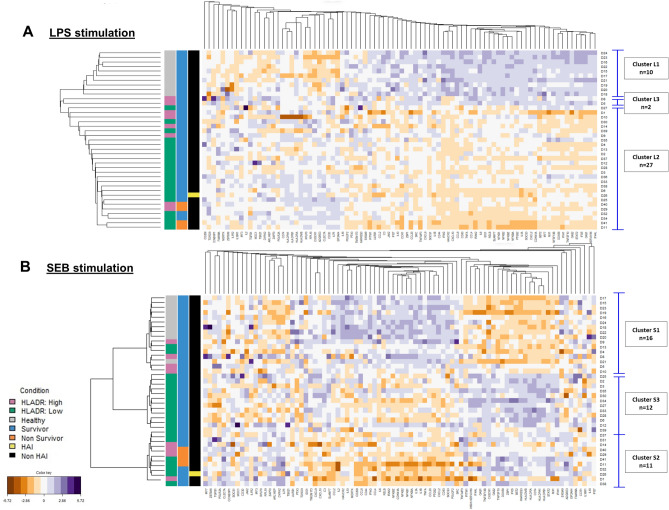
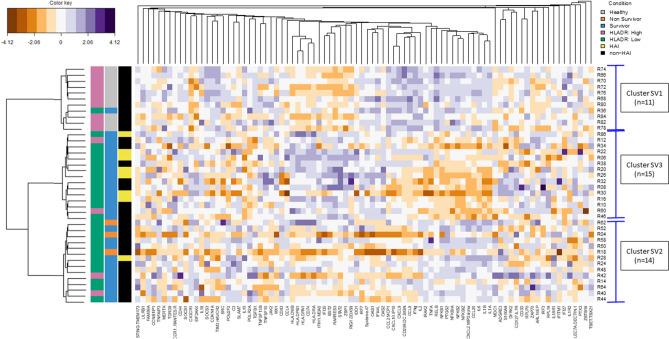
The complexity of sepsis pathophysiology hinders patient management and therapeutic decisions. In this proof-of-concept study we characterised the underlying host immune response alterations using a standardised immune functional assay (IFA) in order to stratify a sepsis population. In septic shock patients, ex vivo LPS and SEB stimulations modulated, respectively, 5.3% (1/19) and 57.1% (12/21) of the pathways modulated in healthy volunteers (HV), highlighting deeper alterations induced by LPS than by SEB. SEB-based clustering, identified 3 severity-based groups of septic patients significantly different regarding mHLA-DR expression and TNFα level post-LPS, as well as 28-day mortality, and nosocomial infections. Combining the results from two independent cohorts gathering 20 HV and 60 patients, 1 cluster grouped all HV with 12% of patients. The second cluster grouped 42% of patients and contained all non-survivors. The third cluster grouped 46% of patients, including 78% of those with nosocomial infections. The molecular features of these clusters indicated a distinctive contribution of previously described genes defining a "healthy-immune response" and a "sepsis-related host response". The third cluster was characterised by potential immune recovery that underlines the possible added value of SEB-based IFA to capture the sepsis immune response and contribute to personalised management.


Conflict of interest statement

CAV, GO, AP, KBP, JT and FM are employed by the in-vitro diagnostic company bioMérieux. FB is employed in a services company specialised in the management of data-related projects, Soladis. CAV, FM, STA and FB are co-inventors in one patent application. This does not alter the authors’ adherence to all the Scientific Reports policies on sharing data and materials. JL, TR, FV, VL, GM and BD declare no conflict of interest.

Figures

Figure 1
Figure 1
Contrasted response to LPS and SEB stimulation in healthy volunteers (HV) and septic shock patients. Venn diagrams for differentially expressed genes (adjusted p value < 0.05 in > 75% of tests) between 10 HV (white circle) and 30 septic shock patients (dashed circle) (A) upon LPS or (B) SEB stimulation for 24 h. Enriched-modulated pathways (Z-score positive activation, Z-score negative inhibition) derived from differentially expressed genes (using ingenuity analysis) for HV (solid bars) and septic shock patients (hashed bars) (C) upon LPS and (D) SEB stimulation. LPS lipopolysaccharide, SEB staphylococcal enterotoxin B.
Figure 2
Figure 2
Spatial distribution of healthy volunteers (HV) and septic shock patient’s response according to LPS and SEB stimulation. PCA of immune responses for (A) 10 HV (circles), (B) 30 septic shock patients (triangles) and (C) both populations after LPS (red) or SEB (green) stimulation, as well as basal condition (NUL; blue). The percentage of variance captured by each PC axis is indicated, as well as the total variance. Vector position for each sample was plotted and visualisation was executed with Partek. LPS lipopolysaccharide, SEB staphylococcal enterotoxin B, PCA principal component analysis, PC principal component.
Figure 3
Figure 3
Genes contributing to the higher variance in responses following LPS and SEB stimulation for healthy volunteers (HV) and septic shock patients. PCA of 10 HV (circles) and 30 septic shock patients (triangles) response (stimulation/NUL) to (A) LPS stimulation (red) and (B) SEB stimulation (green). Every donor is labelled. The percentage of variance captured by each PC axis is indicated, as well as the total variance. Vector position for each donor were plotted and visualisation was executed with Partek. The most important variables are plotted (representing 15% of the total variables weight for PC1 and PC2) for (C) LPS response and (D) SEB response. LPS lipopolysaccharide, SEB staphylococcal enterotoxin B, PCA principal component analysis, PC principal component.
Figure 4
Figure 4
Multivariate clustering analysis upon LPS and SEB stimulation. 10 healthy volunteers and 30 septic shock patients were treated as a whole to discriminate associative gene patterns. (A) LPS response revealed 3 clusters of individuals (L1; n = 10, L2; n = 27 and L3; n = 2) using hierarchical method and manhattan distances. (B) SEB response revealed 3 clusters in the discovery cohort (S1; n = 16, S2; n = 11 and S3; n = 12) using PAM method with correlation distance. The homemade dendogram is based on the distance between the individuals from the medoid of each cluster found by PAM. Darker purple colours on the heat map indicates higher fold change for upregulated genes (stimulation/control condition), while darker orange colours indicate higher fold change for downregulated genes. 10,000 AB/c was used as a threshold for high and low mHLA-DR. LPS lipopolysaccharide, SEB staphylococcal enterotoxin B, HLA-DR human leukocyte antigen DR, HAI hospital-acquired infection.
Figure 5
Figure 5
Multivariate clustering analysis upon SEB stimulation in the validation cohort. 10 healthy volunteers and 30 septic patients were treated as a whole to discriminate associative gene patterns. SEB response revealed 3 clusters (SV1; n = 11, SV2; n = 14 and SV3; n = 15) using PAM method with correlation distance. The homemade dendogram is based on the distance between the individuals from the medoid of each cluster found by PAM. Darker purple colours on the heat map indicates higher fold change for upregulated genes (stimulation/control condition), while darker orange colours indicate higher fold change for downregulated genes. 10,000 AB/c was used as a threshold for high and low mHLA-DR. SEB staphylococcal enterotoxin B, HLA-DR human leukocyte antigen DR, HAI hospital-acquired infection.

References

    1. Reinhart K, et al. Recognizing sepsis as a global health priority—a WHO resolution. N. Engl. J. Med. 2017;377:414–417. doi: 10.1056/NEJMp1707170. - DOI - PubMed
    1. Singer M, et al. The Third International Consensus Definitions for Sepsis and Septic Shock (Sepsis-3) JAMA. 2016;315:801–810. doi: 10.1001/jama.2016.0287. - DOI - PMC - PubMed
    1. Tamayo E, et al. Pro- and anti-inflammatory responses are regulated simultaneously from the first moments of septic shock. Eur. Cytokine Netw. 2011;22:82–87. doi: 10.1684/ecn.2011.0281. - DOI - PubMed
    1. Rubio I, et al. Current gaps in sepsis immunology: new opportunities for translational research. Lancet Infect. Dis. 2019;19:e422–e436. doi: 10.1016/S1473-3099(19)30567-5. - DOI - PubMed
    1. Hutchins NA, Unsinger J, Hotchkiss RS, Ayala A. The new normal: immunomodulatory agents against sepsis immune suppression. Trends Mol. Med. 2014;20:224–233. doi: 10.1016/j.molmed.2014.01.002. - DOI - PMC - PubMed

Publication types

MeSH terms